Plotting with Matplotlib#
The default plotting extension for HoloViews until a 2.0 release is Matplotlib when HoloViews will start defaulting to Bokeh (see the Plotting with Bokeh user guide).
While the 'bokeh' backend provides many useful interactive features, the 'matplotlib' plotting extension provides many additional features that are well suited to static exports for printed figures or static documents. To enable the 'matplotlib' backend, we can initialize the Holoviews notebook extension:
import numpy as np

import holoviews as hv
from holoviews import opts

hv.extension('matplotlib')


Working with matplotlib directly#
When HoloViews outputs matplotlib plots it creates and manipulates a matplotlib Figure, axes and artists in the background. If at any time you need access to the underlying matplotlib representation of an object you can use the hv.render function to convert it. For example let us convert a HoloViews Image to a matplotlib Figure, which will let us access and modify every aspect of the plot:
img = hv.Image(np.random.rand(10, 10))

fig = hv.render(img)

print('Figure: ', fig)
print('Axes:   ', fig.axes)
Figure:  Figure(400x400)
Axes:    [<Axes: xlabel='x', ylabel='y'>]
Setting Backend Opts#
HoloViews does not expose every single option from matplotlib.
Instead, HoloViews allow users to attach hooks to modify the plot object directly–but writing these hooks could be cumbersome, especially if it’s only used for a single line of update.
Fortunately, HoloViews allows backend_opts for the Matplotlib backend to configure options by declaring a dictionary with accessor specification for updating the plot components.
For example, here’s how to remove the frame on the legend.
plot = hv.Curve([1, 2, 3], label="a") * hv.Curve([1, 4, 9], label="b")
plot.opts(
    show_legend=True,
    backend_opts={
        "legend.frame_on": False,
    }
)

The following is the equivalent, as a hook.
def hook(plot, element):
    legend = plot.handles["legend"]
    legend.set_frame_on(False)

plot = hv.Curve([1, 2, 3], label="a") * hv.Curve([1, 4, 9], label="b")
plot.opts(
    show_legend=True,
    hooks=[hook]
)
Notice how much more concise it is with backend_opts, and it’s even possible to update items in a list.
For example you can set the first legend label’s fontsize!
plot = hv.Curve([1, 2, 3], label="a") * hv.Curve([1, 4, 9], label="b")
plot.opts(
    show_legend=True,
    backend_opts={"legend.get_texts()[0:2].fontsize": 18}
)

With knowledge of the methods in matplotlib, it’s possible to configure many other plot components besides legend. Some examples include colorbar, xaxis, yaxis, and much, much more.
If you’re unsure, simply input your best guess and it’ll try to provide a list of suggestions if there’s an issue.
Grid lines#
Grid lines can be controlled through the combination of show_grid and gridstyle parameters. The gridstyle allows specifying a number of options including the following:
color(orgrid_color)alpha(orgrid_alpha)linestyle(orgrid_linestyle)linewidth(orgrid_linewidth)
Here we combine some of these options to generate a complex grid pattern:
grid_style = {'grid_color': 'black', 'grid_linewidth': 1.5, 'xgrid_linestyle': 'dashed'}

hv.Points(np.random.rand(10, 2)).opts(gridstyle=grid_style, show_grid=True)

You can disable x or y grid lines individually by setting their alpha to 0.
grid_style = {'ygrid_alpha': 0}

hv.Points(np.random.rand(10, 2)).opts(gridstyle=grid_style, show_grid=True)

Static file format#
Matplotlib supports a wide range of export formats suitable for both web and print publishing. During interactive exploration in the Notebook, your results are always visible within the notebook itself, and usually png plots are good enough. To switch the default file format you can use the hv.output utility and control set fig option, supported formats include:
['png', 'svg', 'pdf']
however pdf output is not supported in the notebook. To demonstrate let us switch output to SVG:
hv.output(fig='svg')
Now when we create a plot in the notebook the output will be rendered as SVGs:
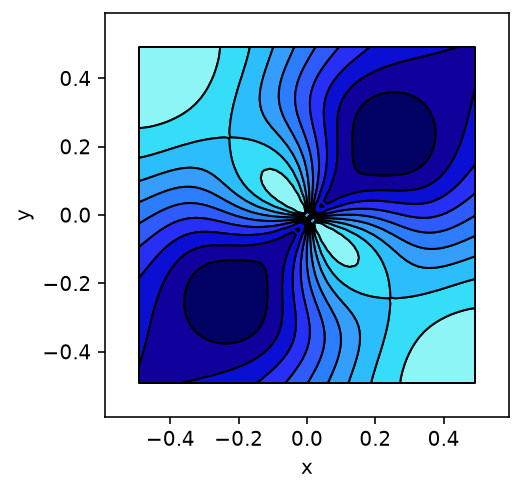
from holoviews.operation import contours

x = y = np.arange(-3.0, 3.0, 0.1)
X, Y = np.meshgrid(x, y)

def g(x,y,c):
    return 2*((x-y)**2/(x**2+y**2)) + np.exp(-(np.sqrt(x**2+y**2)-c)**2)

img = hv.Image(g(X,Y,2))
filled_contours = contours(img, filled=True)

filled_contours

The hv.save function allows exporting plots to all supported formats simply by changing the file extension. Certain formats support additional options, e.g. for png export we can also specify the dpi (dots per inch):
hv.save(filled_contours, 'contours.png', dpi=144)
To confirm the plot was exported correctly we can load it back in using IPython’s Image object:
from IPython.display import Image

Image('contours.png', width=400)
For a publication, you will usually want to select SVG format by changing the file extension, because this vector format preserves the full resolution of all text and drawing elements. SVG files can be be used in some document preparation programs directly (e.g. LibreOffice), and can easily be converted using e.g. Inkscape to PDF for use with PDFLaTeX or to EMF for use with Microsoft Word. They can also be edited using Inkscape or other vector drawing programs to move graphical elements around, add arbitrary text, etc., if you need to make final tweaks before using the figures in a document. You can also embed them within other SVG figures in such a drawing program, e.g. by creating a larger figure as a template that automatically incorporates multiple SVG files you have exported separately.
Animation support#
The 'matplotlib' backend supports animated outputs either as video (using mp4 or webm formats) or as animated GIFS. This is useful for output to web pages that users can view without needing to interact with. It can also be useful for creating descriptive pages for HoloViews constructs that require a live Python/Jupyter server rather than just a web page - see for example DynamicMap.
GIF#
In recent versions of matplotlib (>=2.2.0) GIF output can also be generated using pillow, which is what HoloViews uses by default. The pillow dependency can be installed using conda or pip using: conda install pillow or pip install pillow.
To display a plot The speed of the animation is controlled using the fps (frames per second):
holomap = hv.HoloMap([(t, hv.Image(g(X,Y, 4 * np.sin(np.pi*t)))) for t in np.linspace(0,1,21)]).opts(
    cmap='fire', colorbar=True, show_title=False, xaxis='bare', yaxis='bare')

contour_hmap = contours(holomap, filled=True)

hv.output(contour_hmap, holomap='gif', fps=5)

Animated output can also be exported using the save function by changing the file extension:
hv.save(contour_hmap, 'holomap.gif', fps=5)
Videos#
Video output in matplotlib depends on ffmpeg, which may be compiled from source, installed from conda using conda install ffmpeg, or installed on OSX using brew using brew install ffmpeg. To select video output use set the holomap format to 'mp4':
hv.output(contour_hmap, holomap='mp4', fps=5)
Plot size#
One of the major differences between the matplotlib extension and others is the way plot sizes work. In Plotly and Bokeh, plot sizes are inside out, i.e. each plot defines its height and can then be composed together as needed, while matplotlib defines the size of the figure and the size of each subplot is relative to that. This affords greater control over plot aspect but can also make things more difficult. In HoloViews the size of a plot can be controlled using a couple of main options
aspect: Determines the aspect ratio of a subplotfig_bounds: A four-tuple declaring the (left, bottom, right, top) of the plot in figure coordinates with a range of 0-1.fig_inches: The size of the plot in inches can be a single which will be scaled according to the plots aspect or a tuple specifying both width and height).fig_size: A percentage scaling factor.
For example assuming a dpi (dots per inch) of 72, setting fig_inches=5, aspect=2 and fig_bounds=(0, 0, 1, 1) should produce a plot roughly 720 pixels wide and 360 pixels in height:
hv.output(fig='png', dpi=72)
filled_contours.opts(aspect=2, fig_inches=5, fig_bounds=(0, 0, 1, 1))

This turns out to be not quite correct because any empty space will be clipped, e.g. the plot above is actually 603 × 318 pixels, however it is a good approximation.
Plot layouts#
Another aspect that differs quite substantially between matplotlib and other extension is the layout system. Since plots do not have an absolute size relative to one another it depends on the aspect of each plot. The main options to control the layout include:
aspect_weight: Whether to weight the aspect of plots when laying out plots (default=False).hspace: Horizontal spacing between subplots.tight: Whether to automatically reduce space between subplots.vspace: Vertical space between subplots.
First let us see what happens when we compose plots with different aspects, and use the tight option to reduce the vertical space between them (we could also manually reduce the vspace):
line_contours = contours(img).opts(aspect=3)
fill_contours = filled_contours.opts(aspect=2)

opts.defaults(opts.Layout(sublabel_format='', fig_size=150))

(line_contours + fill_contours).opts(tight=True)

We can see that the two subplots have very different heights, to equalize this we can enable the aspect_weight option, which will rescale the subplots:
(line_contours + fill_contours).opts(aspect_weight=True, tight=True)
