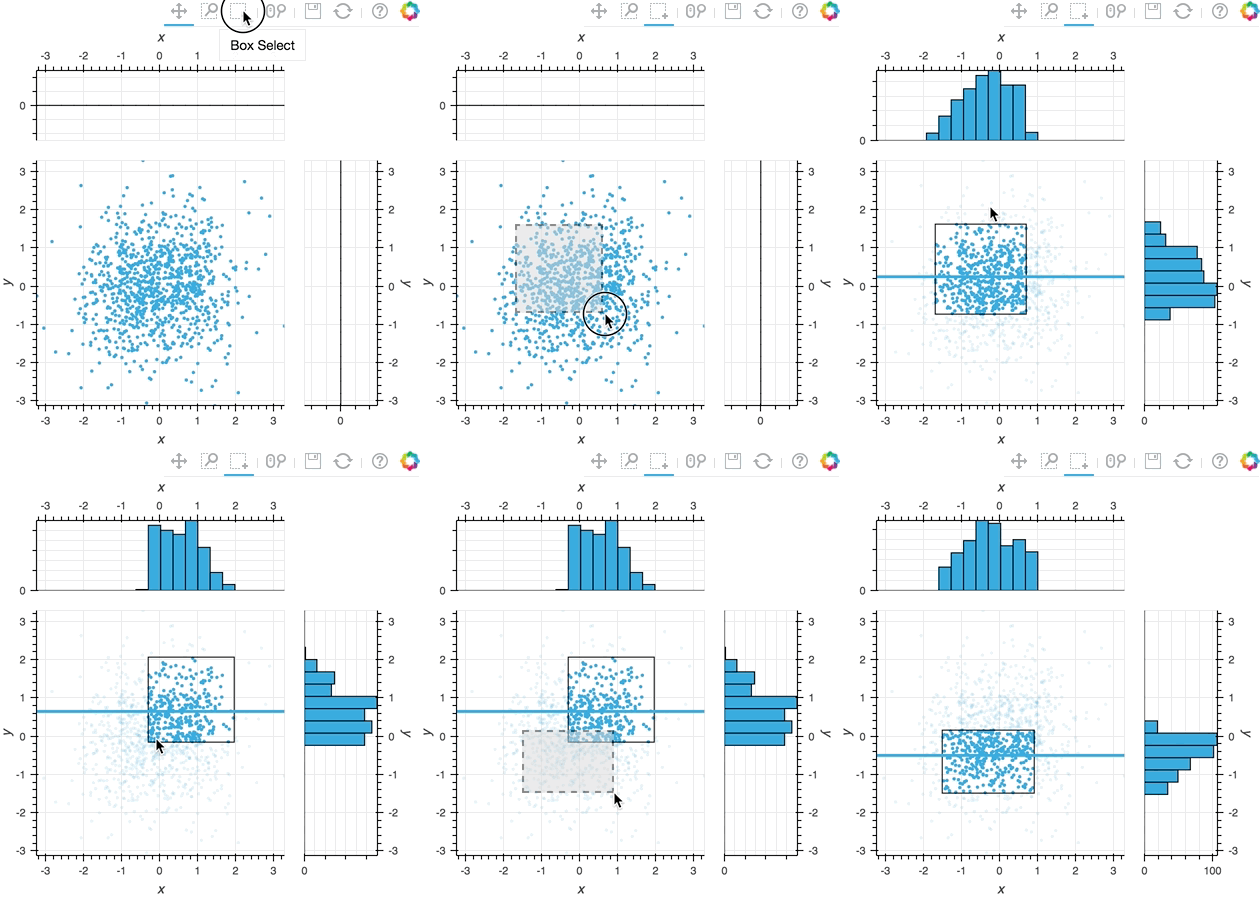
Bounds#
Download this notebook from GitHub (right-click to download).
Title: Bounds & selection stream example#
Description: A linked streams example demonstrating how to use Bounds and Selection streams together.
Dependencies Bokeh
import numpy as np

import holoviews as hv
from holoviews import opts, streams

hv.extension('bokeh')
opts.defaults(opts.Histogram(framewise=True))

# Declare distribution of Points
points = hv.Points(np.random.multivariate_normal((0, 0), [[1, 0.1], [0.1, 1]], (1000,)))

# Declare points selection selection
sel = streams.Selection1D(source=points)

# Declare DynamicMap computing mean y-value of selection
mean_sel = hv.DynamicMap(lambda index: hv.HLine(points['y'][index].mean() if index else -10),
                         kdims=[], streams=[sel])

# Declare a Bounds stream and DynamicMap to get box_select geometry and draw it
box = streams.BoundsXY(source=points, bounds=(0,0,0,0))
bounds = hv.DynamicMap(lambda bounds: hv.Bounds(bounds), streams=[box])

# Declare DynamicMap to apply bounds selection
dmap = hv.DynamicMap(lambda bounds: points.select(x=(bounds[0], bounds[2]),
                                                  y=(bounds[1], bounds[3])),
                     streams=[box])

# Compute histograms of selection along x-axis and y-axis
yhist = hv.operation.histogram(dmap, bin_range=points.range('y'), dimension='y', dynamic=True, normed=False)
xhist = hv.operation.histogram(dmap, bin_range=points.range('x'), dimension='x', dynamic=True, normed=False)

# Combine components and display
points * mean_sel * bounds << yhist << xhist

This web page was generated from a Jupyter notebook and not all interactivity will work on this website. Right click to download and run locally for full Python-backed interactivity.
Download this notebook from GitHub (right-click to download).
