holoviews.mpl Package 
mpl
Package
annotation
Module
-
class
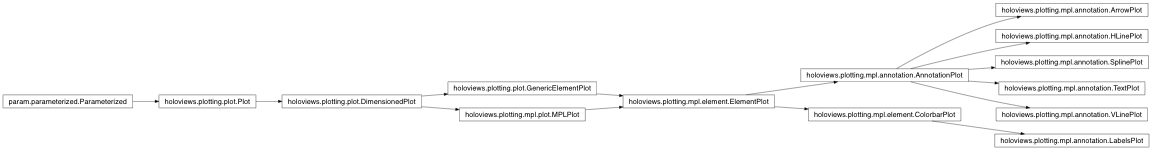
holoviews.plotting.mpl.annotation.AnnotationPlot( annotation , **params ) [source] ¶ -
Bases:
holoviews.plotting.mpl.element.ElementPlotAnnotationPlot handles the display of all annotation elements.
-
param Parameter
fontsize( allow_None=True, constant=False, default=None, instantiate=False, pickle_default_value=True, precedence=None, readonly=False, watchers={} ) - Specifies various font sizes of the displayed text. Finer control is available by supplying a dictionary where any unmentioned keys revert to the default sizes, e.g: {‘ticks’:20, ‘title’:15, ‘ylabel’:5, ‘xlabel’:5, ‘zlabel’:5, ‘legend’:8, ‘legend_title’:13} You can set the font size of ‘zlabel’, ‘ylabel’ and ‘xlabel’ together using the ‘labels’ key.
-
param Boolean
show_title( allow_None=False, bounds=(0, 1), constant=False, default=True, instantiate=False, pickle_default_value=True, precedence=None, readonly=False, watchers={} ) - Whether to display the plot title.
-
param String
title( allow_None=False, basestring=<class ‘str’>, constant=False, default={label} {group} {dimensions}, instantiate=False, pickle_default_value=True, precedence=None, readonly=False, regex=None, watchers={} ) - The formatting string for the title of this plot, allows defining a label group separator and dimension labels.
-
param String
title_format( allow_None=True, basestring=<class ‘str’>, constant=False, default=None, instantiate=False, pickle_default_value=True, precedence=None, readonly=False, regex=None, watchers={} ) - Alias for title.
-
param Boolean
normalize( allow_None=False, bounds=(0, 1), constant=False, default=True, instantiate=False, pickle_default_value=True, precedence=None, readonly=False, watchers={} ) - Whether to compute ranges across all Elements at this level of plotting. Allows selecting normalization at different levels for nested data containers.
-
param Parameter
projection( allow_None=True, constant=False, default=None, instantiate=False, pickle_default_value=True, precedence=None, readonly=False, watchers={} ) - The projection of the plot axis, default of None is equivalent to 2D plot, ‘3d’ and ‘polar’ are also supported by matplotlib by default. May also supply a custom projection that is either a matplotlib projection type or implements the _as_mpl_axes method.
-
param Number
fig_alpha( allow_None=False, bounds=(0, 1), constant=False, default=1.0, inclusive_bounds=(True, True), instantiate=False, pickle_default_value=True, precedence=None, readonly=False, softbounds=None, time_dependent=False, time_fn=<Time Time00001>, watchers={} ) - Alpha of the overall figure background.
-
param NumericTuple
fig_bounds( allow_None=False, constant=False, default=(0.15, 0.15, 0.85, 0.85), instantiate=False, length=4, pickle_default_value=True, precedence=None, readonly=False, watchers={} ) - The bounds of the overall figure as a 4-tuple of the form (left, bottom, right, top), defining the size of the border around the subplots.
-
param Parameter
fig_inches( allow_None=False, constant=False, default=4, instantiate=False, pickle_default_value=True, precedence=None, readonly=False, watchers={} ) - The overall matplotlib figure size in inches. May be set as an integer in which case it will be used to autocompute a size. Alternatively may be set with an explicit tuple or list, in which case it will be applied directly after being scaled by fig_size. If either the width or height is set to None, it will be computed automatically.
-
param Boolean
fig_latex( allow_None=False, bounds=(0, 1), constant=False, default=False, instantiate=False, pickle_default_value=True, precedence=None, readonly=False, watchers={} ) - Whether to use LaTeX text in the overall figure.
-
param Dict
fig_rcparams( allow_None=False, constant=False, default={}, instantiate=True, is_instance=True, pickle_default_value=True, precedence=None, readonly=False, watchers={} ) - matplotlib rc parameters to apply to the overall figure.
-
param Number
fig_size( allow_None=False, bounds=(1, None), constant=False, default=100.0, inclusive_bounds=(True, True), instantiate=False, pickle_default_value=True, precedence=None, readonly=False, softbounds=None, time_dependent=False, time_fn=<Time Time00001>, watchers={} ) - Size relative to the supplied overall fig_inches in percent.
-
param HookList
initial_hooks( allow_None=False, bounds=(0, None), constant=False, default=[], instantiate=True, pickle_default_value=True, precedence=None, readonly=False, watchers={} ) - Optional list of hooks called before plotting the data onto the axis (now marked for deprecation). The hook is passed the plot object and the displayed object; other plotting handles can be accessed via plot.handles.
-
param HookList
finalize_hooks( allow_None=False, bounds=(0, None), constant=False, default=[], instantiate=True, pickle_default_value=True, precedence=None, readonly=False, watchers={} ) - Deprecated; use hooks options instead.
-
param HookList
hooks( allow_None=False, bounds=(0, None), constant=False, default=[], instantiate=True, pickle_default_value=True, precedence=None, readonly=False, watchers={} ) - Optional list of hooks called when finalizing a plot. The hook is passed the plot object and the displayed element, and other plotting handles can be accessed via plot.handles.
-
param String
sublabel_format( allow_None=True, basestring=<class ‘str’>, constant=False, default=None, instantiate=False, pickle_default_value=True, precedence=None, readonly=False, regex=None, watchers={} ) - Allows labeling the subaxes in each plot with various formatters including {Alpha}, {alpha}, {numeric} and {roman}.
-
param NumericTuple
sublabel_position( allow_None=False, constant=False, default=(-0.35, 0.85), instantiate=False, length=2, pickle_default_value=True, precedence=None, readonly=False, watchers={} ) - Position relative to the plot for placing the optional subfigure label.
-
param Number
sublabel_size( allow_None=False, bounds=None, constant=False, default=18, inclusive_bounds=(True, True), instantiate=False, pickle_default_value=True, precedence=None, readonly=False, softbounds=None, time_dependent=False, time_fn=<Time Time00001>, watchers={} ) - Size of optional subfigure label.
-
param Boolean
show_frame( allow_None=False, bounds=(0, 1), constant=False, default=False, instantiate=False, pickle_default_value=True, precedence=None, readonly=False, watchers={} ) - Whether or not to show a complete frame around the plot.
-
param Boolean
apply_ranges( allow_None=False, bounds=(0, 1), constant=False, default=True, instantiate=False, pickle_default_value=True, precedence=None, readonly=False, watchers={} ) - Whether to compute the plot bounds from the data itself.
-
param Boolean
apply_extents( allow_None=False, bounds=(0, 1), constant=False, default=True, instantiate=False, pickle_default_value=True, precedence=None, readonly=False, watchers={} ) - Whether to apply extent overrides on the Elements
-
param ClassSelector
bgcolor( allow_None=True, constant=False, default=None, instantiate=True, is_instance=True, pickle_default_value=True, precedence=None, readonly=False, watchers={} ) - If set bgcolor overrides the background color of the axis.
-
param ClassSelector
default_span( allow_None=False, constant=False, default=2.0, instantiate=True, is_instance=True, pickle_default_value=True, precedence=None, readonly=False, watchers={} ) - Defines the span of an axis if the axis range is zero, i.e. if the lower and upper end of an axis are equal or no range is defined at all. For example if there is a single datapoint at 0 a default_span of 2.0 will result in axis ranges spanning from -1 to 1.
-
param Boolean
invert_axes( allow_None=False, bounds=(0, 1), constant=False, default=False, instantiate=False, pickle_default_value=True, precedence=None, readonly=False, watchers={} ) - Whether to invert the x- and y-axis
-
param Boolean
invert_xaxis( allow_None=False, bounds=(0, 1), constant=False, default=False, instantiate=False, pickle_default_value=True, precedence=None, readonly=False, watchers={} ) - Whether to invert the plot x-axis.
-
param Boolean
invert_yaxis( allow_None=False, bounds=(0, 1), constant=False, default=False, instantiate=False, pickle_default_value=True, precedence=None, readonly=False, watchers={} ) - Whether to invert the plot y-axis.
-
param Boolean
logx( allow_None=False, bounds=(0, 1), constant=False, default=False, instantiate=False, pickle_default_value=True, precedence=None, readonly=False, watchers={} ) - Whether the x-axis of the plot will be a log axis.
-
param Boolean
logy( allow_None=False, bounds=(0, 1), constant=False, default=False, instantiate=False, pickle_default_value=True, precedence=None, readonly=False, watchers={} ) - Whether the y-axis of the plot will be a log axis.
-
param ClassSelector
padding( allow_None=False, constant=False, default=0, instantiate=True, is_instance=True, pickle_default_value=True, precedence=None, readonly=False, watchers={} ) - Fraction by which to increase auto-ranged extents to make datapoints more visible around borders. To compute padding, the axis whose screen size is largest is chosen, and the range of that axis is increased by the specified fraction along each axis. Other axes are then padded ensuring that the amount of screen space devoted to padding is equal for all axes. If specified as a tuple, the int or float values in the tuple will be used for padding in each axis, in order (x,y or x,y,z). For example, for padding=0.2 on a 800x800-pixel plot, an x-axis with the range [0,10] will be padded by 20% to be [-1,11], while a y-axis with a range [0,1000] will be padded to be [-100,1100], which should make the padding be approximately the same number of pixels. But if the same plot is changed to have a height of only 200, the y-range will then be [-400,1400] so that the y-axis padding will still match that of the x-axis. It is also possible to declare non-equal padding value for the lower and upper bound of an axis by supplying nested tuples, e.g. padding=(0.1, (0, 0.1)) will pad the x-axis lower and upper bound as well as the y-axis upper bound by a fraction of 0.1 while the y-axis lower bound is not padded at all.
-
param Boolean
show_legend( allow_None=False, bounds=(0, 1), constant=False, default=False, instantiate=False, pickle_default_value=True, precedence=None, readonly=False, watchers={} ) - Whether to show legend for the plot.
-
param Boolean
show_grid( allow_None=False, bounds=(0, 1), constant=False, default=False, instantiate=False, pickle_default_value=True, precedence=None, readonly=False, watchers={} ) - Whether to show a Cartesian grid on the plot.
-
param ObjectSelector
xaxis( allow_None=None, check_on_set=True, compute_default_fn=None, constant=False, default=bottom, instantiate=False, names=None, objects=[‘top’, ‘bottom’, ‘bare’, ‘top-bare’, ‘bottom-bare’, None, True, False], pickle_default_value=True, precedence=None, readonly=False, watchers={} ) - Whether and where to display the xaxis. The “bare” options allow suppressing all axis labels, including ticks and xlabel. Valid options are ‘top’, ‘bottom’, ‘bare’, ‘top-bare’ and ‘bottom-bare’.
-
param ObjectSelector
yaxis( allow_None=None, check_on_set=True, compute_default_fn=None, constant=False, default=left, instantiate=False, names=None, objects=[‘left’, ‘right’, ‘bare’, ‘left-bare’, ‘right-bare’, None, True, False], pickle_default_value=True, precedence=None, readonly=False, watchers={} ) - Whether and where to display the yaxis. The “bare” options allow suppressing all axis labels, including ticks and ylabel. Valid options are ‘left’, ‘right’, ‘bare’, ‘left-bare’ and ‘right-bare’.
-
param String
xlabel( allow_None=True, basestring=<class ‘str’>, constant=False, default=None, instantiate=False, pickle_default_value=True, precedence=None, readonly=False, regex=None, watchers={} ) - An explicit override of the x-axis label, if set takes precedence over the dimension label.
-
param String
ylabel( allow_None=True, basestring=<class ‘str’>, constant=False, default=None, instantiate=False, pickle_default_value=True, precedence=None, readonly=False, regex=None, watchers={} ) - An explicit override of the y-axis label, if set takes precedence over the dimension label.
-
param NumericTuple
xlim( allow_None=False, constant=False, default=(nan, nan), instantiate=False, length=2, pickle_default_value=True, precedence=None, readonly=False, watchers={} ) - User-specified x-axis range limits for the plot, as a tuple (low,high). If specified, takes precedence over data and dimension ranges.
-
param NumericTuple
ylim( allow_None=False, constant=False, default=(nan, nan), instantiate=False, length=2, pickle_default_value=True, precedence=None, readonly=False, watchers={} ) - User-specified x-axis range limits for the plot, as a tuple (low,high). If specified, takes precedence over data and dimension ranges.
-
param NumericTuple
zlim( allow_None=False, constant=False, default=(nan, nan), instantiate=False, length=2, pickle_default_value=True, precedence=None, readonly=False, watchers={} ) - User-specified z-axis range limits for the plot, as a tuple (low,high). If specified, takes precedence over data and dimension ranges.
-
param Integer
xrotation( allow_None=True, bounds=(0, 360), constant=False, default=None, inclusive_bounds=(True, True), instantiate=False, pickle_default_value=True, precedence=None, readonly=False, softbounds=None, time_dependent=False, time_fn=<Time Time00001>, watchers={} ) - Rotation angle of the xticks.
-
param Integer
yrotation( allow_None=True, bounds=(0, 360), constant=False, default=None, inclusive_bounds=(True, True), instantiate=False, pickle_default_value=True, precedence=None, readonly=False, softbounds=None, time_dependent=False, time_fn=<Time Time00001>, watchers={} ) - Rotation angle of the yticks.
-
param Parameter
xticks( allow_None=True, constant=False, default=None, instantiate=False, pickle_default_value=True, precedence=None, readonly=False, watchers={} ) - Ticks along x-axis specified as an integer, explicit list of tick locations, or bokeh Ticker object. If set to None default bokeh ticking behavior is applied.
-
param Parameter
yticks( allow_None=True, constant=False, default=None, instantiate=False, pickle_default_value=True, precedence=None, readonly=False, watchers={} ) - Ticks along y-axis specified as an integer, explicit list of tick locations, or bokeh Ticker object. If set to None default bokeh ticking behavior is applied.
-
param Boolean
apply_ticks( allow_None=False, bounds=(0, 1), constant=False, default=True, instantiate=False, pickle_default_value=True, precedence=None, readonly=False, watchers={} ) - Whether to apply custom ticks.
-
param Parameter
aspect( allow_None=False, constant=False, default=square, instantiate=False, pickle_default_value=True, precedence=None, readonly=False, watchers={} ) - The aspect ratio mode of the plot. By default, a plot may select its own appropriate aspect ratio but sometimes it may be necessary to force a square aspect ratio (e.g. to display the plot as an element of a grid). The modes ‘auto’ and ‘equal’ correspond to the axis modes of the same name in matplotlib, a numeric value may also be passed.
-
param Boolean
invert_zaxis( allow_None=False, bounds=(0, 1), constant=False, default=False, instantiate=False, pickle_default_value=True, precedence=None, readonly=False, watchers={} ) - Whether to invert the plot z-axis.
-
param List
labelled( allow_None=False, bounds=(0, None), constant=False, default=[‘x’, ‘y’], instantiate=True, pickle_default_value=True, precedence=None, readonly=False, watchers={} ) - Whether to plot the ‘x’ and ‘y’ labels.
-
param Boolean
logz( allow_None=False, bounds=(0, 1), constant=False, default=False, instantiate=False, pickle_default_value=True, precedence=None, readonly=False, watchers={} ) - Whether to apply log scaling to the y-axis of the Chart.
-
param ClassSelector
xformatter( allow_None=True, constant=False, default=None, instantiate=True, is_instance=True, pickle_default_value=True, precedence=None, readonly=False, watchers={} ) - Formatter for ticks along the x-axis.
-
param ClassSelector
yformatter( allow_None=True, constant=False, default=None, instantiate=True, is_instance=True, pickle_default_value=True, precedence=None, readonly=False, watchers={} ) - Formatter for ticks along the y-axis.
-
param ClassSelector
zformatter( allow_None=True, constant=False, default=None, instantiate=True, is_instance=True, pickle_default_value=True, precedence=None, readonly=False, watchers={} ) - Formatter for ticks along the z-axis.
-
param Boolean
zaxis( allow_None=False, bounds=(0, 1), constant=False, default=True, instantiate=False, pickle_default_value=True, precedence=None, readonly=False, watchers={} ) - Whether to display the z-axis.
-
param String
zlabel( allow_None=True, basestring=<class ‘str’>, constant=False, default=None, instantiate=False, pickle_default_value=True, precedence=None, readonly=False, regex=None, watchers={} ) - An explicit override of the z-axis label, if set takes precedence over the dimension label.
-
param Integer
zrotation( allow_None=False, bounds=(0, 360), constant=False, default=0, inclusive_bounds=(True, True), instantiate=False, pickle_default_value=True, precedence=None, readonly=False, softbounds=None, time_dependent=False, time_fn=<Time Time00001>, watchers={} ) - Rotation angle of the zticks.
-
param Parameter
zticks( allow_None=True, constant=False, default=None, instantiate=False, pickle_default_value=True, precedence=None, readonly=False, watchers={} ) - Ticks along z-axis specified as an integer, explicit list of tick locations, list of tuples containing the locations and labels or a matplotlib tick locator object. If set to None default matplotlib ticking behavior is applied.
-
anim( start=0 , stop=None , fps=30 ) ¶ -
Method to return a matplotlib animation. The start and stop frames may be specified as well as the fps.
-
cleanup( ) ¶ -
Cleans up references to the plot on the attached Stream subscribers.
-
compute_ranges( obj , key , ranges ) ¶ -
Given an object, a specific key, and the normalization options, this method will find the specified normalization options on the appropriate OptionTree, group the elements according to the selected normalization option (i.e. either per frame or over the whole animation) and finally compute the dimension ranges in each group. The new set of ranges is returned.
-
debug( *args , **kwargs ) ¶ -
Inspect .param.debug method for the full docstring
-
defaults( *args , **kwargs ) ¶ -
Inspect .param.defaults method for the full docstring
-
force_new_dynamic_value= functools.partial(<function Parameters.deprecate.<locals>.inner>, <class 'holoviews.plotting.mpl.annotation.AnnotationPlot'>) 
-
get_aspect( xspan , yspan ) ¶ -
Computes the aspect ratio of the plot
-
get_extents( element , ranges , range_type='combined' , xdim=None , ydim=None , zdim=None ) ¶ -
Gets the extents for the axes from the current Element. The globally computed ranges can optionally override the extents.
The extents are computed by combining the data ranges, extents and dimension ranges. Each of these can be obtained individually by setting the range_type to one of:
- ‘data’: Just the data ranges
- ‘extents’: Element.extents
- ‘soft’: Dimension.soft_range values
- ‘hard’: Dimension.range values
To obtain the combined range, which includes range padding the default may be used:
- ‘combined’: All the range types combined and padding applied
This allows Overlay plots to obtain each range and combine them appropriately for all the objects in the overlay.
-
get_padding( extents ) ¶ -
Computes padding along the axes taking into account the plot aspect.
-
get_param_values= functools.partial(<function Parameters.deprecate.<locals>.inner>, <class 'holoviews.plotting.mpl.annotation.AnnotationPlot'>) 
-
get_value_generator= functools.partial(<function Parameters.deprecate.<locals>.inner>, <class 'holoviews.plotting.mpl.annotation.AnnotationPlot'>) 
-
get_zorder( overlay , key , el ) ¶ -
Computes the z-order of element in the NdOverlay taking into account possible batching of elements.
-
init_artists( ax , plot_args , plot_kwargs ) ¶ -
Initializes the artist based on the plot method declared on the plot.
-
init_comm( ) ¶ -
Initializes comm and attaches streams.
-
inspect_value= functools.partial(<function Parameters.deprecate.<locals>.inner>, <class 'holoviews.plotting.mpl.annotation.AnnotationPlot'>) 
-
matches( spec ) ¶ -
Matches a specification against the current Plot.
-
message( *args , **kwargs ) ¶ -
Inspect .param.message method for the full docstring
-
params( *args , **kwargs ) ¶ -
Inspect .param.params method for the full docstring
-
pprint( imports=None , prefix=' ' , unknown_value='<?>' , qualify=False , separator='' ) ¶ -
(Experimental) Pretty printed representation that may be evaluated with eval. See pprint() function for more details.
-
print_param_defaults( *args , **kwargs ) ¶ -
Inspect .param.print_param_defaults method for the full docstring
-
print_param_values( *args , **kwargs ) ¶ -
Inspect .param.print_param_values method for the full docstring
-
push( ) ¶ -
Pushes updated plot data via the Comm.
-
refresh( **kwargs ) ¶ -
Refreshes the plot by rerendering it and then pushing the updated data if the plot has an associated Comm.
-
script_repr( imports=[] , prefix=' ' ) ¶ -
Variant of __repr__ designed for generating a runnable script.
-
set_default( *args , **kwargs ) ¶ -
Inspect .param.set_default method for the full docstring
-
set_dynamic_time_fn= functools.partial(<function Parameters.deprecate.<locals>.inner>, <class 'holoviews.plotting.mpl.annotation.AnnotationPlot'>) 
-
set_param= functools.partial(<function Parameters.deprecate.<locals>.inner>, <class 'holoviews.plotting.mpl.annotation.AnnotationPlot'>) 
-
state_pop( ) ¶ -
Restore the most recently saved state.
See state_push() for more details.
-
state_push( ) ¶ -
Save this instance’s state.
For Parameterized instances, this includes the state of dynamically generated values.
Subclasses that maintain short-term state should additionally save and restore that state using state_push() and state_pop().
Generally, this method is used by operations that need to test something without permanently altering the objects’ state.
-
teardown_handles( ) ¶ -
If no custom update_handles method is supplied this method is called to tear down any previous handles before replacing them.
-
traverse( fn=None , specs=None , full_breadth=True ) ¶ -
Traverses any nested DimensionedPlot returning a list of all plots that match the specs. The specs should be supplied as a list of either Plot types or callables, which should return a boolean given the plot class.
-
verbose( *args , **kwargs ) ¶ -
Inspect .param.verbose method for the full docstring
-
warning( *args , **kwargs ) ¶ -
Inspect .param.warning method for the full docstring
-
param Parameter
-
class
holoviews.plotting.mpl.annotation.ArrowPlot( annotation , **params ) [source] ¶ -
Bases:
holoviews.plotting.mpl.annotation.AnnotationPlotDraw an arrow using the information supplied to the Arrow annotation
-
param Parameter
fontsize( allow_None=True, constant=False, default=None, instantiate=False, pickle_default_value=True, precedence=None, readonly=False, watchers={} ) - Specifies various font sizes of the displayed text. Finer control is available by supplying a dictionary where any unmentioned keys revert to the default sizes, e.g: {‘ticks’:20, ‘title’:15, ‘ylabel’:5, ‘xlabel’:5, ‘zlabel’:5, ‘legend’:8, ‘legend_title’:13} You can set the font size of ‘zlabel’, ‘ylabel’ and ‘xlabel’ together using the ‘labels’ key.
-
param Boolean
show_title( allow_None=False, bounds=(0, 1), constant=False, default=True, instantiate=False, pickle_default_value=True, precedence=None, readonly=False, watchers={} ) - Whether to display the plot title.
-
param String
title( allow_None=False, basestring=<class ‘str’>, constant=False, default={label} {group} {dimensions}, instantiate=False, pickle_default_value=True, precedence=None, readonly=False, regex=None, watchers={} ) - The formatting string for the title of this plot, allows defining a label group separator and dimension labels.
-
param String
title_format( allow_None=True, basestring=<class ‘str’>, constant=False, default=None, instantiate=False, pickle_default_value=True, precedence=None, readonly=False, regex=None, watchers={} ) - Alias for title.
-
param Boolean
normalize( allow_None=False, bounds=(0, 1), constant=False, default=True, instantiate=False, pickle_default_value=True, precedence=None, readonly=False, watchers={} ) - Whether to compute ranges across all Elements at this level of plotting. Allows selecting normalization at different levels for nested data containers.
-
param Parameter
projection( allow_None=True, constant=False, default=None, instantiate=False, pickle_default_value=True, precedence=None, readonly=False, watchers={} ) - The projection of the plot axis, default of None is equivalent to 2D plot, ‘3d’ and ‘polar’ are also supported by matplotlib by default. May also supply a custom projection that is either a matplotlib projection type or implements the _as_mpl_axes method.
-
param Number
fig_alpha( allow_None=False, bounds=(0, 1), constant=False, default=1.0, inclusive_bounds=(True, True), instantiate=False, pickle_default_value=True, precedence=None, readonly=False, softbounds=None, time_dependent=False, time_fn=<Time Time00001>, watchers={} ) - Alpha of the overall figure background.
-
param NumericTuple
fig_bounds( allow_None=False, constant=False, default=(0.15, 0.15, 0.85, 0.85), instantiate=False, length=4, pickle_default_value=True, precedence=None, readonly=False, watchers={} ) - The bounds of the overall figure as a 4-tuple of the form (left, bottom, right, top), defining the size of the border around the subplots.
-
param Parameter
fig_inches( allow_None=False, constant=False, default=4, instantiate=False, pickle_default_value=True, precedence=None, readonly=False, watchers={} ) - The overall matplotlib figure size in inches. May be set as an integer in which case it will be used to autocompute a size. Alternatively may be set with an explicit tuple or list, in which case it will be applied directly after being scaled by fig_size. If either the width or height is set to None, it will be computed automatically.
-
param Boolean
fig_latex( allow_None=False, bounds=(0, 1), constant=False, default=False, instantiate=False, pickle_default_value=True, precedence=None, readonly=False, watchers={} ) - Whether to use LaTeX text in the overall figure.
-
param Dict
fig_rcparams( allow_None=False, constant=False, default={}, instantiate=True, is_instance=True, pickle_default_value=True, precedence=None, readonly=False, watchers={} ) - matplotlib rc parameters to apply to the overall figure.
-
param Number
fig_size( allow_None=False, bounds=(1, None), constant=False, default=100.0, inclusive_bounds=(True, True), instantiate=False, pickle_default_value=True, precedence=None, readonly=False, softbounds=None, time_dependent=False, time_fn=<Time Time00001>, watchers={} ) - Size relative to the supplied overall fig_inches in percent.
-
param HookList
initial_hooks( allow_None=False, bounds=(0, None), constant=False, default=[], instantiate=True, pickle_default_value=True, precedence=None, readonly=False, watchers={} ) - Optional list of hooks called before plotting the data onto the axis (now marked for deprecation). The hook is passed the plot object and the displayed object; other plotting handles can be accessed via plot.handles.
-
param HookList
finalize_hooks( allow_None=False, bounds=(0, None), constant=False, default=[], instantiate=True, pickle_default_value=True, precedence=None, readonly=False, watchers={} ) - Deprecated; use hooks options instead.
-
param HookList
hooks( allow_None=False, bounds=(0, None), constant=False, default=[], instantiate=True, pickle_default_value=True, precedence=None, readonly=False, watchers={} ) - Optional list of hooks called when finalizing a plot. The hook is passed the plot object and the displayed element, and other plotting handles can be accessed via plot.handles.
-
param String
sublabel_format( allow_None=True, basestring=<class ‘str’>, constant=False, default=None, instantiate=False, pickle_default_value=True, precedence=None, readonly=False, regex=None, watchers={} ) - Allows labeling the subaxes in each plot with various formatters including {Alpha}, {alpha}, {numeric} and {roman}.
-
param NumericTuple
sublabel_position( allow_None=False, constant=False, default=(-0.35, 0.85), instantiate=False, length=2, pickle_default_value=True, precedence=None, readonly=False, watchers={} ) - Position relative to the plot for placing the optional subfigure label.
-
param Number
sublabel_size( allow_None=False, bounds=None, constant=False, default=18, inclusive_bounds=(True, True), instantiate=False, pickle_default_value=True, precedence=None, readonly=False, softbounds=None, time_dependent=False, time_fn=<Time Time00001>, watchers={} ) - Size of optional subfigure label.
-
param Boolean
show_frame( allow_None=False, bounds=(0, 1), constant=False, default=False, instantiate=False, pickle_default_value=True, precedence=None, readonly=False, watchers={} ) - Whether or not to show a complete frame around the plot.
-
param Boolean
apply_ranges( allow_None=False, bounds=(0, 1), constant=False, default=True, instantiate=False, pickle_default_value=True, precedence=None, readonly=False, watchers={} ) - Whether to compute the plot bounds from the data itself.
-
param Boolean
apply_extents( allow_None=False, bounds=(0, 1), constant=False, default=True, instantiate=False, pickle_default_value=True, precedence=None, readonly=False, watchers={} ) - Whether to apply extent overrides on the Elements
-
param ClassSelector
bgcolor( allow_None=True, constant=False, default=None, instantiate=True, is_instance=True, pickle_default_value=True, precedence=None, readonly=False, watchers={} ) - If set bgcolor overrides the background color of the axis.
-
param ClassSelector
default_span( allow_None=False, constant=False, default=2.0, instantiate=True, is_instance=True, pickle_default_value=True, precedence=None, readonly=False, watchers={} ) - Defines the span of an axis if the axis range is zero, i.e. if the lower and upper end of an axis are equal or no range is defined at all. For example if there is a single datapoint at 0 a default_span of 2.0 will result in axis ranges spanning from -1 to 1.
-
param Boolean
invert_axes( allow_None=False, bounds=(0, 1), constant=False, default=False, instantiate=False, pickle_default_value=True, precedence=None, readonly=False, watchers={} ) - Whether to invert the x- and y-axis
-
param Boolean
invert_xaxis( allow_None=False, bounds=(0, 1), constant=False, default=False, instantiate=False, pickle_default_value=True, precedence=None, readonly=False, watchers={} ) - Whether to invert the plot x-axis.
-
param Boolean
invert_yaxis( allow_None=False, bounds=(0, 1), constant=False, default=False, instantiate=False, pickle_default_value=True, precedence=None, readonly=False, watchers={} ) - Whether to invert the plot y-axis.
-
param Boolean
logx( allow_None=False, bounds=(0, 1), constant=False, default=False, instantiate=False, pickle_default_value=True, precedence=None, readonly=False, watchers={} ) - Whether the x-axis of the plot will be a log axis.
-
param Boolean
logy( allow_None=False, bounds=(0, 1), constant=False, default=False, instantiate=False, pickle_default_value=True, precedence=None, readonly=False, watchers={} ) - Whether the y-axis of the plot will be a log axis.
-
param ClassSelector
padding( allow_None=False, constant=False, default=0, instantiate=True, is_instance=True, pickle_default_value=True, precedence=None, readonly=False, watchers={} ) - Fraction by which to increase auto-ranged extents to make datapoints more visible around borders. To compute padding, the axis whose screen size is largest is chosen, and the range of that axis is increased by the specified fraction along each axis. Other axes are then padded ensuring that the amount of screen space devoted to padding is equal for all axes. If specified as a tuple, the int or float values in the tuple will be used for padding in each axis, in order (x,y or x,y,z). For example, for padding=0.2 on a 800x800-pixel plot, an x-axis with the range [0,10] will be padded by 20% to be [-1,11], while a y-axis with a range [0,1000] will be padded to be [-100,1100], which should make the padding be approximately the same number of pixels. But if the same plot is changed to have a height of only 200, the y-range will then be [-400,1400] so that the y-axis padding will still match that of the x-axis. It is also possible to declare non-equal padding value for the lower and upper bound of an axis by supplying nested tuples, e.g. padding=(0.1, (0, 0.1)) will pad the x-axis lower and upper bound as well as the y-axis upper bound by a fraction of 0.1 while the y-axis lower bound is not padded at all.
-
param Boolean
show_legend( allow_None=False, bounds=(0, 1), constant=False, default=False, instantiate=False, pickle_default_value=True, precedence=None, readonly=False, watchers={} ) - Whether to show legend for the plot.
-
param Boolean
show_grid( allow_None=False, bounds=(0, 1), constant=False, default=False, instantiate=False, pickle_default_value=True, precedence=None, readonly=False, watchers={} ) - Whether to show a Cartesian grid on the plot.
-
param ObjectSelector
xaxis( allow_None=None, check_on_set=True, compute_default_fn=None, constant=False, default=bottom, instantiate=False, names=None, objects=[‘top’, ‘bottom’, ‘bare’, ‘top-bare’, ‘bottom-bare’, None, True, False], pickle_default_value=True, precedence=None, readonly=False, watchers={} ) - Whether and where to display the xaxis. The “bare” options allow suppressing all axis labels, including ticks and xlabel. Valid options are ‘top’, ‘bottom’, ‘bare’, ‘top-bare’ and ‘bottom-bare’.
-
param ObjectSelector
yaxis( allow_None=None, check_on_set=True, compute_default_fn=None, constant=False, default=left, instantiate=False, names=None, objects=[‘left’, ‘right’, ‘bare’, ‘left-bare’, ‘right-bare’, None, True, False], pickle_default_value=True, precedence=None, readonly=False, watchers={} ) - Whether and where to display the yaxis. The “bare” options allow suppressing all axis labels, including ticks and ylabel. Valid options are ‘left’, ‘right’, ‘bare’, ‘left-bare’ and ‘right-bare’.
-
param String
xlabel( allow_None=True, basestring=<class ‘str’>, constant=False, default=None, instantiate=False, pickle_default_value=True, precedence=None, readonly=False, regex=None, watchers={} ) - An explicit override of the x-axis label, if set takes precedence over the dimension label.
-
param String
ylabel( allow_None=True, basestring=<class ‘str’>, constant=False, default=None, instantiate=False, pickle_default_value=True, precedence=None, readonly=False, regex=None, watchers={} ) - An explicit override of the y-axis label, if set takes precedence over the dimension label.
-
param NumericTuple
xlim( allow_None=False, constant=False, default=(nan, nan), instantiate=False, length=2, pickle_default_value=True, precedence=None, readonly=False, watchers={} ) - User-specified x-axis range limits for the plot, as a tuple (low,high). If specified, takes precedence over data and dimension ranges.
-
param NumericTuple
ylim( allow_None=False, constant=False, default=(nan, nan), instantiate=False, length=2, pickle_default_value=True, precedence=None, readonly=False, watchers={} ) - User-specified x-axis range limits for the plot, as a tuple (low,high). If specified, takes precedence over data and dimension ranges.
-
param NumericTuple
zlim( allow_None=False, constant=False, default=(nan, nan), instantiate=False, length=2, pickle_default_value=True, precedence=None, readonly=False, watchers={} ) - User-specified z-axis range limits for the plot, as a tuple (low,high). If specified, takes precedence over data and dimension ranges.
-
param Integer
xrotation( allow_None=True, bounds=(0, 360), constant=False, default=None, inclusive_bounds=(True, True), instantiate=False, pickle_default_value=True, precedence=None, readonly=False, softbounds=None, time_dependent=False, time_fn=<Time Time00001>, watchers={} ) - Rotation angle of the xticks.
-
param Integer
yrotation( allow_None=True, bounds=(0, 360), constant=False, default=None, inclusive_bounds=(True, True), instantiate=False, pickle_default_value=True, precedence=None, readonly=False, softbounds=None, time_dependent=False, time_fn=<Time Time00001>, watchers={} ) - Rotation angle of the yticks.
-
param Parameter
xticks( allow_None=True, constant=False, default=None, instantiate=False, pickle_default_value=True, precedence=None, readonly=False, watchers={} ) - Ticks along x-axis specified as an integer, explicit list of tick locations, or bokeh Ticker object. If set to None default bokeh ticking behavior is applied.
-
param Parameter
yticks( allow_None=True, constant=False, default=None, instantiate=False, pickle_default_value=True, precedence=None, readonly=False, watchers={} ) - Ticks along y-axis specified as an integer, explicit list of tick locations, or bokeh Ticker object. If set to None default bokeh ticking behavior is applied.
-
param Boolean
apply_ticks( allow_None=False, bounds=(0, 1), constant=False, default=True, instantiate=False, pickle_default_value=True, precedence=None, readonly=False, watchers={} ) - Whether to apply custom ticks.
-
param Parameter
aspect( allow_None=False, constant=False, default=square, instantiate=False, pickle_default_value=True, precedence=None, readonly=False, watchers={} ) - The aspect ratio mode of the plot. By default, a plot may select its own appropriate aspect ratio but sometimes it may be necessary to force a square aspect ratio (e.g. to display the plot as an element of a grid). The modes ‘auto’ and ‘equal’ correspond to the axis modes of the same name in matplotlib, a numeric value may also be passed.
-
param Boolean
invert_zaxis( allow_None=False, bounds=(0, 1), constant=False, default=False, instantiate=False, pickle_default_value=True, precedence=None, readonly=False, watchers={} ) - Whether to invert the plot z-axis.
-
param List
labelled( allow_None=False, bounds=(0, None), constant=False, default=[‘x’, ‘y’], instantiate=True, pickle_default_value=True, precedence=None, readonly=False, watchers={} ) - Whether to plot the ‘x’ and ‘y’ labels.
-
param Boolean
logz( allow_None=False, bounds=(0, 1), constant=False, default=False, instantiate=False, pickle_default_value=True, precedence=None, readonly=False, watchers={} ) - Whether to apply log scaling to the y-axis of the Chart.
-
param ClassSelector
xformatter( allow_None=True, constant=False, default=None, instantiate=True, is_instance=True, pickle_default_value=True, precedence=None, readonly=False, watchers={} ) - Formatter for ticks along the x-axis.
-
param ClassSelector
yformatter( allow_None=True, constant=False, default=None, instantiate=True, is_instance=True, pickle_default_value=True, precedence=None, readonly=False, watchers={} ) - Formatter for ticks along the y-axis.
-
param ClassSelector
zformatter( allow_None=True, constant=False, default=None, instantiate=True, is_instance=True, pickle_default_value=True, precedence=None, readonly=False, watchers={} ) - Formatter for ticks along the z-axis.
-
param Boolean
zaxis( allow_None=False, bounds=(0, 1), constant=False, default=True, instantiate=False, pickle_default_value=True, precedence=None, readonly=False, watchers={} ) - Whether to display the z-axis.
-
param String
zlabel( allow_None=True, basestring=<class ‘str’>, constant=False, default=None, instantiate=False, pickle_default_value=True, precedence=None, readonly=False, regex=None, watchers={} ) - An explicit override of the z-axis label, if set takes precedence over the dimension label.
-
param Integer
zrotation( allow_None=False, bounds=(0, 360), constant=False, default=0, inclusive_bounds=(True, True), instantiate=False, pickle_default_value=True, precedence=None, readonly=False, softbounds=None, time_dependent=False, time_fn=<Time Time00001>, watchers={} ) - Rotation angle of the zticks.
-
param Parameter
zticks( allow_None=True, constant=False, default=None, instantiate=False, pickle_default_value=True, precedence=None, readonly=False, watchers={} ) - Ticks along z-axis specified as an integer, explicit list of tick locations, list of tuples containing the locations and labels or a matplotlib tick locator object. If set to None default matplotlib ticking behavior is applied.
-
anim( start=0 , stop=None , fps=30 ) ¶ -
Method to return a matplotlib animation. The start and stop frames may be specified as well as the fps.
-
cleanup( ) ¶ -
Cleans up references to the plot on the attached Stream subscribers.
-
compute_ranges( obj , key , ranges ) ¶ -
Given an object, a specific key, and the normalization options, this method will find the specified normalization options on the appropriate OptionTree, group the elements according to the selected normalization option (i.e. either per frame or over the whole animation) and finally compute the dimension ranges in each group. The new set of ranges is returned.
-
debug( *args , **kwargs ) ¶ -
Inspect .param.debug method for the full docstring
-
defaults( *args , **kwargs ) ¶ -
Inspect .param.defaults method for the full docstring
-
force_new_dynamic_value= functools.partial(<function Parameters.deprecate.<locals>.inner>, <class 'holoviews.plotting.mpl.annotation.ArrowPlot'>) 
-
get_aspect( xspan , yspan ) ¶ -
Computes the aspect ratio of the plot
-
get_extents( element , ranges , range_type='combined' , xdim=None , ydim=None , zdim=None ) ¶ -
Gets the extents for the axes from the current Element. The globally computed ranges can optionally override the extents.
The extents are computed by combining the data ranges, extents and dimension ranges. Each of these can be obtained individually by setting the range_type to one of:
- ‘data’: Just the data ranges
- ‘extents’: Element.extents
- ‘soft’: Dimension.soft_range values
- ‘hard’: Dimension.range values
To obtain the combined range, which includes range padding the default may be used:
- ‘combined’: All the range types combined and padding applied
This allows Overlay plots to obtain each range and combine them appropriately for all the objects in the overlay.
-
get_padding( extents ) ¶ -
Computes padding along the axes taking into account the plot aspect.
-
get_param_values= functools.partial(<function Parameters.deprecate.<locals>.inner>, <class 'holoviews.plotting.mpl.annotation.ArrowPlot'>) 
-
get_value_generator= functools.partial(<function Parameters.deprecate.<locals>.inner>, <class 'holoviews.plotting.mpl.annotation.ArrowPlot'>) 
-
get_zorder( overlay , key , el ) ¶ -
Computes the z-order of element in the NdOverlay taking into account possible batching of elements.
-
init_artists( ax , plot_args , plot_kwargs ) ¶ -
Initializes the artist based on the plot method declared on the plot.
-
init_comm( ) ¶ -
Initializes comm and attaches streams.
-
inspect_value= functools.partial(<function Parameters.deprecate.<locals>.inner>, <class 'holoviews.plotting.mpl.annotation.ArrowPlot'>) 
-
matches( spec ) ¶ -
Matches a specification against the current Plot.
-
message( *args , **kwargs ) ¶ -
Inspect .param.message method for the full docstring
-
params( *args , **kwargs ) ¶ -
Inspect .param.params method for the full docstring
-
pprint( imports=None , prefix=' ' , unknown_value='<?>' , qualify=False , separator='' ) ¶ -
(Experimental) Pretty printed representation that may be evaluated with eval. See pprint() function for more details.
-
print_param_defaults( *args , **kwargs ) ¶ -
Inspect .param.print_param_defaults method for the full docstring
-
print_param_values( *args , **kwargs ) ¶ -
Inspect .param.print_param_values method for the full docstring
-
push( ) ¶ -
Pushes updated plot data via the Comm.
-
refresh( **kwargs ) ¶ -
Refreshes the plot by rerendering it and then pushing the updated data if the plot has an associated Comm.
-
script_repr( imports=[] , prefix=' ' ) ¶ -
Variant of __repr__ designed for generating a runnable script.
-
set_default( *args , **kwargs ) ¶ -
Inspect .param.set_default method for the full docstring
-
set_dynamic_time_fn= functools.partial(<function Parameters.deprecate.<locals>.inner>, <class 'holoviews.plotting.mpl.annotation.ArrowPlot'>) 
-
set_param= functools.partial(<function Parameters.deprecate.<locals>.inner>, <class 'holoviews.plotting.mpl.annotation.ArrowPlot'>) 
-
state_pop( ) ¶ -
Restore the most recently saved state.
See state_push() for more details.
-
state_push( ) ¶ -
Save this instance’s state.
For Parameterized instances, this includes the state of dynamically generated values.
Subclasses that maintain short-term state should additionally save and restore that state using state_push() and state_pop().
Generally, this method is used by operations that need to test something without permanently altering the objects’ state.
-
teardown_handles( ) ¶ -
If no custom update_handles method is supplied this method is called to tear down any previous handles before replacing them.
-
traverse( fn=None , specs=None , full_breadth=True ) ¶ -
Traverses any nested DimensionedPlot returning a list of all plots that match the specs. The specs should be supplied as a list of either Plot types or callables, which should return a boolean given the plot class.
-
verbose( *args , **kwargs ) ¶ -
Inspect .param.verbose method for the full docstring
-
warning( *args , **kwargs ) ¶ -
Inspect .param.warning method for the full docstring
-
param Parameter
-
class
holoviews.plotting.mpl.annotation.HLinePlot( annotation , **params ) [source] ¶ -
Bases:
holoviews.plotting.mpl.annotation.AnnotationPlotDraw a horizontal line on the axis
-
param Parameter
fontsize( allow_None=True, constant=False, default=None, instantiate=False, pickle_default_value=True, precedence=None, readonly=False, watchers={} ) - Specifies various font sizes of the displayed text. Finer control is available by supplying a dictionary where any unmentioned keys revert to the default sizes, e.g: {‘ticks’:20, ‘title’:15, ‘ylabel’:5, ‘xlabel’:5, ‘zlabel’:5, ‘legend’:8, ‘legend_title’:13} You can set the font size of ‘zlabel’, ‘ylabel’ and ‘xlabel’ together using the ‘labels’ key.
-
param Boolean
show_title( allow_None=False, bounds=(0, 1), constant=False, default=True, instantiate=False, pickle_default_value=True, precedence=None, readonly=False, watchers={} ) - Whether to display the plot title.
-
param String
title( allow_None=False, basestring=<class ‘str’>, constant=False, default={label} {group} {dimensions}, instantiate=False, pickle_default_value=True, precedence=None, readonly=False, regex=None, watchers={} ) - The formatting string for the title of this plot, allows defining a label group separator and dimension labels.
-
param String
title_format( allow_None=True, basestring=<class ‘str’>, constant=False, default=None, instantiate=False, pickle_default_value=True, precedence=None, readonly=False, regex=None, watchers={} ) - Alias for title.
-
param Boolean
normalize( allow_None=False, bounds=(0, 1), constant=False, default=True, instantiate=False, pickle_default_value=True, precedence=None, readonly=False, watchers={} ) - Whether to compute ranges across all Elements at this level of plotting. Allows selecting normalization at different levels for nested data containers.
-
param Parameter
projection( allow_None=True, constant=False, default=None, instantiate=False, pickle_default_value=True, precedence=None, readonly=False, watchers={} ) - The projection of the plot axis, default of None is equivalent to 2D plot, ‘3d’ and ‘polar’ are also supported by matplotlib by default. May also supply a custom projection that is either a matplotlib projection type or implements the _as_mpl_axes method.
-
param Number
fig_alpha( allow_None=False, bounds=(0, 1), constant=False, default=1.0, inclusive_bounds=(True, True), instantiate=False, pickle_default_value=True, precedence=None, readonly=False, softbounds=None, time_dependent=False, time_fn=<Time Time00001>, watchers={} ) - Alpha of the overall figure background.
-
param NumericTuple
fig_bounds( allow_None=False, constant=False, default=(0.15, 0.15, 0.85, 0.85), instantiate=False, length=4, pickle_default_value=True, precedence=None, readonly=False, watchers={} ) - The bounds of the overall figure as a 4-tuple of the form (left, bottom, right, top), defining the size of the border around the subplots.
-
param Parameter
fig_inches( allow_None=False, constant=False, default=4, instantiate=False, pickle_default_value=True, precedence=None, readonly=False, watchers={} ) - The overall matplotlib figure size in inches. May be set as an integer in which case it will be used to autocompute a size. Alternatively may be set with an explicit tuple or list, in which case it will be applied directly after being scaled by fig_size. If either the width or height is set to None, it will be computed automatically.
-
param Boolean
fig_latex( allow_None=False, bounds=(0, 1), constant=False, default=False, instantiate=False, pickle_default_value=True, precedence=None, readonly=False, watchers={} ) - Whether to use LaTeX text in the overall figure.
-
param Dict
fig_rcparams( allow_None=False, constant=False, default={}, instantiate=True, is_instance=True, pickle_default_value=True, precedence=None, readonly=False, watchers={} ) - matplotlib rc parameters to apply to the overall figure.
-
param Number
fig_size( allow_None=False, bounds=(1, None), constant=False, default=100.0, inclusive_bounds=(True, True), instantiate=False, pickle_default_value=True, precedence=None, readonly=False, softbounds=None, time_dependent=False, time_fn=<Time Time00001>, watchers={} ) - Size relative to the supplied overall fig_inches in percent.
-
param HookList
initial_hooks( allow_None=False, bounds=(0, None), constant=False, default=[], instantiate=True, pickle_default_value=True, precedence=None, readonly=False, watchers={} ) - Optional list of hooks called before plotting the data onto the axis (now marked for deprecation). The hook is passed the plot object and the displayed object; other plotting handles can be accessed via plot.handles.
-
param HookList
finalize_hooks( allow_None=False, bounds=(0, None), constant=False, default=[], instantiate=True, pickle_default_value=True, precedence=None, readonly=False, watchers={} ) - Deprecated; use hooks options instead.
-
param HookList
hooks( allow_None=False, bounds=(0, None), constant=False, default=[], instantiate=True, pickle_default_value=True, precedence=None, readonly=False, watchers={} ) - Optional list of hooks called when finalizing a plot. The hook is passed the plot object and the displayed element, and other plotting handles can be accessed via plot.handles.
-
param String
sublabel_format( allow_None=True, basestring=<class ‘str’>, constant=False, default=None, instantiate=False, pickle_default_value=True, precedence=None, readonly=False, regex=None, watchers={} ) - Allows labeling the subaxes in each plot with various formatters including {Alpha}, {alpha}, {numeric} and {roman}.
-
param NumericTuple
sublabel_position( allow_None=False, constant=False, default=(-0.35, 0.85), instantiate=False, length=2, pickle_default_value=True, precedence=None, readonly=False, watchers={} ) - Position relative to the plot for placing the optional subfigure label.
-
param Number
sublabel_size( allow_None=False, bounds=None, constant=False, default=18, inclusive_bounds=(True, True), instantiate=False, pickle_default_value=True, precedence=None, readonly=False, softbounds=None, time_dependent=False, time_fn=<Time Time00001>, watchers={} ) - Size of optional subfigure label.
-
param Boolean
show_frame( allow_None=False, bounds=(0, 1), constant=False, default=False, instantiate=False, pickle_default_value=True, precedence=None, readonly=False, watchers={} ) - Whether or not to show a complete frame around the plot.
-
param Boolean
apply_ranges( allow_None=False, bounds=(0, 1), constant=False, default=True, instantiate=False, pickle_default_value=True, precedence=None, readonly=False, watchers={} ) - Whether to compute the plot bounds from the data itself.
-
param Boolean
apply_extents( allow_None=False, bounds=(0, 1), constant=False, default=True, instantiate=False, pickle_default_value=True, precedence=None, readonly=False, watchers={} ) - Whether to apply extent overrides on the Elements
-
param ClassSelector
bgcolor( allow_None=True, constant=False, default=None, instantiate=True, is_instance=True, pickle_default_value=True, precedence=None, readonly=False, watchers={} ) - If set bgcolor overrides the background color of the axis.
-
param ClassSelector
default_span( allow_None=False, constant=False, default=2.0, instantiate=True, is_instance=True, pickle_default_value=True, precedence=None, readonly=False, watchers={} ) - Defines the span of an axis if the axis range is zero, i.e. if the lower and upper end of an axis are equal or no range is defined at all. For example if there is a single datapoint at 0 a default_span of 2.0 will result in axis ranges spanning from -1 to 1.
-
param Boolean
invert_axes( allow_None=False, bounds=(0, 1), constant=False, default=False, instantiate=False, pickle_default_value=True, precedence=None, readonly=False, watchers={} ) - Whether to invert the x- and y-axis
-
param Boolean
invert_xaxis( allow_None=False, bounds=(0, 1), constant=False, default=False, instantiate=False, pickle_default_value=True, precedence=None, readonly=False, watchers={} ) - Whether to invert the plot x-axis.
-
param Boolean
invert_yaxis( allow_None=False, bounds=(0, 1), constant=False, default=False, instantiate=False, pickle_default_value=True, precedence=None, readonly=False, watchers={} ) - Whether to invert the plot y-axis.
-
param Boolean
logx( allow_None=False, bounds=(0, 1), constant=False, default=False, instantiate=False, pickle_default_value=True, precedence=None, readonly=False, watchers={} ) - Whether the x-axis of the plot will be a log axis.
-
param Boolean
logy( allow_None=False, bounds=(0, 1), constant=False, default=False, instantiate=False, pickle_default_value=True, precedence=None, readonly=False, watchers={} ) - Whether the y-axis of the plot will be a log axis.
-
param ClassSelector
padding( allow_None=False, constant=False, default=0, instantiate=True, is_instance=True, pickle_default_value=True, precedence=None, readonly=False, watchers={} ) - Fraction by which to increase auto-ranged extents to make datapoints more visible around borders. To compute padding, the axis whose screen size is largest is chosen, and the range of that axis is increased by the specified fraction along each axis. Other axes are then padded ensuring that the amount of screen space devoted to padding is equal for all axes. If specified as a tuple, the int or float values in the tuple will be used for padding in each axis, in order (x,y or x,y,z). For example, for padding=0.2 on a 800x800-pixel plot, an x-axis with the range [0,10] will be padded by 20% to be [-1,11], while a y-axis with a range [0,1000] will be padded to be [-100,1100], which should make the padding be approximately the same number of pixels. But if the same plot is changed to have a height of only 200, the y-range will then be [-400,1400] so that the y-axis padding will still match that of the x-axis. It is also possible to declare non-equal padding value for the lower and upper bound of an axis by supplying nested tuples, e.g. padding=(0.1, (0, 0.1)) will pad the x-axis lower and upper bound as well as the y-axis upper bound by a fraction of 0.1 while the y-axis lower bound is not padded at all.
-
param Boolean
show_legend( allow_None=False, bounds=(0, 1), constant=False, default=False, instantiate=False, pickle_default_value=True, precedence=None, readonly=False, watchers={} ) - Whether to show legend for the plot.
-
param Boolean
show_grid( allow_None=False, bounds=(0, 1), constant=False, default=False, instantiate=False, pickle_default_value=True, precedence=None, readonly=False, watchers={} ) - Whether to show a Cartesian grid on the plot.
-
param ObjectSelector
xaxis( allow_None=None, check_on_set=True, compute_default_fn=None, constant=False, default=bottom, instantiate=False, names=None, objects=[‘top’, ‘bottom’, ‘bare’, ‘top-bare’, ‘bottom-bare’, None, True, False], pickle_default_value=True, precedence=None, readonly=False, watchers={} ) - Whether and where to display the xaxis. The “bare” options allow suppressing all axis labels, including ticks and xlabel. Valid options are ‘top’, ‘bottom’, ‘bare’, ‘top-bare’ and ‘bottom-bare’.
-
param ObjectSelector
yaxis( allow_None=None, check_on_set=True, compute_default_fn=None, constant=False, default=left, instantiate=False, names=None, objects=[‘left’, ‘right’, ‘bare’, ‘left-bare’, ‘right-bare’, None, True, False], pickle_default_value=True, precedence=None, readonly=False, watchers={} ) - Whether and where to display the yaxis. The “bare” options allow suppressing all axis labels, including ticks and ylabel. Valid options are ‘left’, ‘right’, ‘bare’, ‘left-bare’ and ‘right-bare’.
-
param String
xlabel( allow_None=True, basestring=<class ‘str’>, constant=False, default=None, instantiate=False, pickle_default_value=True, precedence=None, readonly=False, regex=None, watchers={} ) - An explicit override of the x-axis label, if set takes precedence over the dimension label.
-
param String
ylabel( allow_None=True, basestring=<class ‘str’>, constant=False, default=None, instantiate=False, pickle_default_value=True, precedence=None, readonly=False, regex=None, watchers={} ) - An explicit override of the y-axis label, if set takes precedence over the dimension label.
-
param NumericTuple
xlim( allow_None=False, constant=False, default=(nan, nan), instantiate=False, length=2, pickle_default_value=True, precedence=None, readonly=False, watchers={} ) - User-specified x-axis range limits for the plot, as a tuple (low,high). If specified, takes precedence over data and dimension ranges.
-
param NumericTuple
ylim( allow_None=False, constant=False, default=(nan, nan), instantiate=False, length=2, pickle_default_value=True, precedence=None, readonly=False, watchers={} ) - User-specified x-axis range limits for the plot, as a tuple (low,high). If specified, takes precedence over data and dimension ranges.
-
param NumericTuple
zlim( allow_None=False, constant=False, default=(nan, nan), instantiate=False, length=2, pickle_default_value=True, precedence=None, readonly=False, watchers={} ) - User-specified z-axis range limits for the plot, as a tuple (low,high). If specified, takes precedence over data and dimension ranges.
-
param Integer
xrotation( allow_None=True, bounds=(0, 360), constant=False, default=None, inclusive_bounds=(True, True), instantiate=False, pickle_default_value=True, precedence=None, readonly=False, softbounds=None, time_dependent=False, time_fn=<Time Time00001>, watchers={} ) - Rotation angle of the xticks.
-
param Integer
yrotation( allow_None=True, bounds=(0, 360), constant=False, default=None, inclusive_bounds=(True, True), instantiate=False, pickle_default_value=True, precedence=None, readonly=False, softbounds=None, time_dependent=False, time_fn=<Time Time00001>, watchers={} ) - Rotation angle of the yticks.
-
param Parameter
xticks( allow_None=True, constant=False, default=None, instantiate=False, pickle_default_value=True, precedence=None, readonly=False, watchers={} ) - Ticks along x-axis specified as an integer, explicit list of tick locations, or bokeh Ticker object. If set to None default bokeh ticking behavior is applied.
-
param Parameter
yticks( allow_None=True, constant=False, default=None, instantiate=False, pickle_default_value=True, precedence=None, readonly=False, watchers={} ) - Ticks along y-axis specified as an integer, explicit list of tick locations, or bokeh Ticker object. If set to None default bokeh ticking behavior is applied.
-
param Boolean
apply_ticks( allow_None=False, bounds=(0, 1), constant=False, default=True, instantiate=False, pickle_default_value=True, precedence=None, readonly=False, watchers={} ) - Whether to apply custom ticks.
-
param Parameter
aspect( allow_None=False, constant=False, default=square, instantiate=False, pickle_default_value=True, precedence=None, readonly=False, watchers={} ) - The aspect ratio mode of the plot. By default, a plot may select its own appropriate aspect ratio but sometimes it may be necessary to force a square aspect ratio (e.g. to display the plot as an element of a grid). The modes ‘auto’ and ‘equal’ correspond to the axis modes of the same name in matplotlib, a numeric value may also be passed.
-
param Boolean
invert_zaxis( allow_None=False, bounds=(0, 1), constant=False, default=False, instantiate=False, pickle_default_value=True, precedence=None, readonly=False, watchers={} ) - Whether to invert the plot z-axis.
-
param List
labelled( allow_None=False, bounds=(0, None), constant=False, default=[‘x’, ‘y’], instantiate=True, pickle_default_value=True, precedence=None, readonly=False, watchers={} ) - Whether to plot the ‘x’ and ‘y’ labels.
-
param Boolean
logz( allow_None=False, bounds=(0, 1), constant=False, default=False, instantiate=False, pickle_default_value=True, precedence=None, readonly=False, watchers={} ) - Whether to apply log scaling to the y-axis of the Chart.
-
param ClassSelector
xformatter( allow_None=True, constant=False, default=None, instantiate=True, is_instance=True, pickle_default_value=True, precedence=None, readonly=False, watchers={} ) - Formatter for ticks along the x-axis.
-
param ClassSelector
yformatter( allow_None=True, constant=False, default=None, instantiate=True, is_instance=True, pickle_default_value=True, precedence=None, readonly=False, watchers={} ) - Formatter for ticks along the y-axis.
-
param ClassSelector
zformatter( allow_None=True, constant=False, default=None, instantiate=True, is_instance=True, pickle_default_value=True, precedence=None, readonly=False, watchers={} ) - Formatter for ticks along the z-axis.
-
param Boolean
zaxis( allow_None=False, bounds=(0, 1), constant=False, default=True, instantiate=False, pickle_default_value=True, precedence=None, readonly=False, watchers={} ) - Whether to display the z-axis.
-
param String
zlabel( allow_None=True, basestring=<class ‘str’>, constant=False, default=None, instantiate=False, pickle_default_value=True, precedence=None, readonly=False, regex=None, watchers={} ) - An explicit override of the z-axis label, if set takes precedence over the dimension label.
-
param Integer
zrotation( allow_None=False, bounds=(0, 360), constant=False, default=0, inclusive_bounds=(True, True), instantiate=False, pickle_default_value=True, precedence=None, readonly=False, softbounds=None, time_dependent=False, time_fn=<Time Time00001>, watchers={} ) - Rotation angle of the zticks.
-
param Parameter
zticks( allow_None=True, constant=False, default=None, instantiate=False, pickle_default_value=True, precedence=None, readonly=False, watchers={} ) - Ticks along z-axis specified as an integer, explicit list of tick locations, list of tuples containing the locations and labels or a matplotlib tick locator object. If set to None default matplotlib ticking behavior is applied.
-
anim( start=0 , stop=None , fps=30 ) ¶ -
Method to return a matplotlib animation. The start and stop frames may be specified as well as the fps.
-
cleanup( ) ¶ -
Cleans up references to the plot on the attached Stream subscribers.
-
compute_ranges( obj , key , ranges ) ¶ -
Given an object, a specific key, and the normalization options, this method will find the specified normalization options on the appropriate OptionTree, group the elements according to the selected normalization option (i.e. either per frame or over the whole animation) and finally compute the dimension ranges in each group. The new set of ranges is returned.
-
debug( *args , **kwargs ) ¶ -
Inspect .param.debug method for the full docstring
-
defaults( *args , **kwargs ) ¶ -
Inspect .param.defaults method for the full docstring
-
force_new_dynamic_value= functools.partial(<function Parameters.deprecate.<locals>.inner>, <class 'holoviews.plotting.mpl.annotation.HLinePlot'>) 
-
get_aspect( xspan , yspan ) ¶ -
Computes the aspect ratio of the plot
-
get_extents( element , ranges , range_type='combined' , xdim=None , ydim=None , zdim=None ) ¶ -
Gets the extents for the axes from the current Element. The globally computed ranges can optionally override the extents.
The extents are computed by combining the data ranges, extents and dimension ranges. Each of these can be obtained individually by setting the range_type to one of:
- ‘data’: Just the data ranges
- ‘extents’: Element.extents
- ‘soft’: Dimension.soft_range values
- ‘hard’: Dimension.range values
To obtain the combined range, which includes range padding the default may be used:
- ‘combined’: All the range types combined and padding applied
This allows Overlay plots to obtain each range and combine them appropriately for all the objects in the overlay.
-
get_padding( extents ) ¶ -
Computes padding along the axes taking into account the plot aspect.
-
get_param_values= functools.partial(<function Parameters.deprecate.<locals>.inner>, <class 'holoviews.plotting.mpl.annotation.HLinePlot'>) 
-
get_value_generator= functools.partial(<function Parameters.deprecate.<locals>.inner>, <class 'holoviews.plotting.mpl.annotation.HLinePlot'>) 
-
get_zorder( overlay , key , el ) ¶ -
Computes the z-order of element in the NdOverlay taking into account possible batching of elements.
-
init_artists( ax , plot_args , plot_kwargs ) ¶ -
Initializes the artist based on the plot method declared on the plot.
-
init_comm( ) ¶ -
Initializes comm and attaches streams.
-
inspect_value= functools.partial(<function Parameters.deprecate.<locals>.inner>, <class 'holoviews.plotting.mpl.annotation.HLinePlot'>) 
-
matches( spec ) ¶ -
Matches a specification against the current Plot.
-
message( *args , **kwargs ) ¶ -
Inspect .param.message method for the full docstring
-
params( *args , **kwargs ) ¶ -
Inspect .param.params method for the full docstring
-
pprint( imports=None , prefix=' ' , unknown_value='<?>' , qualify=False , separator='' ) ¶ -
(Experimental) Pretty printed representation that may be evaluated with eval. See pprint() function for more details.
-
print_param_defaults( *args , **kwargs ) ¶ -
Inspect .param.print_param_defaults method for the full docstring
-
print_param_values( *args , **kwargs ) ¶ -
Inspect .param.print_param_values method for the full docstring
-
push( ) ¶ -
Pushes updated plot data via the Comm.
-
refresh( **kwargs ) ¶ -
Refreshes the plot by rerendering it and then pushing the updated data if the plot has an associated Comm.
-
script_repr( imports=[] , prefix=' ' ) ¶ -
Variant of __repr__ designed for generating a runnable script.
-
set_default( *args , **kwargs ) ¶ -
Inspect .param.set_default method for the full docstring
-
set_dynamic_time_fn= functools.partial(<function Parameters.deprecate.<locals>.inner>, <class 'holoviews.plotting.mpl.annotation.HLinePlot'>) 
-
set_param= functools.partial(<function Parameters.deprecate.<locals>.inner>, <class 'holoviews.plotting.mpl.annotation.HLinePlot'>) 
-
state_pop( ) ¶ -
Restore the most recently saved state.
See state_push() for more details.
-
state_push( ) ¶ -
Save this instance’s state.
For Parameterized instances, this includes the state of dynamically generated values.
Subclasses that maintain short-term state should additionally save and restore that state using state_push() and state_pop().
Generally, this method is used by operations that need to test something without permanently altering the objects’ state.
-
teardown_handles( ) ¶ -
If no custom update_handles method is supplied this method is called to tear down any previous handles before replacing them.
-
traverse( fn=None , specs=None , full_breadth=True ) ¶ -
Traverses any nested DimensionedPlot returning a list of all plots that match the specs. The specs should be supplied as a list of either Plot types or callables, which should return a boolean given the plot class.
-
verbose( *args , **kwargs ) ¶ -
Inspect .param.verbose method for the full docstring
-
warning( *args , **kwargs ) ¶ -
Inspect .param.warning method for the full docstring
-
param Parameter
-
class
holoviews.plotting.mpl.annotation.SplinePlot( annotation , **params ) [source] ¶ -
Bases:
holoviews.plotting.mpl.annotation.AnnotationPlotDraw the supplied Spline annotation (see Spline docstring)
-
param Parameter
fontsize( allow_None=True, constant=False, default=None, instantiate=False, pickle_default_value=True, precedence=None, readonly=False, watchers={} ) - Specifies various font sizes of the displayed text. Finer control is available by supplying a dictionary where any unmentioned keys revert to the default sizes, e.g: {‘ticks’:20, ‘title’:15, ‘ylabel’:5, ‘xlabel’:5, ‘zlabel’:5, ‘legend’:8, ‘legend_title’:13} You can set the font size of ‘zlabel’, ‘ylabel’ and ‘xlabel’ together using the ‘labels’ key.
-
param Boolean
show_title( allow_None=False, bounds=(0, 1), constant=False, default=True, instantiate=False, pickle_default_value=True, precedence=None, readonly=False, watchers={} ) - Whether to display the plot title.
-
param String
title( allow_None=False, basestring=<class ‘str’>, constant=False, default={label} {group} {dimensions}, instantiate=False, pickle_default_value=True, precedence=None, readonly=False, regex=None, watchers={} ) - The formatting string for the title of this plot, allows defining a label group separator and dimension labels.
-
param String
title_format( allow_None=True, basestring=<class ‘str’>, constant=False, default=None, instantiate=False, pickle_default_value=True, precedence=None, readonly=False, regex=None, watchers={} ) - Alias for title.
-
param Boolean
normalize( allow_None=False, bounds=(0, 1), constant=False, default=True, instantiate=False, pickle_default_value=True, precedence=None, readonly=False, watchers={} ) - Whether to compute ranges across all Elements at this level of plotting. Allows selecting normalization at different levels for nested data containers.
-
param Parameter
projection( allow_None=True, constant=False, default=None, instantiate=False, pickle_default_value=True, precedence=None, readonly=False, watchers={} ) - The projection of the plot axis, default of None is equivalent to 2D plot, ‘3d’ and ‘polar’ are also supported by matplotlib by default. May also supply a custom projection that is either a matplotlib projection type or implements the _as_mpl_axes method.
-
param Number
fig_alpha( allow_None=False, bounds=(0, 1), constant=False, default=1.0, inclusive_bounds=(True, True), instantiate=False, pickle_default_value=True, precedence=None, readonly=False, softbounds=None, time_dependent=False, time_fn=<Time Time00001>, watchers={} ) - Alpha of the overall figure background.
-
param NumericTuple
fig_bounds( allow_None=False, constant=False, default=(0.15, 0.15, 0.85, 0.85), instantiate=False, length=4, pickle_default_value=True, precedence=None, readonly=False, watchers={} ) - The bounds of the overall figure as a 4-tuple of the form (left, bottom, right, top), defining the size of the border around the subplots.
-
param Parameter
fig_inches( allow_None=False, constant=False, default=4, instantiate=False, pickle_default_value=True, precedence=None, readonly=False, watchers={} ) - The overall matplotlib figure size in inches. May be set as an integer in which case it will be used to autocompute a size. Alternatively may be set with an explicit tuple or list, in which case it will be applied directly after being scaled by fig_size. If either the width or height is set to None, it will be computed automatically.
-
param Boolean
fig_latex( allow_None=False, bounds=(0, 1), constant=False, default=False, instantiate=False, pickle_default_value=True, precedence=None, readonly=False, watchers={} ) - Whether to use LaTeX text in the overall figure.
-
param Dict
fig_rcparams( allow_None=False, constant=False, default={}, instantiate=True, is_instance=True, pickle_default_value=True, precedence=None, readonly=False, watchers={} ) - matplotlib rc parameters to apply to the overall figure.
-
param Number
fig_size( allow_None=False, bounds=(1, None), constant=False, default=100.0, inclusive_bounds=(True, True), instantiate=False, pickle_default_value=True, precedence=None, readonly=False, softbounds=None, time_dependent=False, time_fn=<Time Time00001>, watchers={} ) - Size relative to the supplied overall fig_inches in percent.
-
param HookList
initial_hooks( allow_None=False, bounds=(0, None), constant=False, default=[], instantiate=True, pickle_default_value=True, precedence=None, readonly=False, watchers={} ) - Optional list of hooks called before plotting the data onto the axis (now marked for deprecation). The hook is passed the plot object and the displayed object; other plotting handles can be accessed via plot.handles.
-
param HookList
finalize_hooks( allow_None=False, bounds=(0, None), constant=False, default=[], instantiate=True, pickle_default_value=True, precedence=None, readonly=False, watchers={} ) - Deprecated; use hooks options instead.
-
param HookList
hooks( allow_None=False, bounds=(0, None), constant=False, default=[], instantiate=True, pickle_default_value=True, precedence=None, readonly=False, watchers={} ) - Optional list of hooks called when finalizing a plot. The hook is passed the plot object and the displayed element, and other plotting handles can be accessed via plot.handles.
-
param String
sublabel_format( allow_None=True, basestring=<class ‘str’>, constant=False, default=None, instantiate=False, pickle_default_value=True, precedence=None, readonly=False, regex=None, watchers={} ) - Allows labeling the subaxes in each plot with various formatters including {Alpha}, {alpha}, {numeric} and {roman}.
-
param NumericTuple
sublabel_position( allow_None=False, constant=False, default=(-0.35, 0.85), instantiate=False, length=2, pickle_default_value=True, precedence=None, readonly=False, watchers={} ) - Position relative to the plot for placing the optional subfigure label.
-
param Number
sublabel_size( allow_None=False, bounds=None, constant=False, default=18, inclusive_bounds=(True, True), instantiate=False, pickle_default_value=True, precedence=None, readonly=False, softbounds=None, time_dependent=False, time_fn=<Time Time00001>, watchers={} ) - Size of optional subfigure label.
-
param Boolean
show_frame( allow_None=False, bounds=(0, 1), constant=False, default=False, instantiate=False, pickle_default_value=True, precedence=None, readonly=False, watchers={} ) - Whether or not to show a complete frame around the plot.
-
param Boolean
apply_ranges( allow_None=False, bounds=(0, 1), constant=False, default=True, instantiate=False, pickle_default_value=True, precedence=None, readonly=False, watchers={} ) - Whether to compute the plot bounds from the data itself.
-
param Boolean
apply_extents( allow_None=False, bounds=(0, 1), constant=False, default=True, instantiate=False, pickle_default_value=True, precedence=None, readonly=False, watchers={} ) - Whether to apply extent overrides on the Elements
-
param ClassSelector
bgcolor( allow_None=True, constant=False, default=None, instantiate=True, is_instance=True, pickle_default_value=True, precedence=None, readonly=False, watchers={} ) - If set bgcolor overrides the background color of the axis.
-
param ClassSelector
default_span( allow_None=False, constant=False, default=2.0, instantiate=True, is_instance=True, pickle_default_value=True, precedence=None, readonly=False, watchers={} ) - Defines the span of an axis if the axis range is zero, i.e. if the lower and upper end of an axis are equal or no range is defined at all. For example if there is a single datapoint at 0 a default_span of 2.0 will result in axis ranges spanning from -1 to 1.
-
param Boolean
invert_axes( allow_None=False, bounds=(0, 1), constant=False, default=False, instantiate=False, pickle_default_value=True, precedence=None, readonly=False, watchers={} ) - Whether to invert the x- and y-axis
-
param Boolean
invert_xaxis( allow_None=False, bounds=(0, 1), constant=False, default=False, instantiate=False, pickle_default_value=True, precedence=None, readonly=False, watchers={} ) - Whether to invert the plot x-axis.
-
param Boolean
invert_yaxis( allow_None=False, bounds=(0, 1), constant=False, default=False, instantiate=False, pickle_default_value=True, precedence=None, readonly=False, watchers={} ) - Whether to invert the plot y-axis.
-
param Boolean
logx( allow_None=False, bounds=(0, 1), constant=False, default=False, instantiate=False, pickle_default_value=True, precedence=None, readonly=False, watchers={} ) - Whether the x-axis of the plot will be a log axis.
-
param Boolean
logy( allow_None=False, bounds=(0, 1), constant=False, default=False, instantiate=False, pickle_default_value=True, precedence=None, readonly=False, watchers={} ) - Whether the y-axis of the plot will be a log axis.
-
param ClassSelector
padding( allow_None=False, constant=False, default=0, instantiate=True, is_instance=True, pickle_default_value=True, precedence=None, readonly=False, watchers={} ) - Fraction by which to increase auto-ranged extents to make datapoints more visible around borders. To compute padding, the axis whose screen size is largest is chosen, and the range of that axis is increased by the specified fraction along each axis. Other axes are then padded ensuring that the amount of screen space devoted to padding is equal for all axes. If specified as a tuple, the int or float values in the tuple will be used for padding in each axis, in order (x,y or x,y,z). For example, for padding=0.2 on a 800x800-pixel plot, an x-axis with the range [0,10] will be padded by 20% to be [-1,11], while a y-axis with a range [0,1000] will be padded to be [-100,1100], which should make the padding be approximately the same number of pixels. But if the same plot is changed to have a height of only 200, the y-range will then be [-400,1400] so that the y-axis padding will still match that of the x-axis. It is also possible to declare non-equal padding value for the lower and upper bound of an axis by supplying nested tuples, e.g. padding=(0.1, (0, 0.1)) will pad the x-axis lower and upper bound as well as the y-axis upper bound by a fraction of 0.1 while the y-axis lower bound is not padded at all.
-
param Boolean
show_legend( allow_None=False, bounds=(0, 1), constant=False, default=False, instantiate=False, pickle_default_value=True, precedence=None, readonly=False, watchers={} ) - Whether to show legend for the plot.
-
param Boolean
show_grid( allow_None=False, bounds=(0, 1), constant=False, default=False, instantiate=False, pickle_default_value=True, precedence=None, readonly=False, watchers={} ) - Whether to show a Cartesian grid on the plot.
-
param ObjectSelector
xaxis( allow_None=None, check_on_set=True, compute_default_fn=None, constant=False, default=bottom, instantiate=False, names=None, objects=[‘top’, ‘bottom’, ‘bare’, ‘top-bare’, ‘bottom-bare’, None, True, False], pickle_default_value=True, precedence=None, readonly=False, watchers={} ) - Whether and where to display the xaxis. The “bare” options allow suppressing all axis labels, including ticks and xlabel. Valid options are ‘top’, ‘bottom’, ‘bare’, ‘top-bare’ and ‘bottom-bare’.
-
param ObjectSelector
yaxis( allow_None=None, check_on_set=True, compute_default_fn=None, constant=False, default=left, instantiate=False, names=None, objects=[‘left’, ‘right’, ‘bare’, ‘left-bare’, ‘right-bare’, None, True, False], pickle_default_value=True, precedence=None, readonly=False, watchers={} ) - Whether and where to display the yaxis. The “bare” options allow suppressing all axis labels, including ticks and ylabel. Valid options are ‘left’, ‘right’, ‘bare’, ‘left-bare’ and ‘right-bare’.
-
param String
xlabel( allow_None=True, basestring=<class ‘str’>, constant=False, default=None, instantiate=False, pickle_default_value=True, precedence=None, readonly=False, regex=None, watchers={} ) - An explicit override of the x-axis label, if set takes precedence over the dimension label.
-
param String
ylabel( allow_None=True, basestring=<class ‘str’>, constant=False, default=None, instantiate=False, pickle_default_value=True, precedence=None, readonly=False, regex=None, watchers={} ) - An explicit override of the y-axis label, if set takes precedence over the dimension label.
-
param NumericTuple
xlim( allow_None=False, constant=False, default=(nan, nan), instantiate=False, length=2, pickle_default_value=True, precedence=None, readonly=False, watchers={} ) - User-specified x-axis range limits for the plot, as a tuple (low,high). If specified, takes precedence over data and dimension ranges.
-
param NumericTuple
ylim( allow_None=False, constant=False, default=(nan, nan), instantiate=False, length=2, pickle_default_value=True, precedence=None, readonly=False, watchers={} ) - User-specified x-axis range limits for the plot, as a tuple (low,high). If specified, takes precedence over data and dimension ranges.
-
param NumericTuple
zlim( allow_None=False, constant=False, default=(nan, nan), instantiate=False, length=2, pickle_default_value=True, precedence=None, readonly=False, watchers={} ) - User-specified z-axis range limits for the plot, as a tuple (low,high). If specified, takes precedence over data and dimension ranges.
-
param Integer
xrotation( allow_None=True, bounds=(0, 360), constant=False, default=None, inclusive_bounds=(True, True), instantiate=False, pickle_default_value=True, precedence=None, readonly=False, softbounds=None, time_dependent=False, time_fn=<Time Time00001>, watchers={} ) - Rotation angle of the xticks.
-
param Integer
yrotation( allow_None=True, bounds=(0, 360), constant=False, default=None, inclusive_bounds=(True, True), instantiate=False, pickle_default_value=True, precedence=None, readonly=False, softbounds=None, time_dependent=False, time_fn=<Time Time00001>, watchers={} ) - Rotation angle of the yticks.
-
param Parameter
xticks( allow_None=True, constant=False, default=None, instantiate=False, pickle_default_value=True, precedence=None, readonly=False, watchers={} ) - Ticks along x-axis specified as an integer, explicit list of tick locations, or bokeh Ticker object. If set to None default bokeh ticking behavior is applied.
-
param Parameter
yticks( allow_None=True, constant=False, default=None, instantiate=False, pickle_default_value=True, precedence=None, readonly=False, watchers={} ) - Ticks along y-axis specified as an integer, explicit list of tick locations, or bokeh Ticker object. If set to None default bokeh ticking behavior is applied.
-
param Boolean
apply_ticks( allow_None=False, bounds=(0, 1), constant=False, default=True, instantiate=False, pickle_default_value=True, precedence=None, readonly=False, watchers={} ) - Whether to apply custom ticks.
-
param Parameter
aspect( allow_None=False, constant=False, default=square, instantiate=False, pickle_default_value=True, precedence=None, readonly=False, watchers={} ) - The aspect ratio mode of the plot. By default, a plot may select its own appropriate aspect ratio but sometimes it may be necessary to force a square aspect ratio (e.g. to display the plot as an element of a grid). The modes ‘auto’ and ‘equal’ correspond to the axis modes of the same name in matplotlib, a numeric value may also be passed.
-
param Boolean
invert_zaxis( allow_None=False, bounds=(0, 1), constant=False, default=False, instantiate=False, pickle_default_value=True, precedence=None, readonly=False, watchers={} ) - Whether to invert the plot z-axis.
-
param List
labelled( allow_None=False, bounds=(0, None), constant=False, default=[‘x’, ‘y’], instantiate=True, pickle_default_value=True, precedence=None, readonly=False, watchers={} ) - Whether to plot the ‘x’ and ‘y’ labels.
-
param Boolean
logz( allow_None=False, bounds=(0, 1), constant=False, default=False, instantiate=False, pickle_default_value=True, precedence=None, readonly=False, watchers={} ) - Whether to apply log scaling to the y-axis of the Chart.
-
param ClassSelector
xformatter( allow_None=True, constant=False, default=None, instantiate=True, is_instance=True, pickle_default_value=True, precedence=None, readonly=False, watchers={} ) - Formatter for ticks along the x-axis.
-
param ClassSelector
yformatter( allow_None=True, constant=False, default=None, instantiate=True, is_instance=True, pickle_default_value=True, precedence=None, readonly=False, watchers={} ) - Formatter for ticks along the y-axis.
-
param ClassSelector
zformatter( allow_None=True, constant=False, default=None, instantiate=True, is_instance=True, pickle_default_value=True, precedence=None, readonly=False, watchers={} ) - Formatter for ticks along the z-axis.
-
param Boolean
zaxis( allow_None=False, bounds=(0, 1), constant=False, default=True, instantiate=False, pickle_default_value=True, precedence=None, readonly=False, watchers={} ) - Whether to display the z-axis.
-
param String
zlabel( allow_None=True, basestring=<class ‘str’>, constant=False, default=None, instantiate=False, pickle_default_value=True, precedence=None, readonly=False, regex=None, watchers={} ) - An explicit override of the z-axis label, if set takes precedence over the dimension label.
-
param Integer
zrotation( allow_None=False, bounds=(0, 360), constant=False, default=0, inclusive_bounds=(True, True), instantiate=False, pickle_default_value=True, precedence=None, readonly=False, softbounds=None, time_dependent=False, time_fn=<Time Time00001>, watchers={} ) - Rotation angle of the zticks.
-
param Parameter
zticks( allow_None=True, constant=False, default=None, instantiate=False, pickle_default_value=True, precedence=None, readonly=False, watchers={} ) - Ticks along z-axis specified as an integer, explicit list of tick locations, list of tuples containing the locations and labels or a matplotlib tick locator object. If set to None default matplotlib ticking behavior is applied.
-
anim( start=0 , stop=None , fps=30 ) ¶ -
Method to return a matplotlib animation. The start and stop frames may be specified as well as the fps.
-
cleanup( ) ¶ -
Cleans up references to the plot on the attached Stream subscribers.
-
compute_ranges( obj , key , ranges ) ¶ -
Given an object, a specific key, and the normalization options, this method will find the specified normalization options on the appropriate OptionTree, group the elements according to the selected normalization option (i.e. either per frame or over the whole animation) and finally compute the dimension ranges in each group. The new set of ranges is returned.
-
debug( *args , **kwargs ) ¶ -
Inspect .param.debug method for the full docstring
-
defaults( *args , **kwargs ) ¶ -
Inspect .param.defaults method for the full docstring
-
force_new_dynamic_value= functools.partial(<function Parameters.deprecate.<locals>.inner>, <class 'holoviews.plotting.mpl.annotation.SplinePlot'>) 
-
get_aspect( xspan , yspan ) ¶ -
Computes the aspect ratio of the plot
-
get_extents( element , ranges , range_type='combined' , xdim=None , ydim=None , zdim=None ) ¶ -
Gets the extents for the axes from the current Element. The globally computed ranges can optionally override the extents.
The extents are computed by combining the data ranges, extents and dimension ranges. Each of these can be obtained individually by setting the range_type to one of:
- ‘data’: Just the data ranges
- ‘extents’: Element.extents
- ‘soft’: Dimension.soft_range values
- ‘hard’: Dimension.range values
To obtain the combined range, which includes range padding the default may be used:
- ‘combined’: All the range types combined and padding applied
This allows Overlay plots to obtain each range and combine them appropriately for all the objects in the overlay.
-
get_padding( extents ) ¶ -
Computes padding along the axes taking into account the plot aspect.
-
get_param_values= functools.partial(<function Parameters.deprecate.<locals>.inner>, <class 'holoviews.plotting.mpl.annotation.SplinePlot'>) 
-
get_value_generator= functools.partial(<function Parameters.deprecate.<locals>.inner>, <class 'holoviews.plotting.mpl.annotation.SplinePlot'>) 
-
get_zorder( overlay , key , el ) ¶ -
Computes the z-order of element in the NdOverlay taking into account possible batching of elements.
-
init_artists( ax , plot_args , plot_kwargs ) ¶ -
Initializes the artist based on the plot method declared on the plot.
-
init_comm( ) ¶ -
Initializes comm and attaches streams.
-
inspect_value= functools.partial(<function Parameters.deprecate.<locals>.inner>, <class 'holoviews.plotting.mpl.annotation.SplinePlot'>) 
-
matches( spec ) ¶ -
Matches a specification against the current Plot.
-
message( *args , **kwargs ) ¶ -
Inspect .param.message method for the full docstring
-
params( *args , **kwargs ) ¶ -
Inspect .param.params method for the full docstring
-
pprint( imports=None , prefix=' ' , unknown_value='<?>' , qualify=False , separator='' ) ¶ -
(Experimental) Pretty printed representation that may be evaluated with eval. See pprint() function for more details.
-
print_param_defaults( *args , **kwargs ) ¶ -
Inspect .param.print_param_defaults method for the full docstring
-
print_param_values( *args , **kwargs ) ¶ -
Inspect .param.print_param_values method for the full docstring
-
push( ) ¶ -
Pushes updated plot data via the Comm.
-
refresh( **kwargs ) ¶ -
Refreshes the plot by rerendering it and then pushing the updated data if the plot has an associated Comm.
-
script_repr( imports=[] , prefix=' ' ) ¶ -
Variant of __repr__ designed for generating a runnable script.
-
set_default( *args , **kwargs ) ¶ -
Inspect .param.set_default method for the full docstring
-
set_dynamic_time_fn= functools.partial(<function Parameters.deprecate.<locals>.inner>, <class 'holoviews.plotting.mpl.annotation.SplinePlot'>) 
-
set_param= functools.partial(<function Parameters.deprecate.<locals>.inner>, <class 'holoviews.plotting.mpl.annotation.SplinePlot'>) 
-
state_pop( ) ¶ -
Restore the most recently saved state.
See state_push() for more details.
-
state_push( ) ¶ -
Save this instance’s state.
For Parameterized instances, this includes the state of dynamically generated values.
Subclasses that maintain short-term state should additionally save and restore that state using state_push() and state_pop().
Generally, this method is used by operations that need to test something without permanently altering the objects’ state.
-
teardown_handles( ) ¶ -
If no custom update_handles method is supplied this method is called to tear down any previous handles before replacing them.
-
traverse( fn=None , specs=None , full_breadth=True ) ¶ -
Traverses any nested DimensionedPlot returning a list of all plots that match the specs. The specs should be supplied as a list of either Plot types or callables, which should return a boolean given the plot class.
-
verbose( *args , **kwargs ) ¶ -
Inspect .param.verbose method for the full docstring
-
warning( *args , **kwargs ) ¶ -
Inspect .param.warning method for the full docstring
-
param Parameter
-
class
holoviews.plotting.mpl.annotation.TextPlot( annotation , **params ) [source] ¶ -
Bases:
holoviews.plotting.mpl.annotation.AnnotationPlotDraw the Text annotation object
-
param Parameter
fontsize( allow_None=True, constant=False, default=None, instantiate=False, pickle_default_value=True, precedence=None, readonly=False, watchers={} ) - Specifies various font sizes of the displayed text. Finer control is available by supplying a dictionary where any unmentioned keys revert to the default sizes, e.g: {‘ticks’:20, ‘title’:15, ‘ylabel’:5, ‘xlabel’:5, ‘zlabel’:5, ‘legend’:8, ‘legend_title’:13} You can set the font size of ‘zlabel’, ‘ylabel’ and ‘xlabel’ together using the ‘labels’ key.
-
param Boolean
show_title( allow_None=False, bounds=(0, 1), constant=False, default=True, instantiate=False, pickle_default_value=True, precedence=None, readonly=False, watchers={} ) - Whether to display the plot title.
-
param String
title( allow_None=False, basestring=<class ‘str’>, constant=False, default={label} {group} {dimensions}, instantiate=False, pickle_default_value=True, precedence=None, readonly=False, regex=None, watchers={} ) - The formatting string for the title of this plot, allows defining a label group separator and dimension labels.
-
param String
title_format( allow_None=True, basestring=<class ‘str’>, constant=False, default=None, instantiate=False, pickle_default_value=True, precedence=None, readonly=False, regex=None, watchers={} ) - Alias for title.
-
param Boolean
normalize( allow_None=False, bounds=(0, 1), constant=False, default=True, instantiate=False, pickle_default_value=True, precedence=None, readonly=False, watchers={} ) - Whether to compute ranges across all Elements at this level of plotting. Allows selecting normalization at different levels for nested data containers.
-
param Parameter
projection( allow_None=True, constant=False, default=None, instantiate=False, pickle_default_value=True, precedence=None, readonly=False, watchers={} ) - The projection of the plot axis, default of None is equivalent to 2D plot, ‘3d’ and ‘polar’ are also supported by matplotlib by default. May also supply a custom projection that is either a matplotlib projection type or implements the _as_mpl_axes method.
-
param Number
fig_alpha( allow_None=False, bounds=(0, 1), constant=False, default=1.0, inclusive_bounds=(True, True), instantiate=False, pickle_default_value=True, precedence=None, readonly=False, softbounds=None, time_dependent=False, time_fn=<Time Time00001>, watchers={} ) - Alpha of the overall figure background.
-
param NumericTuple
fig_bounds( allow_None=False, constant=False, default=(0.15, 0.15, 0.85, 0.85), instantiate=False, length=4, pickle_default_value=True, precedence=None, readonly=False, watchers={} ) - The bounds of the overall figure as a 4-tuple of the form (left, bottom, right, top), defining the size of the border around the subplots.
-
param Parameter
fig_inches( allow_None=False, constant=False, default=4, instantiate=False, pickle_default_value=True, precedence=None, readonly=False, watchers={} ) - The overall matplotlib figure size in inches. May be set as an integer in which case it will be used to autocompute a size. Alternatively may be set with an explicit tuple or list, in which case it will be applied directly after being scaled by fig_size. If either the width or height is set to None, it will be computed automatically.
-
param Boolean
fig_latex( allow_None=False, bounds=(0, 1), constant=False, default=False, instantiate=False, pickle_default_value=True, precedence=None, readonly=False, watchers={} ) - Whether to use LaTeX text in the overall figure.
-
param Dict
fig_rcparams( allow_None=False, constant=False, default={}, instantiate=True, is_instance=True, pickle_default_value=True, precedence=None, readonly=False, watchers={} ) - matplotlib rc parameters to apply to the overall figure.
-
param Number
fig_size( allow_None=False, bounds=(1, None), constant=False, default=100.0, inclusive_bounds=(True, True), instantiate=False, pickle_default_value=True, precedence=None, readonly=False, softbounds=None, time_dependent=False, time_fn=<Time Time00001>, watchers={} ) - Size relative to the supplied overall fig_inches in percent.
-
param HookList
initial_hooks( allow_None=False, bounds=(0, None), constant=False, default=[], instantiate=True, pickle_default_value=True, precedence=None, readonly=False, watchers={} ) - Optional list of hooks called before plotting the data onto the axis (now marked for deprecation). The hook is passed the plot object and the displayed object; other plotting handles can be accessed via plot.handles.
-
param HookList
finalize_hooks( allow_None=False, bounds=(0, None), constant=False, default=[], instantiate=True, pickle_default_value=True, precedence=None, readonly=False, watchers={} ) - Deprecated; use hooks options instead.
-
param HookList
hooks( allow_None=False, bounds=(0, None), constant=False, default=[], instantiate=True, pickle_default_value=True, precedence=None, readonly=False, watchers={} ) - Optional list of hooks called when finalizing a plot. The hook is passed the plot object and the displayed element, and other plotting handles can be accessed via plot.handles.
-
param String
sublabel_format( allow_None=True, basestring=<class ‘str’>, constant=False, default=None, instantiate=False, pickle_default_value=True, precedence=None, readonly=False, regex=None, watchers={} ) - Allows labeling the subaxes in each plot with various formatters including {Alpha}, {alpha}, {numeric} and {roman}.
-
param NumericTuple
sublabel_position( allow_None=False, constant=False, default=(-0.35, 0.85), instantiate=False, length=2, pickle_default_value=True, precedence=None, readonly=False, watchers={} ) - Position relative to the plot for placing the optional subfigure label.
-
param Number
sublabel_size( allow_None=False, bounds=None, constant=False, default=18, inclusive_bounds=(True, True), instantiate=False, pickle_default_value=True, precedence=None, readonly=False, softbounds=None, time_dependent=False, time_fn=<Time Time00001>, watchers={} ) - Size of optional subfigure label.
-
param Boolean
show_frame( allow_None=False, bounds=(0, 1), constant=False, default=False, instantiate=False, pickle_default_value=True, precedence=None, readonly=False, watchers={} ) - Whether or not to show a complete frame around the plot.
-
param Boolean
apply_ranges( allow_None=False, bounds=(0, 1), constant=False, default=True, instantiate=False, pickle_default_value=True, precedence=None, readonly=False, watchers={} ) - Whether to compute the plot bounds from the data itself.
-
param Boolean
apply_extents( allow_None=False, bounds=(0, 1), constant=False, default=True, instantiate=False, pickle_default_value=True, precedence=None, readonly=False, watchers={} ) - Whether to apply extent overrides on the Elements
-
param ClassSelector
bgcolor( allow_None=True, constant=False, default=None, instantiate=True, is_instance=True, pickle_default_value=True, precedence=None, readonly=False, watchers={} ) - If set bgcolor overrides the background color of the axis.
-
param ClassSelector
default_span( allow_None=False, constant=False, default=2.0, instantiate=True, is_instance=True, pickle_default_value=True, precedence=None, readonly=False, watchers={} ) - Defines the span of an axis if the axis range is zero, i.e. if the lower and upper end of an axis are equal or no range is defined at all. For example if there is a single datapoint at 0 a default_span of 2.0 will result in axis ranges spanning from -1 to 1.
-
param Boolean
invert_axes( allow_None=False, bounds=(0, 1), constant=False, default=False, instantiate=False, pickle_default_value=True, precedence=None, readonly=False, watchers={} ) - Whether to invert the x- and y-axis
-
param Boolean
invert_xaxis( allow_None=False, bounds=(0, 1), constant=False, default=False, instantiate=False, pickle_default_value=True, precedence=None, readonly=False, watchers={} ) - Whether to invert the plot x-axis.
-
param Boolean
invert_yaxis( allow_None=False, bounds=(0, 1), constant=False, default=False, instantiate=False, pickle_default_value=True, precedence=None, readonly=False, watchers={} ) - Whether to invert the plot y-axis.
-
param Boolean
logx( allow_None=False, bounds=(0, 1), constant=False, default=False, instantiate=False, pickle_default_value=True, precedence=None, readonly=False, watchers={} ) - Whether the x-axis of the plot will be a log axis.
-
param Boolean
logy( allow_None=False, bounds=(0, 1), constant=False, default=False, instantiate=False, pickle_default_value=True, precedence=None, readonly=False, watchers={} ) - Whether the y-axis of the plot will be a log axis.
-
param ClassSelector
padding( allow_None=False, constant=False, default=0, instantiate=True, is_instance=True, pickle_default_value=True, precedence=None, readonly=False, watchers={} ) - Fraction by which to increase auto-ranged extents to make datapoints more visible around borders. To compute padding, the axis whose screen size is largest is chosen, and the range of that axis is increased by the specified fraction along each axis. Other axes are then padded ensuring that the amount of screen space devoted to padding is equal for all axes. If specified as a tuple, the int or float values in the tuple will be used for padding in each axis, in order (x,y or x,y,z). For example, for padding=0.2 on a 800x800-pixel plot, an x-axis with the range [0,10] will be padded by 20% to be [-1,11], while a y-axis with a range [0,1000] will be padded to be [-100,1100], which should make the padding be approximately the same number of pixels. But if the same plot is changed to have a height of only 200, the y-range will then be [-400,1400] so that the y-axis padding will still match that of the x-axis. It is also possible to declare non-equal padding value for the lower and upper bound of an axis by supplying nested tuples, e.g. padding=(0.1, (0, 0.1)) will pad the x-axis lower and upper bound as well as the y-axis upper bound by a fraction of 0.1 while the y-axis lower bound is not padded at all.
-
param Boolean
show_legend( allow_None=False, bounds=(0, 1), constant=False, default=False, instantiate=False, pickle_default_value=True, precedence=None, readonly=False, watchers={} ) - Whether to show legend for the plot.
-
param Boolean
show_grid( allow_None=False, bounds=(0, 1), constant=False, default=False, instantiate=False, pickle_default_value=True, precedence=None, readonly=False, watchers={} ) - Whether to show a Cartesian grid on the plot.
-
param ObjectSelector
xaxis( allow_None=None, check_on_set=True, compute_default_fn=None, constant=False, default=bottom, instantiate=False, names=None, objects=[‘top’, ‘bottom’, ‘bare’, ‘top-bare’, ‘bottom-bare’, None, True, False], pickle_default_value=True, precedence=None, readonly=False, watchers={} ) - Whether and where to display the xaxis. The “bare” options allow suppressing all axis labels, including ticks and xlabel. Valid options are ‘top’, ‘bottom’, ‘bare’, ‘top-bare’ and ‘bottom-bare’.
-
param ObjectSelector
yaxis( allow_None=None, check_on_set=True, compute_default_fn=None, constant=False, default=left, instantiate=False, names=None, objects=[‘left’, ‘right’, ‘bare’, ‘left-bare’, ‘right-bare’, None, True, False], pickle_default_value=True, precedence=None, readonly=False, watchers={} ) - Whether and where to display the yaxis. The “bare” options allow suppressing all axis labels, including ticks and ylabel. Valid options are ‘left’, ‘right’, ‘bare’, ‘left-bare’ and ‘right-bare’.
-
param String
xlabel( allow_None=True, basestring=<class ‘str’>, constant=False, default=None, instantiate=False, pickle_default_value=True, precedence=None, readonly=False, regex=None, watchers={} ) - An explicit override of the x-axis label, if set takes precedence over the dimension label.
-
param String
ylabel( allow_None=True, basestring=<class ‘str’>, constant=False, default=None, instantiate=False, pickle_default_value=True, precedence=None, readonly=False, regex=None, watchers={} ) - An explicit override of the y-axis label, if set takes precedence over the dimension label.
-
param NumericTuple
xlim( allow_None=False, constant=False, default=(nan, nan), instantiate=False, length=2, pickle_default_value=True, precedence=None, readonly=False, watchers={} ) - User-specified x-axis range limits for the plot, as a tuple (low,high). If specified, takes precedence over data and dimension ranges.
-
param NumericTuple
ylim( allow_None=False, constant=False, default=(nan, nan), instantiate=False, length=2, pickle_default_value=True, precedence=None, readonly=False, watchers={} ) - User-specified x-axis range limits for the plot, as a tuple (low,high). If specified, takes precedence over data and dimension ranges.
-
param NumericTuple
zlim( allow_None=False, constant=False, default=(nan, nan), instantiate=False, length=2, pickle_default_value=True, precedence=None, readonly=False, watchers={} ) - User-specified z-axis range limits for the plot, as a tuple (low,high). If specified, takes precedence over data and dimension ranges.
-
param Integer
xrotation( allow_None=True, bounds=(0, 360), constant=False, default=None, inclusive_bounds=(True, True), instantiate=False, pickle_default_value=True, precedence=None, readonly=False, softbounds=None, time_dependent=False, time_fn=<Time Time00001>, watchers={} ) - Rotation angle of the xticks.
-
param Integer
yrotation( allow_None=True, bounds=(0, 360), constant=False, default=None, inclusive_bounds=(True, True), instantiate=False, pickle_default_value=True, precedence=None, readonly=False, softbounds=None, time_dependent=False, time_fn=<Time Time00001>, watchers={} ) - Rotation angle of the yticks.
-
param Parameter
xticks( allow_None=True, constant=False, default=None, instantiate=False, pickle_default_value=True, precedence=None, readonly=False, watchers={} ) - Ticks along x-axis specified as an integer, explicit list of tick locations, or bokeh Ticker object. If set to None default bokeh ticking behavior is applied.
-
param Parameter
yticks( allow_None=True, constant=False, default=None, instantiate=False, pickle_default_value=True, precedence=None, readonly=False, watchers={} ) - Ticks along y-axis specified as an integer, explicit list of tick locations, or bokeh Ticker object. If set to None default bokeh ticking behavior is applied.
-
param Boolean
apply_ticks( allow_None=False, bounds=(0, 1), constant=False, default=True, instantiate=False, pickle_default_value=True, precedence=None, readonly=False, watchers={} ) - Whether to apply custom ticks.
-
param Parameter
aspect( allow_None=False, constant=False, default=square, instantiate=False, pickle_default_value=True, precedence=None, readonly=False, watchers={} ) - The aspect ratio mode of the plot. By default, a plot may select its own appropriate aspect ratio but sometimes it may be necessary to force a square aspect ratio (e.g. to display the plot as an element of a grid). The modes ‘auto’ and ‘equal’ correspond to the axis modes of the same name in matplotlib, a numeric value may also be passed.
-
param Boolean
invert_zaxis( allow_None=False, bounds=(0, 1), constant=False, default=False, instantiate=False, pickle_default_value=True, precedence=None, readonly=False, watchers={} ) - Whether to invert the plot z-axis.
-
param List
labelled( allow_None=False, bounds=(0, None), constant=False, default=[‘x’, ‘y’], instantiate=True, pickle_default_value=True, precedence=None, readonly=False, watchers={} ) - Whether to plot the ‘x’ and ‘y’ labels.
-
param Boolean
logz( allow_None=False, bounds=(0, 1), constant=False, default=False, instantiate=False, pickle_default_value=True, precedence=None, readonly=False, watchers={} ) - Whether to apply log scaling to the y-axis of the Chart.
-
param ClassSelector
xformatter( allow_None=True, constant=False, default=None, instantiate=True, is_instance=True, pickle_default_value=True, precedence=None, readonly=False, watchers={} ) - Formatter for ticks along the x-axis.
-
param ClassSelector
yformatter( allow_None=True, constant=False, default=None, instantiate=True, is_instance=True, pickle_default_value=True, precedence=None, readonly=False, watchers={} ) - Formatter for ticks along the y-axis.
-
param ClassSelector
zformatter( allow_None=True, constant=False, default=None, instantiate=True, is_instance=True, pickle_default_value=True, precedence=None, readonly=False, watchers={} ) - Formatter for ticks along the z-axis.
-
param Boolean
zaxis( allow_None=False, bounds=(0, 1), constant=False, default=True, instantiate=False, pickle_default_value=True, precedence=None, readonly=False, watchers={} ) - Whether to display the z-axis.
-
param String
zlabel( allow_None=True, basestring=<class ‘str’>, constant=False, default=None, instantiate=False, pickle_default_value=True, precedence=None, readonly=False, regex=None, watchers={} ) - An explicit override of the z-axis label, if set takes precedence over the dimension label.
-
param Integer
zrotation( allow_None=False, bounds=(0, 360), constant=False, default=0, inclusive_bounds=(True, True), instantiate=False, pickle_default_value=True, precedence=None, readonly=False, softbounds=None, time_dependent=False, time_fn=<Time Time00001>, watchers={} ) - Rotation angle of the zticks.
-
param Parameter
zticks( allow_None=True, constant=False, default=None, instantiate=False, pickle_default_value=True, precedence=None, readonly=False, watchers={} ) - Ticks along z-axis specified as an integer, explicit list of tick locations, list of tuples containing the locations and labels or a matplotlib tick locator object. If set to None default matplotlib ticking behavior is applied.
-
anim( start=0 , stop=None , fps=30 ) ¶ -
Method to return a matplotlib animation. The start and stop frames may be specified as well as the fps.
-
cleanup( ) ¶ -
Cleans up references to the plot on the attached Stream subscribers.
-
compute_ranges( obj , key , ranges ) ¶ -
Given an object, a specific key, and the normalization options, this method will find the specified normalization options on the appropriate OptionTree, group the elements according to the selected normalization option (i.e. either per frame or over the whole animation) and finally compute the dimension ranges in each group. The new set of ranges is returned.
-
debug( *args , **kwargs ) ¶ -
Inspect .param.debug method for the full docstring
-
defaults( *args , **kwargs ) ¶ -
Inspect .param.defaults method for the full docstring
-
force_new_dynamic_value= functools.partial(<function Parameters.deprecate.<locals>.inner>, <class 'holoviews.plotting.mpl.annotation.TextPlot'>) 
-
get_aspect( xspan , yspan ) ¶ -
Computes the aspect ratio of the plot
-
get_extents( element , ranges , range_type='combined' , xdim=None , ydim=None , zdim=None ) ¶ -
Gets the extents for the axes from the current Element. The globally computed ranges can optionally override the extents.
The extents are computed by combining the data ranges, extents and dimension ranges. Each of these can be obtained individually by setting the range_type to one of:
- ‘data’: Just the data ranges
- ‘extents’: Element.extents
- ‘soft’: Dimension.soft_range values
- ‘hard’: Dimension.range values
To obtain the combined range, which includes range padding the default may be used:
- ‘combined’: All the range types combined and padding applied
This allows Overlay plots to obtain each range and combine them appropriately for all the objects in the overlay.
-
get_padding( extents ) ¶ -
Computes padding along the axes taking into account the plot aspect.
-
get_param_values= functools.partial(<function Parameters.deprecate.<locals>.inner>, <class 'holoviews.plotting.mpl.annotation.TextPlot'>) 
-
get_value_generator= functools.partial(<function Parameters.deprecate.<locals>.inner>, <class 'holoviews.plotting.mpl.annotation.TextPlot'>) 
-
get_zorder( overlay , key , el ) ¶ -
Computes the z-order of element in the NdOverlay taking into account possible batching of elements.
-
init_artists( ax , plot_args , plot_kwargs ) ¶ -
Initializes the artist based on the plot method declared on the plot.
-
init_comm( ) ¶ -
Initializes comm and attaches streams.
-
inspect_value= functools.partial(<function Parameters.deprecate.<locals>.inner>, <class 'holoviews.plotting.mpl.annotation.TextPlot'>) 
-
matches( spec ) ¶ -
Matches a specification against the current Plot.
-
message( *args , **kwargs ) ¶ -
Inspect .param.message method for the full docstring
-
params( *args , **kwargs ) ¶ -
Inspect .param.params method for the full docstring
-
pprint( imports=None , prefix=' ' , unknown_value='<?>' , qualify=False , separator='' ) ¶ -
(Experimental) Pretty printed representation that may be evaluated with eval. See pprint() function for more details.
-
print_param_defaults( *args , **kwargs ) ¶ -
Inspect .param.print_param_defaults method for the full docstring
-
print_param_values( *args , **kwargs ) ¶ -
Inspect .param.print_param_values method for the full docstring
-
push( ) ¶ -
Pushes updated plot data via the Comm.
-
refresh( **kwargs ) ¶ -
Refreshes the plot by rerendering it and then pushing the updated data if the plot has an associated Comm.
-
script_repr( imports=[] , prefix=' ' ) ¶ -
Variant of __repr__ designed for generating a runnable script.
-
set_default( *args , **kwargs ) ¶ -
Inspect .param.set_default method for the full docstring
-
set_dynamic_time_fn= functools.partial(<function Parameters.deprecate.<locals>.inner>, <class 'holoviews.plotting.mpl.annotation.TextPlot'>) 
-
set_param= functools.partial(<function Parameters.deprecate.<locals>.inner>, <class 'holoviews.plotting.mpl.annotation.TextPlot'>) 
-
state_pop( ) ¶ -
Restore the most recently saved state.
See state_push() for more details.
-
state_push( ) ¶ -
Save this instance’s state.
For Parameterized instances, this includes the state of dynamically generated values.
Subclasses that maintain short-term state should additionally save and restore that state using state_push() and state_pop().
Generally, this method is used by operations that need to test something without permanently altering the objects’ state.
-
teardown_handles( ) ¶ -
If no custom update_handles method is supplied this method is called to tear down any previous handles before replacing them.
-
traverse( fn=None , specs=None , full_breadth=True ) ¶ -
Traverses any nested DimensionedPlot returning a list of all plots that match the specs. The specs should be supplied as a list of either Plot types or callables, which should return a boolean given the plot class.
-
verbose( *args , **kwargs ) ¶ -
Inspect .param.verbose method for the full docstring
-
warning( *args , **kwargs ) ¶ -
Inspect .param.warning method for the full docstring
-
param Parameter
-
class
holoviews.plotting.mpl.annotation.VLinePlot( annotation , **params ) [source] ¶ -
Bases:
holoviews.plotting.mpl.annotation.AnnotationPlotDraw a vertical line on the axis
-
param Parameter
fontsize( allow_None=True, constant=False, default=None, instantiate=False, pickle_default_value=True, precedence=None, readonly=False, watchers={} ) - Specifies various font sizes of the displayed text. Finer control is available by supplying a dictionary where any unmentioned keys revert to the default sizes, e.g: {‘ticks’:20, ‘title’:15, ‘ylabel’:5, ‘xlabel’:5, ‘zlabel’:5, ‘legend’:8, ‘legend_title’:13} You can set the font size of ‘zlabel’, ‘ylabel’ and ‘xlabel’ together using the ‘labels’ key.
-
param Boolean
show_title( allow_None=False, bounds=(0, 1), constant=False, default=True, instantiate=False, pickle_default_value=True, precedence=None, readonly=False, watchers={} ) - Whether to display the plot title.
-
param String
title( allow_None=False, basestring=<class ‘str’>, constant=False, default={label} {group} {dimensions}, instantiate=False, pickle_default_value=True, precedence=None, readonly=False, regex=None, watchers={} ) - The formatting string for the title of this plot, allows defining a label group separator and dimension labels.
-
param String
title_format( allow_None=True, basestring=<class ‘str’>, constant=False, default=None, instantiate=False, pickle_default_value=True, precedence=None, readonly=False, regex=None, watchers={} ) - Alias for title.
-
param Boolean
normalize( allow_None=False, bounds=(0, 1), constant=False, default=True, instantiate=False, pickle_default_value=True, precedence=None, readonly=False, watchers={} ) - Whether to compute ranges across all Elements at this level of plotting. Allows selecting normalization at different levels for nested data containers.
-
param Parameter
projection( allow_None=True, constant=False, default=None, instantiate=False, pickle_default_value=True, precedence=None, readonly=False, watchers={} ) - The projection of the plot axis, default of None is equivalent to 2D plot, ‘3d’ and ‘polar’ are also supported by matplotlib by default. May also supply a custom projection that is either a matplotlib projection type or implements the _as_mpl_axes method.
-
param Number
fig_alpha( allow_None=False, bounds=(0, 1), constant=False, default=1.0, inclusive_bounds=(True, True), instantiate=False, pickle_default_value=True, precedence=None, readonly=False, softbounds=None, time_dependent=False, time_fn=<Time Time00001>, watchers={} ) - Alpha of the overall figure background.
-
param NumericTuple
fig_bounds( allow_None=False, constant=False, default=(0.15, 0.15, 0.85, 0.85), instantiate=False, length=4, pickle_default_value=True, precedence=None, readonly=False, watchers={} ) - The bounds of the overall figure as a 4-tuple of the form (left, bottom, right, top), defining the size of the border around the subplots.
-
param Parameter
fig_inches( allow_None=False, constant=False, default=4, instantiate=False, pickle_default_value=True, precedence=None, readonly=False, watchers={} ) - The overall matplotlib figure size in inches. May be set as an integer in which case it will be used to autocompute a size. Alternatively may be set with an explicit tuple or list, in which case it will be applied directly after being scaled by fig_size. If either the width or height is set to None, it will be computed automatically.
-
param Boolean
fig_latex( allow_None=False, bounds=(0, 1), constant=False, default=False, instantiate=False, pickle_default_value=True, precedence=None, readonly=False, watchers={} ) - Whether to use LaTeX text in the overall figure.
-
param Dict
fig_rcparams( allow_None=False, constant=False, default={}, instantiate=True, is_instance=True, pickle_default_value=True, precedence=None, readonly=False, watchers={} ) - matplotlib rc parameters to apply to the overall figure.
-
param Number
fig_size( allow_None=False, bounds=(1, None), constant=False, default=100.0, inclusive_bounds=(True, True), instantiate=False, pickle_default_value=True, precedence=None, readonly=False, softbounds=None, time_dependent=False, time_fn=<Time Time00001>, watchers={} ) - Size relative to the supplied overall fig_inches in percent.
-
param HookList
initial_hooks( allow_None=False, bounds=(0, None), constant=False, default=[], instantiate=True, pickle_default_value=True, precedence=None, readonly=False, watchers={} ) - Optional list of hooks called before plotting the data onto the axis (now marked for deprecation). The hook is passed the plot object and the displayed object; other plotting handles can be accessed via plot.handles.
-
param HookList
finalize_hooks( allow_None=False, bounds=(0, None), constant=False, default=[], instantiate=True, pickle_default_value=True, precedence=None, readonly=False, watchers={} ) - Deprecated; use hooks options instead.
-
param HookList
hooks( allow_None=False, bounds=(0, None), constant=False, default=[], instantiate=True, pickle_default_value=True, precedence=None, readonly=False, watchers={} ) - Optional list of hooks called when finalizing a plot. The hook is passed the plot object and the displayed element, and other plotting handles can be accessed via plot.handles.
-
param String
sublabel_format( allow_None=True, basestring=<class ‘str’>, constant=False, default=None, instantiate=False, pickle_default_value=True, precedence=None, readonly=False, regex=None, watchers={} ) - Allows labeling the subaxes in each plot with various formatters including {Alpha}, {alpha}, {numeric} and {roman}.
-
param NumericTuple
sublabel_position( allow_None=False, constant=False, default=(-0.35, 0.85), instantiate=False, length=2, pickle_default_value=True, precedence=None, readonly=False, watchers={} ) - Position relative to the plot for placing the optional subfigure label.
-
param Number
sublabel_size( allow_None=False, bounds=None, constant=False, default=18, inclusive_bounds=(True, True), instantiate=False, pickle_default_value=True, precedence=None, readonly=False, softbounds=None, time_dependent=False, time_fn=<Time Time00001>, watchers={} ) - Size of optional subfigure label.
-
param Boolean
show_frame( allow_None=False, bounds=(0, 1), constant=False, default=False, instantiate=False, pickle_default_value=True, precedence=None, readonly=False, watchers={} ) - Whether or not to show a complete frame around the plot.
-
param Boolean
apply_ranges( allow_None=False, bounds=(0, 1), constant=False, default=True, instantiate=False, pickle_default_value=True, precedence=None, readonly=False, watchers={} ) - Whether to compute the plot bounds from the data itself.
-
param Boolean
apply_extents( allow_None=False, bounds=(0, 1), constant=False, default=True, instantiate=False, pickle_default_value=True, precedence=None, readonly=False, watchers={} ) - Whether to apply extent overrides on the Elements
-
param ClassSelector
bgcolor( allow_None=True, constant=False, default=None, instantiate=True, is_instance=True, pickle_default_value=True, precedence=None, readonly=False, watchers={} ) - If set bgcolor overrides the background color of the axis.
-
param ClassSelector
default_span( allow_None=False, constant=False, default=2.0, instantiate=True, is_instance=True, pickle_default_value=True, precedence=None, readonly=False, watchers={} ) - Defines the span of an axis if the axis range is zero, i.e. if the lower and upper end of an axis are equal or no range is defined at all. For example if there is a single datapoint at 0 a default_span of 2.0 will result in axis ranges spanning from -1 to 1.
-
param Boolean
invert_axes( allow_None=False, bounds=(0, 1), constant=False, default=False, instantiate=False, pickle_default_value=True, precedence=None, readonly=False, watchers={} ) - Whether to invert the x- and y-axis
-
param Boolean
invert_xaxis( allow_None=False, bounds=(0, 1), constant=False, default=False, instantiate=False, pickle_default_value=True, precedence=None, readonly=False, watchers={} ) - Whether to invert the plot x-axis.
-
param Boolean
invert_yaxis( allow_None=False, bounds=(0, 1), constant=False, default=False, instantiate=False, pickle_default_value=True, precedence=None, readonly=False, watchers={} ) - Whether to invert the plot y-axis.
-
param Boolean
logx( allow_None=False, bounds=(0, 1), constant=False, default=False, instantiate=False, pickle_default_value=True, precedence=None, readonly=False, watchers={} ) - Whether the x-axis of the plot will be a log axis.
-
param Boolean
logy( allow_None=False, bounds=(0, 1), constant=False, default=False, instantiate=False, pickle_default_value=True, precedence=None, readonly=False, watchers={} ) - Whether the y-axis of the plot will be a log axis.
-
param ClassSelector
padding( allow_None=False, constant=False, default=0, instantiate=True, is_instance=True, pickle_default_value=True, precedence=None, readonly=False, watchers={} ) - Fraction by which to increase auto-ranged extents to make datapoints more visible around borders. To compute padding, the axis whose screen size is largest is chosen, and the range of that axis is increased by the specified fraction along each axis. Other axes are then padded ensuring that the amount of screen space devoted to padding is equal for all axes. If specified as a tuple, the int or float values in the tuple will be used for padding in each axis, in order (x,y or x,y,z). For example, for padding=0.2 on a 800x800-pixel plot, an x-axis with the range [0,10] will be padded by 20% to be [-1,11], while a y-axis with a range [0,1000] will be padded to be [-100,1100], which should make the padding be approximately the same number of pixels. But if the same plot is changed to have a height of only 200, the y-range will then be [-400,1400] so that the y-axis padding will still match that of the x-axis. It is also possible to declare non-equal padding value for the lower and upper bound of an axis by supplying nested tuples, e.g. padding=(0.1, (0, 0.1)) will pad the x-axis lower and upper bound as well as the y-axis upper bound by a fraction of 0.1 while the y-axis lower bound is not padded at all.
-
param Boolean
show_legend( allow_None=False, bounds=(0, 1), constant=False, default=False, instantiate=False, pickle_default_value=True, precedence=None, readonly=False, watchers={} ) - Whether to show legend for the plot.
-
param Boolean
show_grid( allow_None=False, bounds=(0, 1), constant=False, default=False, instantiate=False, pickle_default_value=True, precedence=None, readonly=False, watchers={} ) - Whether to show a Cartesian grid on the plot.
-
param ObjectSelector
xaxis( allow_None=None, check_on_set=True, compute_default_fn=None, constant=False, default=bottom, instantiate=False, names=None, objects=[‘top’, ‘bottom’, ‘bare’, ‘top-bare’, ‘bottom-bare’, None, True, False], pickle_default_value=True, precedence=None, readonly=False, watchers={} ) - Whether and where to display the xaxis. The “bare” options allow suppressing all axis labels, including ticks and xlabel. Valid options are ‘top’, ‘bottom’, ‘bare’, ‘top-bare’ and ‘bottom-bare’.
-
param ObjectSelector
yaxis( allow_None=None, check_on_set=True, compute_default_fn=None, constant=False, default=left, instantiate=False, names=None, objects=[‘left’, ‘right’, ‘bare’, ‘left-bare’, ‘right-bare’, None, True, False], pickle_default_value=True, precedence=None, readonly=False, watchers={} ) - Whether and where to display the yaxis. The “bare” options allow suppressing all axis labels, including ticks and ylabel. Valid options are ‘left’, ‘right’, ‘bare’, ‘left-bare’ and ‘right-bare’.
-
param String
xlabel( allow_None=True, basestring=<class ‘str’>, constant=False, default=None, instantiate=False, pickle_default_value=True, precedence=None, readonly=False, regex=None, watchers={} ) - An explicit override of the x-axis label, if set takes precedence over the dimension label.
-
param String
ylabel( allow_None=True, basestring=<class ‘str’>, constant=False, default=None, instantiate=False, pickle_default_value=True, precedence=None, readonly=False, regex=None, watchers={} ) - An explicit override of the y-axis label, if set takes precedence over the dimension label.
-
param NumericTuple
xlim( allow_None=False, constant=False, default=(nan, nan), instantiate=False, length=2, pickle_default_value=True, precedence=None, readonly=False, watchers={} ) - User-specified x-axis range limits for the plot, as a tuple (low,high). If specified, takes precedence over data and dimension ranges.
-
param NumericTuple
ylim( allow_None=False, constant=False, default=(nan, nan), instantiate=False, length=2, pickle_default_value=True, precedence=None, readonly=False, watchers={} ) - User-specified x-axis range limits for the plot, as a tuple (low,high). If specified, takes precedence over data and dimension ranges.
-
param NumericTuple
zlim( allow_None=False, constant=False, default=(nan, nan), instantiate=False, length=2, pickle_default_value=True, precedence=None, readonly=False, watchers={} ) - User-specified z-axis range limits for the plot, as a tuple (low,high). If specified, takes precedence over data and dimension ranges.
-
param Integer
xrotation( allow_None=True, bounds=(0, 360), constant=False, default=None, inclusive_bounds=(True, True), instantiate=False, pickle_default_value=True, precedence=None, readonly=False, softbounds=None, time_dependent=False, time_fn=<Time Time00001>, watchers={} ) - Rotation angle of the xticks.
-
param Integer
yrotation( allow_None=True, bounds=(0, 360), constant=False, default=None, inclusive_bounds=(True, True), instantiate=False, pickle_default_value=True, precedence=None, readonly=False, softbounds=None, time_dependent=False, time_fn=<Time Time00001>, watchers={} ) - Rotation angle of the yticks.
-
param Parameter
xticks( allow_None=True, constant=False, default=None, instantiate=False, pickle_default_value=True, precedence=None, readonly=False, watchers={} ) - Ticks along x-axis specified as an integer, explicit list of tick locations, or bokeh Ticker object. If set to None default bokeh ticking behavior is applied.
-
param Parameter
yticks( allow_None=True, constant=False, default=None, instantiate=False, pickle_default_value=True, precedence=None, readonly=False, watchers={} ) - Ticks along y-axis specified as an integer, explicit list of tick locations, or bokeh Ticker object. If set to None default bokeh ticking behavior is applied.
-
param Boolean
apply_ticks( allow_None=False, bounds=(0, 1), constant=False, default=True, instantiate=False, pickle_default_value=True, precedence=None, readonly=False, watchers={} ) - Whether to apply custom ticks.
-
param Parameter
aspect( allow_None=False, constant=False, default=square, instantiate=False, pickle_default_value=True, precedence=None, readonly=False, watchers={} ) - The aspect ratio mode of the plot. By default, a plot may select its own appropriate aspect ratio but sometimes it may be necessary to force a square aspect ratio (e.g. to display the plot as an element of a grid). The modes ‘auto’ and ‘equal’ correspond to the axis modes of the same name in matplotlib, a numeric value may also be passed.
-
param Boolean
invert_zaxis( allow_None=False, bounds=(0, 1), constant=False, default=False, instantiate=False, pickle_default_value=True, precedence=None, readonly=False, watchers={} ) - Whether to invert the plot z-axis.
-
param List
labelled( allow_None=False, bounds=(0, None), constant=False, default=[‘x’, ‘y’], instantiate=True, pickle_default_value=True, precedence=None, readonly=False, watchers={} ) - Whether to plot the ‘x’ and ‘y’ labels.
-
param Boolean
logz( allow_None=False, bounds=(0, 1), constant=False, default=False, instantiate=False, pickle_default_value=True, precedence=None, readonly=False, watchers={} ) - Whether to apply log scaling to the y-axis of the Chart.
-
param ClassSelector
xformatter( allow_None=True, constant=False, default=None, instantiate=True, is_instance=True, pickle_default_value=True, precedence=None, readonly=False, watchers={} ) - Formatter for ticks along the x-axis.
-
param ClassSelector
yformatter( allow_None=True, constant=False, default=None, instantiate=True, is_instance=True, pickle_default_value=True, precedence=None, readonly=False, watchers={} ) - Formatter for ticks along the y-axis.
-
param ClassSelector
zformatter( allow_None=True, constant=False, default=None, instantiate=True, is_instance=True, pickle_default_value=True, precedence=None, readonly=False, watchers={} ) - Formatter for ticks along the z-axis.
-
param Boolean
zaxis( allow_None=False, bounds=(0, 1), constant=False, default=True, instantiate=False, pickle_default_value=True, precedence=None, readonly=False, watchers={} ) - Whether to display the z-axis.
-
param String
zlabel( allow_None=True, basestring=<class ‘str’>, constant=False, default=None, instantiate=False, pickle_default_value=True, precedence=None, readonly=False, regex=None, watchers={} ) - An explicit override of the z-axis label, if set takes precedence over the dimension label.
-
param Integer
zrotation( allow_None=False, bounds=(0, 360), constant=False, default=0, inclusive_bounds=(True, True), instantiate=False, pickle_default_value=True, precedence=None, readonly=False, softbounds=None, time_dependent=False, time_fn=<Time Time00001>, watchers={} ) - Rotation angle of the zticks.
-
param Parameter
zticks( allow_None=True, constant=False, default=None, instantiate=False, pickle_default_value=True, precedence=None, readonly=False, watchers={} ) - Ticks along z-axis specified as an integer, explicit list of tick locations, list of tuples containing the locations and labels or a matplotlib tick locator object. If set to None default matplotlib ticking behavior is applied.
-
anim( start=0 , stop=None , fps=30 ) ¶ -
Method to return a matplotlib animation. The start and stop frames may be specified as well as the fps.
-
cleanup( ) ¶ -
Cleans up references to the plot on the attached Stream subscribers.
-
compute_ranges( obj , key , ranges ) ¶ -
Given an object, a specific key, and the normalization options, this method will find the specified normalization options on the appropriate OptionTree, group the elements according to the selected normalization option (i.e. either per frame or over the whole animation) and finally compute the dimension ranges in each group. The new set of ranges is returned.
-
debug( *args , **kwargs ) ¶ -
Inspect .param.debug method for the full docstring
-
defaults( *args , **kwargs ) ¶ -
Inspect .param.defaults method for the full docstring
-
force_new_dynamic_value= functools.partial(<function Parameters.deprecate.<locals>.inner>, <class 'holoviews.plotting.mpl.annotation.VLinePlot'>) 
-
get_aspect( xspan , yspan ) ¶ -
Computes the aspect ratio of the plot
-
get_extents( element , ranges , range_type='combined' , xdim=None , ydim=None , zdim=None ) ¶ -
Gets the extents for the axes from the current Element. The globally computed ranges can optionally override the extents.
The extents are computed by combining the data ranges, extents and dimension ranges. Each of these can be obtained individually by setting the range_type to one of:
- ‘data’: Just the data ranges
- ‘extents’: Element.extents
- ‘soft’: Dimension.soft_range values
- ‘hard’: Dimension.range values
To obtain the combined range, which includes range padding the default may be used:
- ‘combined’: All the range types combined and padding applied
This allows Overlay plots to obtain each range and combine them appropriately for all the objects in the overlay.
-
get_padding( extents ) ¶ -
Computes padding along the axes taking into account the plot aspect.
-
get_param_values= functools.partial(<function Parameters.deprecate.<locals>.inner>, <class 'holoviews.plotting.mpl.annotation.VLinePlot'>) 
-
get_value_generator= functools.partial(<function Parameters.deprecate.<locals>.inner>, <class 'holoviews.plotting.mpl.annotation.VLinePlot'>) 
-
get_zorder( overlay , key , el ) ¶ -
Computes the z-order of element in the NdOverlay taking into account possible batching of elements.
-
init_artists( ax , plot_args , plot_kwargs ) ¶ -
Initializes the artist based on the plot method declared on the plot.
-
init_comm( ) ¶ -
Initializes comm and attaches streams.
-
inspect_value= functools.partial(<function Parameters.deprecate.<locals>.inner>, <class 'holoviews.plotting.mpl.annotation.VLinePlot'>) 
-
matches( spec ) ¶ -
Matches a specification against the current Plot.
-
message( *args , **kwargs ) ¶ -
Inspect .param.message method for the full docstring
-
params( *args , **kwargs ) ¶ -
Inspect .param.params method for the full docstring
-
pprint( imports=None , prefix=' ' , unknown_value='<?>' , qualify=False , separator='' ) ¶ -
(Experimental) Pretty printed representation that may be evaluated with eval. See pprint() function for more details.
-
print_param_defaults( *args , **kwargs ) ¶ -
Inspect .param.print_param_defaults method for the full docstring
-
print_param_values( *args , **kwargs ) ¶ -
Inspect .param.print_param_values method for the full docstring
-
push( ) ¶ -
Pushes updated plot data via the Comm.
-
refresh( **kwargs ) ¶ -
Refreshes the plot by rerendering it and then pushing the updated data if the plot has an associated Comm.
-
script_repr( imports=[] , prefix=' ' ) ¶ -
Variant of __repr__ designed for generating a runnable script.
-
set_default( *args , **kwargs ) ¶ -
Inspect .param.set_default method for the full docstring
-
set_dynamic_time_fn= functools.partial(<function Parameters.deprecate.<locals>.inner>, <class 'holoviews.plotting.mpl.annotation.VLinePlot'>) 
-
set_param= functools.partial(<function Parameters.deprecate.<locals>.inner>, <class 'holoviews.plotting.mpl.annotation.VLinePlot'>) 
-
state_pop( ) ¶ -
Restore the most recently saved state.
See state_push() for more details.
-
state_push( ) ¶ -
Save this instance’s state.
For Parameterized instances, this includes the state of dynamically generated values.
Subclasses that maintain short-term state should additionally save and restore that state using state_push() and state_pop().
Generally, this method is used by operations that need to test something without permanently altering the objects’ state.
-
teardown_handles( ) ¶ -
If no custom update_handles method is supplied this method is called to tear down any previous handles before replacing them.
-
traverse( fn=None , specs=None , full_breadth=True ) ¶ -
Traverses any nested DimensionedPlot returning a list of all plots that match the specs. The specs should be supplied as a list of either Plot types or callables, which should return a boolean given the plot class.
-
verbose( *args , **kwargs ) ¶ -
Inspect .param.verbose method for the full docstring
-
warning( *args , **kwargs ) ¶ -
Inspect .param.warning method for the full docstring
-
param Parameter
chart
Module
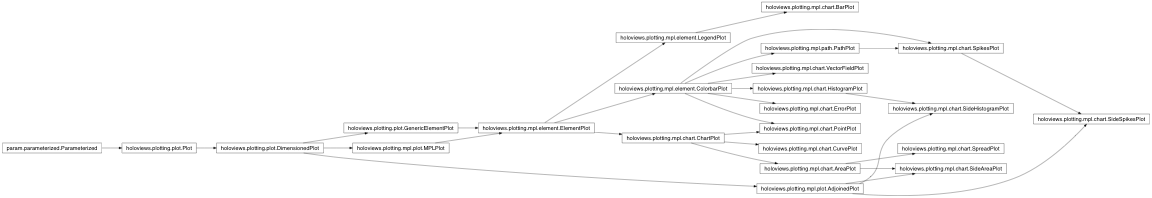
-
class
holoviews.plotting.mpl.chart.ChartPlot( element , **params ) [source] ¶ -
Bases:
holoviews.plotting.mpl.element.ElementPlotBaseclass to plot Chart elements.
-
param Parameter
fontsize( allow_None=True, constant=False, default=None, instantiate=False, pickle_default_value=True, precedence=None, readonly=False, watchers={} ) - Specifies various font sizes of the displayed text. Finer control is available by supplying a dictionary where any unmentioned keys revert to the default sizes, e.g: {‘ticks’:20, ‘title’:15, ‘ylabel’:5, ‘xlabel’:5, ‘zlabel’:5, ‘legend’:8, ‘legend_title’:13} You can set the font size of ‘zlabel’, ‘ylabel’ and ‘xlabel’ together using the ‘labels’ key.
-
param Boolean
show_title( allow_None=False, bounds=(0, 1), constant=False, default=True, instantiate=False, pickle_default_value=True, precedence=None, readonly=False, watchers={} ) - Whether to display the plot title.
-
param String
title( allow_None=False, basestring=<class ‘str’>, constant=False, default={label} {group} {dimensions}, instantiate=False, pickle_default_value=True, precedence=None, readonly=False, regex=None, watchers={} ) - The formatting string for the title of this plot, allows defining a label group separator and dimension labels.
-
param String
title_format( allow_None=True, basestring=<class ‘str’>, constant=False, default=None, instantiate=False, pickle_default_value=True, precedence=None, readonly=False, regex=None, watchers={} ) - Alias for title.
-
param Boolean
normalize( allow_None=False, bounds=(0, 1), constant=False, default=True, instantiate=False, pickle_default_value=True, precedence=None, readonly=False, watchers={} ) - Whether to compute ranges across all Elements at this level of plotting. Allows selecting normalization at different levels for nested data containers.
-
param Parameter
projection( allow_None=True, constant=False, default=None, instantiate=False, pickle_default_value=True, precedence=None, readonly=False, watchers={} ) - The projection of the plot axis, default of None is equivalent to 2D plot, ‘3d’ and ‘polar’ are also supported by matplotlib by default. May also supply a custom projection that is either a matplotlib projection type or implements the _as_mpl_axes method.
-
param Number
fig_alpha( allow_None=False, bounds=(0, 1), constant=False, default=1.0, inclusive_bounds=(True, True), instantiate=False, pickle_default_value=True, precedence=None, readonly=False, softbounds=None, time_dependent=False, time_fn=<Time Time00001>, watchers={} ) - Alpha of the overall figure background.
-
param NumericTuple
fig_bounds( allow_None=False, constant=False, default=(0.15, 0.15, 0.85, 0.85), instantiate=False, length=4, pickle_default_value=True, precedence=None, readonly=False, watchers={} ) - The bounds of the overall figure as a 4-tuple of the form (left, bottom, right, top), defining the size of the border around the subplots.
-
param Parameter
fig_inches( allow_None=False, constant=False, default=4, instantiate=False, pickle_default_value=True, precedence=None, readonly=False, watchers={} ) - The overall matplotlib figure size in inches. May be set as an integer in which case it will be used to autocompute a size. Alternatively may be set with an explicit tuple or list, in which case it will be applied directly after being scaled by fig_size. If either the width or height is set to None, it will be computed automatically.
-
param Boolean
fig_latex( allow_None=False, bounds=(0, 1), constant=False, default=False, instantiate=False, pickle_default_value=True, precedence=None, readonly=False, watchers={} ) - Whether to use LaTeX text in the overall figure.
-
param Dict
fig_rcparams( allow_None=False, constant=False, default={}, instantiate=True, is_instance=True, pickle_default_value=True, precedence=None, readonly=False, watchers={} ) - matplotlib rc parameters to apply to the overall figure.
-
param Number
fig_size( allow_None=False, bounds=(1, None), constant=False, default=100.0, inclusive_bounds=(True, True), instantiate=False, pickle_default_value=True, precedence=None, readonly=False, softbounds=None, time_dependent=False, time_fn=<Time Time00001>, watchers={} ) - Size relative to the supplied overall fig_inches in percent.
-
param HookList
initial_hooks( allow_None=False, bounds=(0, None), constant=False, default=[], instantiate=True, pickle_default_value=True, precedence=None, readonly=False, watchers={} ) - Optional list of hooks called before plotting the data onto the axis (now marked for deprecation). The hook is passed the plot object and the displayed object; other plotting handles can be accessed via plot.handles.
-
param HookList
finalize_hooks( allow_None=False, bounds=(0, None), constant=False, default=[], instantiate=True, pickle_default_value=True, precedence=None, readonly=False, watchers={} ) - Deprecated; use hooks options instead.
-
param HookList
hooks( allow_None=False, bounds=(0, None), constant=False, default=[], instantiate=True, pickle_default_value=True, precedence=None, readonly=False, watchers={} ) - Optional list of hooks called when finalizing a plot. The hook is passed the plot object and the displayed element, and other plotting handles can be accessed via plot.handles.
-
param String
sublabel_format( allow_None=True, basestring=<class ‘str’>, constant=False, default=None, instantiate=False, pickle_default_value=True, precedence=None, readonly=False, regex=None, watchers={} ) - Allows labeling the subaxes in each plot with various formatters including {Alpha}, {alpha}, {numeric} and {roman}.
-
param NumericTuple
sublabel_position( allow_None=False, constant=False, default=(-0.35, 0.85), instantiate=False, length=2, pickle_default_value=True, precedence=None, readonly=False, watchers={} ) - Position relative to the plot for placing the optional subfigure label.
-
param Number
sublabel_size( allow_None=False, bounds=None, constant=False, default=18, inclusive_bounds=(True, True), instantiate=False, pickle_default_value=True, precedence=None, readonly=False, softbounds=None, time_dependent=False, time_fn=<Time Time00001>, watchers={} ) - Size of optional subfigure label.
-
param Boolean
show_frame( allow_None=False, bounds=(0, 1), constant=False, default=False, instantiate=False, pickle_default_value=True, precedence=None, readonly=False, watchers={} ) - Whether or not to show a complete frame around the plot.
-
param Boolean
apply_ranges( allow_None=False, bounds=(0, 1), constant=False, default=True, instantiate=False, pickle_default_value=True, precedence=None, readonly=False, watchers={} ) - Whether to compute the plot bounds from the data itself.
-
param Boolean
apply_extents( allow_None=False, bounds=(0, 1), constant=False, default=True, instantiate=False, pickle_default_value=True, precedence=None, readonly=False, watchers={} ) - Whether to apply extent overrides on the Elements
-
param ClassSelector
bgcolor( allow_None=True, constant=False, default=None, instantiate=True, is_instance=True, pickle_default_value=True, precedence=None, readonly=False, watchers={} ) - If set bgcolor overrides the background color of the axis.
-
param ClassSelector
default_span( allow_None=False, constant=False, default=2.0, instantiate=True, is_instance=True, pickle_default_value=True, precedence=None, readonly=False, watchers={} ) - Defines the span of an axis if the axis range is zero, i.e. if the lower and upper end of an axis are equal or no range is defined at all. For example if there is a single datapoint at 0 a default_span of 2.0 will result in axis ranges spanning from -1 to 1.
-
param Boolean
invert_axes( allow_None=False, bounds=(0, 1), constant=False, default=False, instantiate=False, pickle_default_value=True, precedence=None, readonly=False, watchers={} ) - Whether to invert the x- and y-axis
-
param Boolean
invert_xaxis( allow_None=False, bounds=(0, 1), constant=False, default=False, instantiate=False, pickle_default_value=True, precedence=None, readonly=False, watchers={} ) - Whether to invert the plot x-axis.
-
param Boolean
invert_yaxis( allow_None=False, bounds=(0, 1), constant=False, default=False, instantiate=False, pickle_default_value=True, precedence=None, readonly=False, watchers={} ) - Whether to invert the plot y-axis.
-
param Boolean
logx( allow_None=False, bounds=(0, 1), constant=False, default=False, instantiate=False, pickle_default_value=True, precedence=None, readonly=False, watchers={} ) - Whether the x-axis of the plot will be a log axis.
-
param Boolean
logy( allow_None=False, bounds=(0, 1), constant=False, default=False, instantiate=False, pickle_default_value=True, precedence=None, readonly=False, watchers={} ) - Whether the y-axis of the plot will be a log axis.
-
param ClassSelector
padding( allow_None=False, constant=False, default=0, instantiate=True, is_instance=True, pickle_default_value=True, precedence=None, readonly=False, watchers={} ) - Fraction by which to increase auto-ranged extents to make datapoints more visible around borders. To compute padding, the axis whose screen size is largest is chosen, and the range of that axis is increased by the specified fraction along each axis. Other axes are then padded ensuring that the amount of screen space devoted to padding is equal for all axes. If specified as a tuple, the int or float values in the tuple will be used for padding in each axis, in order (x,y or x,y,z). For example, for padding=0.2 on a 800x800-pixel plot, an x-axis with the range [0,10] will be padded by 20% to be [-1,11], while a y-axis with a range [0,1000] will be padded to be [-100,1100], which should make the padding be approximately the same number of pixels. But if the same plot is changed to have a height of only 200, the y-range will then be [-400,1400] so that the y-axis padding will still match that of the x-axis. It is also possible to declare non-equal padding value for the lower and upper bound of an axis by supplying nested tuples, e.g. padding=(0.1, (0, 0.1)) will pad the x-axis lower and upper bound as well as the y-axis upper bound by a fraction of 0.1 while the y-axis lower bound is not padded at all.
-
param Boolean
show_legend( allow_None=False, bounds=(0, 1), constant=False, default=True, instantiate=False, pickle_default_value=True, precedence=None, readonly=False, watchers={} ) - Whether to show legend for the plot.
-
param Boolean
show_grid( allow_None=False, bounds=(0, 1), constant=False, default=False, instantiate=False, pickle_default_value=True, precedence=None, readonly=False, watchers={} ) - Whether to show a Cartesian grid on the plot.
-
param ObjectSelector
xaxis( allow_None=None, check_on_set=True, compute_default_fn=None, constant=False, default=bottom, instantiate=False, names=None, objects=[‘top’, ‘bottom’, ‘bare’, ‘top-bare’, ‘bottom-bare’, None, True, False], pickle_default_value=True, precedence=None, readonly=False, watchers={} ) - Whether and where to display the xaxis. The “bare” options allow suppressing all axis labels, including ticks and xlabel. Valid options are ‘top’, ‘bottom’, ‘bare’, ‘top-bare’ and ‘bottom-bare’.
-
param ObjectSelector
yaxis( allow_None=None, check_on_set=True, compute_default_fn=None, constant=False, default=left, instantiate=False, names=None, objects=[‘left’, ‘right’, ‘bare’, ‘left-bare’, ‘right-bare’, None, True, False], pickle_default_value=True, precedence=None, readonly=False, watchers={} ) - Whether and where to display the yaxis. The “bare” options allow suppressing all axis labels, including ticks and ylabel. Valid options are ‘left’, ‘right’, ‘bare’, ‘left-bare’ and ‘right-bare’.
-
param String
xlabel( allow_None=True, basestring=<class ‘str’>, constant=False, default=None, instantiate=False, pickle_default_value=True, precedence=None, readonly=False, regex=None, watchers={} ) - An explicit override of the x-axis label, if set takes precedence over the dimension label.
-
param String
ylabel( allow_None=True, basestring=<class ‘str’>, constant=False, default=None, instantiate=False, pickle_default_value=True, precedence=None, readonly=False, regex=None, watchers={} ) - An explicit override of the y-axis label, if set takes precedence over the dimension label.
-
param NumericTuple
xlim( allow_None=False, constant=False, default=(nan, nan), instantiate=False, length=2, pickle_default_value=True, precedence=None, readonly=False, watchers={} ) - User-specified x-axis range limits for the plot, as a tuple (low,high). If specified, takes precedence over data and dimension ranges.
-
param NumericTuple
ylim( allow_None=False, constant=False, default=(nan, nan), instantiate=False, length=2, pickle_default_value=True, precedence=None, readonly=False, watchers={} ) - User-specified x-axis range limits for the plot, as a tuple (low,high). If specified, takes precedence over data and dimension ranges.
-
param NumericTuple
zlim( allow_None=False, constant=False, default=(nan, nan), instantiate=False, length=2, pickle_default_value=True, precedence=None, readonly=False, watchers={} ) - User-specified z-axis range limits for the plot, as a tuple (low,high). If specified, takes precedence over data and dimension ranges.
-
param Integer
xrotation( allow_None=True, bounds=(0, 360), constant=False, default=None, inclusive_bounds=(True, True), instantiate=False, pickle_default_value=True, precedence=None, readonly=False, softbounds=None, time_dependent=False, time_fn=<Time Time00001>, watchers={} ) - Rotation angle of the xticks.
-
param Integer
yrotation( allow_None=True, bounds=(0, 360), constant=False, default=None, inclusive_bounds=(True, True), instantiate=False, pickle_default_value=True, precedence=None, readonly=False, softbounds=None, time_dependent=False, time_fn=<Time Time00001>, watchers={} ) - Rotation angle of the yticks.
-
param Parameter
xticks( allow_None=True, constant=False, default=None, instantiate=False, pickle_default_value=True, precedence=None, readonly=False, watchers={} ) - Ticks along x-axis specified as an integer, explicit list of tick locations, or bokeh Ticker object. If set to None default bokeh ticking behavior is applied.
-
param Parameter
yticks( allow_None=True, constant=False, default=None, instantiate=False, pickle_default_value=True, precedence=None, readonly=False, watchers={} ) - Ticks along y-axis specified as an integer, explicit list of tick locations, or bokeh Ticker object. If set to None default bokeh ticking behavior is applied.
-
param Boolean
apply_ticks( allow_None=False, bounds=(0, 1), constant=False, default=True, instantiate=False, pickle_default_value=True, precedence=None, readonly=False, watchers={} ) - Whether to apply custom ticks.
-
param Parameter
aspect( allow_None=False, constant=False, default=square, instantiate=False, pickle_default_value=True, precedence=None, readonly=False, watchers={} ) - The aspect ratio mode of the plot. By default, a plot may select its own appropriate aspect ratio but sometimes it may be necessary to force a square aspect ratio (e.g. to display the plot as an element of a grid). The modes ‘auto’ and ‘equal’ correspond to the axis modes of the same name in matplotlib, a numeric value may also be passed.
-
param Boolean
invert_zaxis( allow_None=False, bounds=(0, 1), constant=False, default=False, instantiate=False, pickle_default_value=True, precedence=None, readonly=False, watchers={} ) - Whether to invert the plot z-axis.
-
param List
labelled( allow_None=False, bounds=(0, None), constant=False, default=[‘x’, ‘y’], instantiate=True, pickle_default_value=True, precedence=None, readonly=False, watchers={} ) - Whether to plot the ‘x’ and ‘y’ labels.
-
param Boolean
logz( allow_None=False, bounds=(0, 1), constant=False, default=False, instantiate=False, pickle_default_value=True, precedence=None, readonly=False, watchers={} ) - Whether to apply log scaling to the y-axis of the Chart.
-
param ClassSelector
xformatter( allow_None=True, constant=False, default=None, instantiate=True, is_instance=True, pickle_default_value=True, precedence=None, readonly=False, watchers={} ) - Formatter for ticks along the x-axis.
-
param ClassSelector
yformatter( allow_None=True, constant=False, default=None, instantiate=True, is_instance=True, pickle_default_value=True, precedence=None, readonly=False, watchers={} ) - Formatter for ticks along the y-axis.
-
param ClassSelector
zformatter( allow_None=True, constant=False, default=None, instantiate=True, is_instance=True, pickle_default_value=True, precedence=None, readonly=False, watchers={} ) - Formatter for ticks along the z-axis.
-
param Boolean
zaxis( allow_None=False, bounds=(0, 1), constant=False, default=True, instantiate=False, pickle_default_value=True, precedence=None, readonly=False, watchers={} ) - Whether to display the z-axis.
-
param String
zlabel( allow_None=True, basestring=<class ‘str’>, constant=False, default=None, instantiate=False, pickle_default_value=True, precedence=None, readonly=False, regex=None, watchers={} ) - An explicit override of the z-axis label, if set takes precedence over the dimension label.
-
param Integer
zrotation( allow_None=False, bounds=(0, 360), constant=False, default=0, inclusive_bounds=(True, True), instantiate=False, pickle_default_value=True, precedence=None, readonly=False, softbounds=None, time_dependent=False, time_fn=<Time Time00001>, watchers={} ) - Rotation angle of the zticks.
-
param Parameter
zticks( allow_None=True, constant=False, default=None, instantiate=False, pickle_default_value=True, precedence=None, readonly=False, watchers={} ) - Ticks along z-axis specified as an integer, explicit list of tick locations, list of tuples containing the locations and labels or a matplotlib tick locator object. If set to None default matplotlib ticking behavior is applied.
-
anim( start=0 , stop=None , fps=30 ) ¶ -
Method to return a matplotlib animation. The start and stop frames may be specified as well as the fps.
-
cleanup( ) ¶ -
Cleans up references to the plot on the attached Stream subscribers.
-
compute_ranges( obj , key , ranges ) ¶ -
Given an object, a specific key, and the normalization options, this method will find the specified normalization options on the appropriate OptionTree, group the elements according to the selected normalization option (i.e. either per frame or over the whole animation) and finally compute the dimension ranges in each group. The new set of ranges is returned.
-
debug( *args , **kwargs ) ¶ -
Inspect .param.debug method for the full docstring
-
defaults( *args , **kwargs ) ¶ -
Inspect .param.defaults method for the full docstring
-
force_new_dynamic_value= functools.partial(<function Parameters.deprecate.<locals>.inner>, <class 'holoviews.plotting.mpl.chart.ChartPlot'>) 
-
get_aspect( xspan , yspan ) ¶ -
Computes the aspect ratio of the plot
-
get_extents( element , ranges , range_type='combined' , xdim=None , ydim=None , zdim=None ) ¶ -
Gets the extents for the axes from the current Element. The globally computed ranges can optionally override the extents.
The extents are computed by combining the data ranges, extents and dimension ranges. Each of these can be obtained individually by setting the range_type to one of:
- ‘data’: Just the data ranges
- ‘extents’: Element.extents
- ‘soft’: Dimension.soft_range values
- ‘hard’: Dimension.range values
To obtain the combined range, which includes range padding the default may be used:
- ‘combined’: All the range types combined and padding applied
This allows Overlay plots to obtain each range and combine them appropriately for all the objects in the overlay.
-
get_padding( extents ) ¶ -
Computes padding along the axes taking into account the plot aspect.
-
get_param_values= functools.partial(<function Parameters.deprecate.<locals>.inner>, <class 'holoviews.plotting.mpl.chart.ChartPlot'>) 
-
get_value_generator= functools.partial(<function Parameters.deprecate.<locals>.inner>, <class 'holoviews.plotting.mpl.chart.ChartPlot'>) 
-
get_zorder( overlay , key , el ) ¶ -
Computes the z-order of element in the NdOverlay taking into account possible batching of elements.
-
init_artists( ax , plot_args , plot_kwargs ) ¶ -
Initializes the artist based on the plot method declared on the plot.
-
init_comm( ) ¶ -
Initializes comm and attaches streams.
-
inspect_value= functools.partial(<function Parameters.deprecate.<locals>.inner>, <class 'holoviews.plotting.mpl.chart.ChartPlot'>) 
-
matches( spec ) ¶ -
Matches a specification against the current Plot.
-
message( *args , **kwargs ) ¶ -
Inspect .param.message method for the full docstring
-
params( *args , **kwargs ) ¶ -
Inspect .param.params method for the full docstring
-
pprint( imports=None , prefix=' ' , unknown_value='<?>' , qualify=False , separator='' ) ¶ -
(Experimental) Pretty printed representation that may be evaluated with eval. See pprint() function for more details.
-
print_param_defaults( *args , **kwargs ) ¶ -
Inspect .param.print_param_defaults method for the full docstring
-
print_param_values( *args , **kwargs ) ¶ -
Inspect .param.print_param_values method for the full docstring
-
push( ) ¶ -
Pushes updated plot data via the Comm.
-
refresh( **kwargs ) ¶ -
Refreshes the plot by rerendering it and then pushing the updated data if the plot has an associated Comm.
-
script_repr( imports=[] , prefix=' ' ) ¶ -
Variant of __repr__ designed for generating a runnable script.
-
set_default( *args , **kwargs ) ¶ -
Inspect .param.set_default method for the full docstring
-
set_dynamic_time_fn= functools.partial(<function Parameters.deprecate.<locals>.inner>, <class 'holoviews.plotting.mpl.chart.ChartPlot'>) 
-
set_param= functools.partial(<function Parameters.deprecate.<locals>.inner>, <class 'holoviews.plotting.mpl.chart.ChartPlot'>) 
-
state_pop( ) ¶ -
Restore the most recently saved state.
See state_push() for more details.
-
state_push( ) ¶ -
Save this instance’s state.
For Parameterized instances, this includes the state of dynamically generated values.
Subclasses that maintain short-term state should additionally save and restore that state using state_push() and state_pop().
Generally, this method is used by operations that need to test something without permanently altering the objects’ state.
-
teardown_handles( ) ¶ -
If no custom update_handles method is supplied this method is called to tear down any previous handles before replacing them.
-
traverse( fn=None , specs=None , full_breadth=True ) ¶ -
Traverses any nested DimensionedPlot returning a list of all plots that match the specs. The specs should be supplied as a list of either Plot types or callables, which should return a boolean given the plot class.
-
update_handles( key , axis , element , ranges , style ) ¶ -
Update the elements of the plot.
-
verbose( *args , **kwargs ) ¶ -
Inspect .param.verbose method for the full docstring
-
warning( *args , **kwargs ) ¶ -
Inspect .param.warning method for the full docstring
-
param Parameter
-
class
holoviews.plotting.mpl.chart.CurvePlot( element , **params ) [source] ¶ -
Bases:
holoviews.plotting.mpl.chart.ChartPlotCurvePlot can plot Curve and ViewMaps of Curve, which can be displayed as a single frame or animation. Axes, titles and legends are automatically generated from dim_info.
If the dimension is set to cyclic in the dim_info it will rotate the curve so that minimum y values are at the minimum x value to make the plots easier to interpret.
-
param Parameter
fontsize( allow_None=True, constant=False, default=None, instantiate=False, pickle_default_value=True, precedence=None, readonly=False, watchers={} ) - Specifies various font sizes of the displayed text. Finer control is available by supplying a dictionary where any unmentioned keys revert to the default sizes, e.g: {‘ticks’:20, ‘title’:15, ‘ylabel’:5, ‘xlabel’:5, ‘zlabel’:5, ‘legend’:8, ‘legend_title’:13} You can set the font size of ‘zlabel’, ‘ylabel’ and ‘xlabel’ together using the ‘labels’ key.
-
param Boolean
show_title( allow_None=False, bounds=(0, 1), constant=False, default=True, instantiate=False, pickle_default_value=True, precedence=None, readonly=False, watchers={} ) - Whether to display the plot title.
-
param String
title( allow_None=False, basestring=<class ‘str’>, constant=False, default={label} {group} {dimensions}, instantiate=False, pickle_default_value=True, precedence=None, readonly=False, regex=None, watchers={} ) - The formatting string for the title of this plot, allows defining a label group separator and dimension labels.
-
param String
title_format( allow_None=True, basestring=<class ‘str’>, constant=False, default=None, instantiate=False, pickle_default_value=True, precedence=None, readonly=False, regex=None, watchers={} ) - Alias for title.
-
param Boolean
normalize( allow_None=False, bounds=(0, 1), constant=False, default=True, instantiate=False, pickle_default_value=True, precedence=None, readonly=False, watchers={} ) - Whether to compute ranges across all Elements at this level of plotting. Allows selecting normalization at different levels for nested data containers.
-
param Parameter
projection( allow_None=True, constant=False, default=None, instantiate=False, pickle_default_value=True, precedence=None, readonly=False, watchers={} ) - The projection of the plot axis, default of None is equivalent to 2D plot, ‘3d’ and ‘polar’ are also supported by matplotlib by default. May also supply a custom projection that is either a matplotlib projection type or implements the _as_mpl_axes method.
-
param Number
fig_alpha( allow_None=False, bounds=(0, 1), constant=False, default=1.0, inclusive_bounds=(True, True), instantiate=False, pickle_default_value=True, precedence=None, readonly=False, softbounds=None, time_dependent=False, time_fn=<Time Time00001>, watchers={} ) - Alpha of the overall figure background.
-
param NumericTuple
fig_bounds( allow_None=False, constant=False, default=(0.15, 0.15, 0.85, 0.85), instantiate=False, length=4, pickle_default_value=True, precedence=None, readonly=False, watchers={} ) - The bounds of the overall figure as a 4-tuple of the form (left, bottom, right, top), defining the size of the border around the subplots.
-
param Parameter
fig_inches( allow_None=False, constant=False, default=4, instantiate=False, pickle_default_value=True, precedence=None, readonly=False, watchers={} ) - The overall matplotlib figure size in inches. May be set as an integer in which case it will be used to autocompute a size. Alternatively may be set with an explicit tuple or list, in which case it will be applied directly after being scaled by fig_size. If either the width or height is set to None, it will be computed automatically.
-
param Boolean
fig_latex( allow_None=False, bounds=(0, 1), constant=False, default=False, instantiate=False, pickle_default_value=True, precedence=None, readonly=False, watchers={} ) - Whether to use LaTeX text in the overall figure.
-
param Dict
fig_rcparams( allow_None=False, constant=False, default={}, instantiate=True, is_instance=True, pickle_default_value=True, precedence=None, readonly=False, watchers={} ) - matplotlib rc parameters to apply to the overall figure.
-
param Number
fig_size( allow_None=False, bounds=(1, None), constant=False, default=100.0, inclusive_bounds=(True, True), instantiate=False, pickle_default_value=True, precedence=None, readonly=False, softbounds=None, time_dependent=False, time_fn=<Time Time00001>, watchers={} ) - Size relative to the supplied overall fig_inches in percent.
-
param HookList
initial_hooks( allow_None=False, bounds=(0, None), constant=False, default=[], instantiate=True, pickle_default_value=True, precedence=None, readonly=False, watchers={} ) - Optional list of hooks called before plotting the data onto the axis (now marked for deprecation). The hook is passed the plot object and the displayed object; other plotting handles can be accessed via plot.handles.
-
param HookList
finalize_hooks( allow_None=False, bounds=(0, None), constant=False, default=[], instantiate=True, pickle_default_value=True, precedence=None, readonly=False, watchers={} ) - Deprecated; use hooks options instead.
-
param HookList
hooks( allow_None=False, bounds=(0, None), constant=False, default=[], instantiate=True, pickle_default_value=True, precedence=None, readonly=False, watchers={} ) - Optional list of hooks called when finalizing a plot. The hook is passed the plot object and the displayed element, and other plotting handles can be accessed via plot.handles.
-
param String
sublabel_format( allow_None=True, basestring=<class ‘str’>, constant=False, default=None, instantiate=False, pickle_default_value=True, precedence=None, readonly=False, regex=None, watchers={} ) - Allows labeling the subaxes in each plot with various formatters including {Alpha}, {alpha}, {numeric} and {roman}.
-
param NumericTuple
sublabel_position( allow_None=False, constant=False, default=(-0.35, 0.85), instantiate=False, length=2, pickle_default_value=True, precedence=None, readonly=False, watchers={} ) - Position relative to the plot for placing the optional subfigure label.
-
param Number
sublabel_size( allow_None=False, bounds=None, constant=False, default=18, inclusive_bounds=(True, True), instantiate=False, pickle_default_value=True, precedence=None, readonly=False, softbounds=None, time_dependent=False, time_fn=<Time Time00001>, watchers={} ) - Size of optional subfigure label.
-
param Boolean
show_frame( allow_None=False, bounds=(0, 1), constant=False, default=False, instantiate=False, pickle_default_value=True, precedence=None, readonly=False, watchers={} ) - Whether or not to show a complete frame around the plot.
-
param Boolean
apply_ranges( allow_None=False, bounds=(0, 1), constant=False, default=True, instantiate=False, pickle_default_value=True, precedence=None, readonly=False, watchers={} ) - Whether to compute the plot bounds from the data itself.
-
param Boolean
apply_extents( allow_None=False, bounds=(0, 1), constant=False, default=True, instantiate=False, pickle_default_value=True, precedence=None, readonly=False, watchers={} ) - Whether to apply extent overrides on the Elements
-
param ClassSelector
bgcolor( allow_None=True, constant=False, default=None, instantiate=True, is_instance=True, pickle_default_value=True, precedence=None, readonly=False, watchers={} ) - If set bgcolor overrides the background color of the axis.
-
param ClassSelector
default_span( allow_None=False, constant=False, default=2.0, instantiate=True, is_instance=True, pickle_default_value=True, precedence=None, readonly=False, watchers={} ) - Defines the span of an axis if the axis range is zero, i.e. if the lower and upper end of an axis are equal or no range is defined at all. For example if there is a single datapoint at 0 a default_span of 2.0 will result in axis ranges spanning from -1 to 1.
-
param Boolean
invert_axes( allow_None=False, bounds=(0, 1), constant=False, default=False, instantiate=False, pickle_default_value=True, precedence=None, readonly=False, watchers={} ) - Whether to invert the x- and y-axis
-
param Boolean
invert_xaxis( allow_None=False, bounds=(0, 1), constant=False, default=False, instantiate=False, pickle_default_value=True, precedence=None, readonly=False, watchers={} ) - Whether to invert the plot x-axis.
-
param Boolean
invert_yaxis( allow_None=False, bounds=(0, 1), constant=False, default=False, instantiate=False, pickle_default_value=True, precedence=None, readonly=False, watchers={} ) - Whether to invert the plot y-axis.
-
param Boolean
logx( allow_None=False, bounds=(0, 1), constant=False, default=False, instantiate=False, pickle_default_value=True, precedence=None, readonly=False, watchers={} ) - Whether the x-axis of the plot will be a log axis.
-
param Boolean
logy( allow_None=False, bounds=(0, 1), constant=False, default=False, instantiate=False, pickle_default_value=True, precedence=None, readonly=False, watchers={} ) - Whether the y-axis of the plot will be a log axis.
-
param ClassSelector
padding( allow_None=False, constant=False, default=0, instantiate=True, is_instance=True, pickle_default_value=True, precedence=None, readonly=False, watchers={} ) - Fraction by which to increase auto-ranged extents to make datapoints more visible around borders. To compute padding, the axis whose screen size is largest is chosen, and the range of that axis is increased by the specified fraction along each axis. Other axes are then padded ensuring that the amount of screen space devoted to padding is equal for all axes. If specified as a tuple, the int or float values in the tuple will be used for padding in each axis, in order (x,y or x,y,z). For example, for padding=0.2 on a 800x800-pixel plot, an x-axis with the range [0,10] will be padded by 20% to be [-1,11], while a y-axis with a range [0,1000] will be padded to be [-100,1100], which should make the padding be approximately the same number of pixels. But if the same plot is changed to have a height of only 200, the y-range will then be [-400,1400] so that the y-axis padding will still match that of the x-axis. It is also possible to declare non-equal padding value for the lower and upper bound of an axis by supplying nested tuples, e.g. padding=(0.1, (0, 0.1)) will pad the x-axis lower and upper bound as well as the y-axis upper bound by a fraction of 0.1 while the y-axis lower bound is not padded at all.
-
param Boolean
show_legend( allow_None=False, bounds=(0, 1), constant=False, default=True, instantiate=False, pickle_default_value=True, precedence=None, readonly=False, watchers={} ) - Whether to show legend for the plot.
-
param Boolean
show_grid( allow_None=False, bounds=(0, 1), constant=False, default=False, instantiate=False, pickle_default_value=True, precedence=None, readonly=False, watchers={} ) - Enable axis grid.
-
param ObjectSelector
xaxis( allow_None=None, check_on_set=True, compute_default_fn=None, constant=False, default=bottom, instantiate=False, names=None, objects=[‘top’, ‘bottom’, ‘bare’, ‘top-bare’, ‘bottom-bare’, None, True, False], pickle_default_value=True, precedence=None, readonly=False, watchers={} ) - Whether and where to display the xaxis. The “bare” options allow suppressing all axis labels, including ticks and xlabel. Valid options are ‘top’, ‘bottom’, ‘bare’, ‘top-bare’ and ‘bottom-bare’.
-
param ObjectSelector
yaxis( allow_None=None, check_on_set=True, compute_default_fn=None, constant=False, default=left, instantiate=False, names=None, objects=[‘left’, ‘right’, ‘bare’, ‘left-bare’, ‘right-bare’, None, True, False], pickle_default_value=True, precedence=None, readonly=False, watchers={} ) - Whether and where to display the yaxis. The “bare” options allow suppressing all axis labels, including ticks and ylabel. Valid options are ‘left’, ‘right’, ‘bare’, ‘left-bare’ and ‘right-bare’.
-
param String
xlabel( allow_None=True, basestring=<class ‘str’>, constant=False, default=None, instantiate=False, pickle_default_value=True, precedence=None, readonly=False, regex=None, watchers={} ) - An explicit override of the x-axis label, if set takes precedence over the dimension label.
-
param String
ylabel( allow_None=True, basestring=<class ‘str’>, constant=False, default=None, instantiate=False, pickle_default_value=True, precedence=None, readonly=False, regex=None, watchers={} ) - An explicit override of the y-axis label, if set takes precedence over the dimension label.
-
param NumericTuple
xlim( allow_None=False, constant=False, default=(nan, nan), instantiate=False, length=2, pickle_default_value=True, precedence=None, readonly=False, watchers={} ) - User-specified x-axis range limits for the plot, as a tuple (low,high). If specified, takes precedence over data and dimension ranges.
-
param NumericTuple
ylim( allow_None=False, constant=False, default=(nan, nan), instantiate=False, length=2, pickle_default_value=True, precedence=None, readonly=False, watchers={} ) - User-specified x-axis range limits for the plot, as a tuple (low,high). If specified, takes precedence over data and dimension ranges.
-
param NumericTuple
zlim( allow_None=False, constant=False, default=(nan, nan), instantiate=False, length=2, pickle_default_value=True, precedence=None, readonly=False, watchers={} ) - User-specified z-axis range limits for the plot, as a tuple (low,high). If specified, takes precedence over data and dimension ranges.
-
param Integer
xrotation( allow_None=True, bounds=(0, 360), constant=False, default=None, inclusive_bounds=(True, True), instantiate=False, pickle_default_value=True, precedence=None, readonly=False, softbounds=None, time_dependent=False, time_fn=<Time Time00001>, watchers={} ) - Rotation angle of the xticks.
-
param Integer
yrotation( allow_None=True, bounds=(0, 360), constant=False, default=None, inclusive_bounds=(True, True), instantiate=False, pickle_default_value=True, precedence=None, readonly=False, softbounds=None, time_dependent=False, time_fn=<Time Time00001>, watchers={} ) - Rotation angle of the yticks.
-
param Parameter
xticks( allow_None=True, constant=False, default=None, instantiate=False, pickle_default_value=True, precedence=None, readonly=False, watchers={} ) - Ticks along x-axis specified as an integer, explicit list of tick locations, or bokeh Ticker object. If set to None default bokeh ticking behavior is applied.
-
param Parameter
yticks( allow_None=True, constant=False, default=None, instantiate=False, pickle_default_value=True, precedence=None, readonly=False, watchers={} ) - Ticks along y-axis specified as an integer, explicit list of tick locations, or bokeh Ticker object. If set to None default bokeh ticking behavior is applied.
-
param Boolean
apply_ticks( allow_None=False, bounds=(0, 1), constant=False, default=True, instantiate=False, pickle_default_value=True, precedence=None, readonly=False, watchers={} ) - Whether to apply custom ticks.
-
param Parameter
aspect( allow_None=False, constant=False, default=square, instantiate=False, pickle_default_value=True, precedence=None, readonly=False, watchers={} ) - The aspect ratio mode of the plot. By default, a plot may select its own appropriate aspect ratio but sometimes it may be necessary to force a square aspect ratio (e.g. to display the plot as an element of a grid). The modes ‘auto’ and ‘equal’ correspond to the axis modes of the same name in matplotlib, a numeric value may also be passed.
-
param Boolean
invert_zaxis( allow_None=False, bounds=(0, 1), constant=False, default=False, instantiate=False, pickle_default_value=True, precedence=None, readonly=False, watchers={} ) - Whether to invert the plot z-axis.
-
param List
labelled( allow_None=False, bounds=(0, None), constant=False, default=[‘x’, ‘y’], instantiate=True, pickle_default_value=True, precedence=None, readonly=False, watchers={} ) - Whether to plot the ‘x’ and ‘y’ labels.
-
param Boolean
logz( allow_None=False, bounds=(0, 1), constant=False, default=False, instantiate=False, pickle_default_value=True, precedence=None, readonly=False, watchers={} ) - Whether to apply log scaling to the y-axis of the Chart.
-
param ClassSelector
xformatter( allow_None=True, constant=False, default=None, instantiate=True, is_instance=True, pickle_default_value=True, precedence=None, readonly=False, watchers={} ) - Formatter for ticks along the x-axis.
-
param ClassSelector
yformatter( allow_None=True, constant=False, default=None, instantiate=True, is_instance=True, pickle_default_value=True, precedence=None, readonly=False, watchers={} ) - Formatter for ticks along the y-axis.
-
param ClassSelector
zformatter( allow_None=True, constant=False, default=None, instantiate=True, is_instance=True, pickle_default_value=True, precedence=None, readonly=False, watchers={} ) - Formatter for ticks along the z-axis.
-
param Boolean
zaxis( allow_None=False, bounds=(0, 1), constant=False, default=True, instantiate=False, pickle_default_value=True, precedence=None, readonly=False, watchers={} ) - Whether to display the z-axis.
-
param String
zlabel( allow_None=True, basestring=<class ‘str’>, constant=False, default=None, instantiate=False, pickle_default_value=True, precedence=None, readonly=False, regex=None, watchers={} ) - An explicit override of the z-axis label, if set takes precedence over the dimension label.
-
param Integer
zrotation( allow_None=False, bounds=(0, 360), constant=False, default=0, inclusive_bounds=(True, True), instantiate=False, pickle_default_value=True, precedence=None, readonly=False, softbounds=None, time_dependent=False, time_fn=<Time Time00001>, watchers={} ) - Rotation angle of the zticks.
-
param Parameter
zticks( allow_None=True, constant=False, default=None, instantiate=False, pickle_default_value=True, precedence=None, readonly=False, watchers={} ) - Ticks along z-axis specified as an integer, explicit list of tick locations, list of tuples containing the locations and labels or a matplotlib tick locator object. If set to None default matplotlib ticking behavior is applied.
-
param Boolean
autotick( allow_None=False, bounds=(0, 1), constant=False, default=False, instantiate=False, pickle_default_value=True, precedence=None, readonly=False, watchers={} ) - Whether to let matplotlib automatically compute tick marks or to allow the user to control tick marks.
-
param ObjectSelector
interpolation( allow_None=None, check_on_set=True, compute_default_fn=None, constant=False, default=linear, instantiate=False, names=None, objects=[‘linear’, ‘steps-mid’, ‘steps-pre’, ‘steps-post’], pickle_default_value=True, precedence=None, readonly=False, watchers={} ) - Defines how the samples of the Curve are interpolated, default is ‘linear’, other options include ‘steps-mid’, ‘steps-pre’ and ‘steps-post’.
-
param Boolean
relative_labels( allow_None=False, bounds=(0, 1), constant=False, default=False, instantiate=False, pickle_default_value=True, precedence=None, readonly=False, watchers={} ) - If plotted quantity is cyclic and center_cyclic is enabled, will compute tick labels relative to the center.
-
anim( start=0 , stop=None , fps=30 ) ¶ -
Method to return a matplotlib animation. The start and stop frames may be specified as well as the fps.
-
cleanup( ) ¶ -
Cleans up references to the plot on the attached Stream subscribers.
-
compute_ranges( obj , key , ranges ) ¶ -
Given an object, a specific key, and the normalization options, this method will find the specified normalization options on the appropriate OptionTree, group the elements according to the selected normalization option (i.e. either per frame or over the whole animation) and finally compute the dimension ranges in each group. The new set of ranges is returned.
-
debug( *args , **kwargs ) ¶ -
Inspect .param.debug method for the full docstring
-
defaults( *args , **kwargs ) ¶ -
Inspect .param.defaults method for the full docstring
-
force_new_dynamic_value= functools.partial(<function Parameters.deprecate.<locals>.inner>, <class 'holoviews.plotting.mpl.chart.CurvePlot'>) 
-
get_aspect( xspan , yspan ) ¶ -
Computes the aspect ratio of the plot
-
get_extents( element , ranges , range_type='combined' , xdim=None , ydim=None , zdim=None ) ¶ -
Gets the extents for the axes from the current Element. The globally computed ranges can optionally override the extents.
The extents are computed by combining the data ranges, extents and dimension ranges. Each of these can be obtained individually by setting the range_type to one of:
- ‘data’: Just the data ranges
- ‘extents’: Element.extents
- ‘soft’: Dimension.soft_range values
- ‘hard’: Dimension.range values
To obtain the combined range, which includes range padding the default may be used:
- ‘combined’: All the range types combined and padding applied
This allows Overlay plots to obtain each range and combine them appropriately for all the objects in the overlay.
-
get_padding( extents ) ¶ -
Computes padding along the axes taking into account the plot aspect.
-
get_param_values= functools.partial(<function Parameters.deprecate.<locals>.inner>, <class 'holoviews.plotting.mpl.chart.CurvePlot'>) 
-
get_value_generator= functools.partial(<function Parameters.deprecate.<locals>.inner>, <class 'holoviews.plotting.mpl.chart.CurvePlot'>) 
-
get_zorder( overlay , key , el ) ¶ -
Computes the z-order of element in the NdOverlay taking into account possible batching of elements.
-
init_comm( ) ¶ -
Initializes comm and attaches streams.
-
inspect_value= functools.partial(<function Parameters.deprecate.<locals>.inner>, <class 'holoviews.plotting.mpl.chart.CurvePlot'>) 
-
matches( spec ) ¶ -
Matches a specification against the current Plot.
-
message( *args , **kwargs ) ¶ -
Inspect .param.message method for the full docstring
-
params( *args , **kwargs ) ¶ -
Inspect .param.params method for the full docstring
-
pprint( imports=None , prefix=' ' , unknown_value='<?>' , qualify=False , separator='' ) ¶ -
(Experimental) Pretty printed representation that may be evaluated with eval. See pprint() function for more details.
-
print_param_defaults( *args , **kwargs ) ¶ -
Inspect .param.print_param_defaults method for the full docstring
-
print_param_values( *args , **kwargs ) ¶ -
Inspect .param.print_param_values method for the full docstring
-
push( ) ¶ -
Pushes updated plot data via the Comm.
-
refresh( **kwargs ) ¶ -
Refreshes the plot by rerendering it and then pushing the updated data if the plot has an associated Comm.
-
script_repr( imports=[] , prefix=' ' ) ¶ -
Variant of __repr__ designed for generating a runnable script.
-
set_default( *args , **kwargs ) ¶ -
Inspect .param.set_default method for the full docstring
-
set_dynamic_time_fn= functools.partial(<function Parameters.deprecate.<locals>.inner>, <class 'holoviews.plotting.mpl.chart.CurvePlot'>) 
-
set_param= functools.partial(<function Parameters.deprecate.<locals>.inner>, <class 'holoviews.plotting.mpl.chart.CurvePlot'>) 
-
state_pop( ) ¶ -
Restore the most recently saved state.
See state_push() for more details.
-
state_push( ) ¶ -
Save this instance’s state.
For Parameterized instances, this includes the state of dynamically generated values.
Subclasses that maintain short-term state should additionally save and restore that state using state_push() and state_pop().
Generally, this method is used by operations that need to test something without permanently altering the objects’ state.
-
teardown_handles( ) ¶ -
If no custom update_handles method is supplied this method is called to tear down any previous handles before replacing them.
-
traverse( fn=None , specs=None , full_breadth=True ) ¶ -
Traverses any nested DimensionedPlot returning a list of all plots that match the specs. The specs should be supplied as a list of either Plot types or callables, which should return a boolean given the plot class.
-
verbose( *args , **kwargs ) ¶ -
Inspect .param.verbose method for the full docstring
-
warning( *args , **kwargs ) ¶ -
Inspect .param.warning method for the full docstring
-
param Parameter
-
class
holoviews.plotting.mpl.chart.ErrorPlot( *args , **kwargs ) [source] ¶ -
Bases:
holoviews.plotting.mpl.element.ColorbarPlotErrorPlot plots the ErrorBar Element type and supporting both horizontal and vertical error bars via the ‘horizontal’ plot option.
-
param Parameter
fontsize( allow_None=True, constant=False, default=None, instantiate=False, pickle_default_value=True, precedence=None, readonly=False, watchers={} ) - Specifies various font sizes of the displayed text. Finer control is available by supplying a dictionary where any unmentioned keys revert to the default sizes, e.g: {‘ticks’:20, ‘title’:15, ‘ylabel’:5, ‘xlabel’:5, ‘zlabel’:5, ‘legend’:8, ‘legend_title’:13} You can set the font size of ‘zlabel’, ‘ylabel’ and ‘xlabel’ together using the ‘labels’ key.
-
param Boolean
show_title( allow_None=False, bounds=(0, 1), constant=False, default=True, instantiate=False, pickle_default_value=True, precedence=None, readonly=False, watchers={} ) - Whether to display the plot title.
-
param String
title( allow_None=False, basestring=<class ‘str’>, constant=False, default={label} {group} {dimensions}, instantiate=False, pickle_default_value=True, precedence=None, readonly=False, regex=None, watchers={} ) - The formatting string for the title of this plot, allows defining a label group separator and dimension labels.
-
param String
title_format( allow_None=True, basestring=<class ‘str’>, constant=False, default=None, instantiate=False, pickle_default_value=True, precedence=None, readonly=False, regex=None, watchers={} ) - Alias for title.
-
param Boolean
normalize( allow_None=False, bounds=(0, 1), constant=False, default=True, instantiate=False, pickle_default_value=True, precedence=None, readonly=False, watchers={} ) - Whether to compute ranges across all Elements at this level of plotting. Allows selecting normalization at different levels for nested data containers.
-
param Parameter
projection( allow_None=True, constant=False, default=None, instantiate=False, pickle_default_value=True, precedence=None, readonly=False, watchers={} ) - The projection of the plot axis, default of None is equivalent to 2D plot, ‘3d’ and ‘polar’ are also supported by matplotlib by default. May also supply a custom projection that is either a matplotlib projection type or implements the _as_mpl_axes method.
-
param Number
fig_alpha( allow_None=False, bounds=(0, 1), constant=False, default=1.0, inclusive_bounds=(True, True), instantiate=False, pickle_default_value=True, precedence=None, readonly=False, softbounds=None, time_dependent=False, time_fn=<Time Time00001>, watchers={} ) - Alpha of the overall figure background.
-
param NumericTuple
fig_bounds( allow_None=False, constant=False, default=(0.15, 0.15, 0.85, 0.85), instantiate=False, length=4, pickle_default_value=True, precedence=None, readonly=False, watchers={} ) - The bounds of the overall figure as a 4-tuple of the form (left, bottom, right, top), defining the size of the border around the subplots.
-
param Parameter
fig_inches( allow_None=False, constant=False, default=4, instantiate=False, pickle_default_value=True, precedence=None, readonly=False, watchers={} ) - The overall matplotlib figure size in inches. May be set as an integer in which case it will be used to autocompute a size. Alternatively may be set with an explicit tuple or list, in which case it will be applied directly after being scaled by fig_size. If either the width or height is set to None, it will be computed automatically.
-
param Boolean
fig_latex( allow_None=False, bounds=(0, 1), constant=False, default=False, instantiate=False, pickle_default_value=True, precedence=None, readonly=False, watchers={} ) - Whether to use LaTeX text in the overall figure.
-
param Dict
fig_rcparams( allow_None=False, constant=False, default={}, instantiate=True, is_instance=True, pickle_default_value=True, precedence=None, readonly=False, watchers={} ) - matplotlib rc parameters to apply to the overall figure.
-
param Number
fig_size( allow_None=False, bounds=(1, None), constant=False, default=100.0, inclusive_bounds=(True, True), instantiate=False, pickle_default_value=True, precedence=None, readonly=False, softbounds=None, time_dependent=False, time_fn=<Time Time00001>, watchers={} ) - Size relative to the supplied overall fig_inches in percent.
-
param HookList
initial_hooks( allow_None=False, bounds=(0, None), constant=False, default=[], instantiate=True, pickle_default_value=True, precedence=None, readonly=False, watchers={} ) - Optional list of hooks called before plotting the data onto the axis (now marked for deprecation). The hook is passed the plot object and the displayed object; other plotting handles can be accessed via plot.handles.
-
param HookList
finalize_hooks( allow_None=False, bounds=(0, None), constant=False, default=[], instantiate=True, pickle_default_value=True, precedence=None, readonly=False, watchers={} ) - Deprecated; use hooks options instead.
-
param HookList
hooks( allow_None=False, bounds=(0, None), constant=False, default=[], instantiate=True, pickle_default_value=True, precedence=None, readonly=False, watchers={} ) - Optional list of hooks called when finalizing a plot. The hook is passed the plot object and the displayed element, and other plotting handles can be accessed via plot.handles.
-
param String
sublabel_format( allow_None=True, basestring=<class ‘str’>, constant=False, default=None, instantiate=False, pickle_default_value=True, precedence=None, readonly=False, regex=None, watchers={} ) - Allows labeling the subaxes in each plot with various formatters including {Alpha}, {alpha}, {numeric} and {roman}.
-
param NumericTuple
sublabel_position( allow_None=False, constant=False, default=(-0.35, 0.85), instantiate=False, length=2, pickle_default_value=True, precedence=None, readonly=False, watchers={} ) - Position relative to the plot for placing the optional subfigure label.
-
param Number
sublabel_size( allow_None=False, bounds=None, constant=False, default=18, inclusive_bounds=(True, True), instantiate=False, pickle_default_value=True, precedence=None, readonly=False, softbounds=None, time_dependent=False, time_fn=<Time Time00001>, watchers={} ) - Size of optional subfigure label.
-
param Boolean
show_frame( allow_None=False, bounds=(0, 1), constant=False, default=False, instantiate=False, pickle_default_value=True, precedence=None, readonly=False, watchers={} ) - Whether or not to show a complete frame around the plot.
-
param Boolean
apply_ranges( allow_None=False, bounds=(0, 1), constant=False, default=True, instantiate=False, pickle_default_value=True, precedence=None, readonly=False, watchers={} ) - Whether to compute the plot bounds from the data itself.
-
param Boolean
apply_extents( allow_None=False, bounds=(0, 1), constant=False, default=True, instantiate=False, pickle_default_value=True, precedence=None, readonly=False, watchers={} ) - Whether to apply extent overrides on the Elements
-
param ClassSelector
bgcolor( allow_None=True, constant=False, default=None, instantiate=True, is_instance=True, pickle_default_value=True, precedence=None, readonly=False, watchers={} ) - If set bgcolor overrides the background color of the axis.
-
param ClassSelector
default_span( allow_None=False, constant=False, default=2.0, instantiate=True, is_instance=True, pickle_default_value=True, precedence=None, readonly=False, watchers={} ) - Defines the span of an axis if the axis range is zero, i.e. if the lower and upper end of an axis are equal or no range is defined at all. For example if there is a single datapoint at 0 a default_span of 2.0 will result in axis ranges spanning from -1 to 1.
-
param Boolean
invert_axes( allow_None=False, bounds=(0, 1), constant=False, default=False, instantiate=False, pickle_default_value=True, precedence=None, readonly=False, watchers={} ) - Whether to invert the x- and y-axis
-
param Boolean
invert_xaxis( allow_None=False, bounds=(0, 1), constant=False, default=False, instantiate=False, pickle_default_value=True, precedence=None, readonly=False, watchers={} ) - Whether to invert the plot x-axis.
-
param Boolean
invert_yaxis( allow_None=False, bounds=(0, 1), constant=False, default=False, instantiate=False, pickle_default_value=True, precedence=None, readonly=False, watchers={} ) - Whether to invert the plot y-axis.
-
param Boolean
logx( allow_None=False, bounds=(0, 1), constant=False, default=False, instantiate=False, pickle_default_value=True, precedence=None, readonly=False, watchers={} ) - Whether the x-axis of the plot will be a log axis.
-
param Boolean
logy( allow_None=False, bounds=(0, 1), constant=False, default=False, instantiate=False, pickle_default_value=True, precedence=None, readonly=False, watchers={} ) - Whether the y-axis of the plot will be a log axis.
-
param ClassSelector
padding( allow_None=False, constant=False, default=0, instantiate=True, is_instance=True, pickle_default_value=True, precedence=None, readonly=False, watchers={} ) - Fraction by which to increase auto-ranged extents to make datapoints more visible around borders. To compute padding, the axis whose screen size is largest is chosen, and the range of that axis is increased by the specified fraction along each axis. Other axes are then padded ensuring that the amount of screen space devoted to padding is equal for all axes. If specified as a tuple, the int or float values in the tuple will be used for padding in each axis, in order (x,y or x,y,z). For example, for padding=0.2 on a 800x800-pixel plot, an x-axis with the range [0,10] will be padded by 20% to be [-1,11], while a y-axis with a range [0,1000] will be padded to be [-100,1100], which should make the padding be approximately the same number of pixels. But if the same plot is changed to have a height of only 200, the y-range will then be [-400,1400] so that the y-axis padding will still match that of the x-axis. It is also possible to declare non-equal padding value for the lower and upper bound of an axis by supplying nested tuples, e.g. padding=(0.1, (0, 0.1)) will pad the x-axis lower and upper bound as well as the y-axis upper bound by a fraction of 0.1 while the y-axis lower bound is not padded at all.
-
param Boolean
show_legend( allow_None=False, bounds=(0, 1), constant=False, default=True, instantiate=False, pickle_default_value=True, precedence=None, readonly=False, watchers={} ) - Whether to show legend for the plot.
-
param Boolean
show_grid( allow_None=False, bounds=(0, 1), constant=False, default=False, instantiate=False, pickle_default_value=True, precedence=None, readonly=False, watchers={} ) - Whether to show a Cartesian grid on the plot.
-
param ObjectSelector
xaxis( allow_None=None, check_on_set=True, compute_default_fn=None, constant=False, default=bottom, instantiate=False, names=None, objects=[‘top’, ‘bottom’, ‘bare’, ‘top-bare’, ‘bottom-bare’, None, True, False], pickle_default_value=True, precedence=None, readonly=False, watchers={} ) - Whether and where to display the xaxis. The “bare” options allow suppressing all axis labels, including ticks and xlabel. Valid options are ‘top’, ‘bottom’, ‘bare’, ‘top-bare’ and ‘bottom-bare’.
-
param ObjectSelector
yaxis( allow_None=None, check_on_set=True, compute_default_fn=None, constant=False, default=left, instantiate=False, names=None, objects=[‘left’, ‘right’, ‘bare’, ‘left-bare’, ‘right-bare’, None, True, False], pickle_default_value=True, precedence=None, readonly=False, watchers={} ) - Whether and where to display the yaxis. The “bare” options allow suppressing all axis labels, including ticks and ylabel. Valid options are ‘left’, ‘right’, ‘bare’, ‘left-bare’ and ‘right-bare’.
-
param String
xlabel( allow_None=True, basestring=<class ‘str’>, constant=False, default=None, instantiate=False, pickle_default_value=True, precedence=None, readonly=False, regex=None, watchers={} ) - An explicit override of the x-axis label, if set takes precedence over the dimension label.
-
param String
ylabel( allow_None=True, basestring=<class ‘str’>, constant=False, default=None, instantiate=False, pickle_default_value=True, precedence=None, readonly=False, regex=None, watchers={} ) - An explicit override of the y-axis label, if set takes precedence over the dimension label.
-
param NumericTuple
xlim( allow_None=False, constant=False, default=(nan, nan), instantiate=False, length=2, pickle_default_value=True, precedence=None, readonly=False, watchers={} ) - User-specified x-axis range limits for the plot, as a tuple (low,high). If specified, takes precedence over data and dimension ranges.
-
param NumericTuple
ylim( allow_None=False, constant=False, default=(nan, nan), instantiate=False, length=2, pickle_default_value=True, precedence=None, readonly=False, watchers={} ) - User-specified x-axis range limits for the plot, as a tuple (low,high). If specified, takes precedence over data and dimension ranges.
-
param NumericTuple
zlim( allow_None=False, constant=False, default=(nan, nan), instantiate=False, length=2, pickle_default_value=True, precedence=None, readonly=False, watchers={} ) - User-specified z-axis range limits for the plot, as a tuple (low,high). If specified, takes precedence over data and dimension ranges.
-
param Integer
xrotation( allow_None=True, bounds=(0, 360), constant=False, default=None, inclusive_bounds=(True, True), instantiate=False, pickle_default_value=True, precedence=None, readonly=False, softbounds=None, time_dependent=False, time_fn=<Time Time00001>, watchers={} ) - Rotation angle of the xticks.
-
param Integer
yrotation( allow_None=True, bounds=(0, 360), constant=False, default=None, inclusive_bounds=(True, True), instantiate=False, pickle_default_value=True, precedence=None, readonly=False, softbounds=None, time_dependent=False, time_fn=<Time Time00001>, watchers={} ) - Rotation angle of the yticks.
-
param Parameter
xticks( allow_None=True, constant=False, default=None, instantiate=False, pickle_default_value=True, precedence=None, readonly=False, watchers={} ) - Ticks along x-axis specified as an integer, explicit list of tick locations, or bokeh Ticker object. If set to None default bokeh ticking behavior is applied.
-
param Parameter
yticks( allow_None=True, constant=False, default=None, instantiate=False, pickle_default_value=True, precedence=None, readonly=False, watchers={} ) - Ticks along y-axis specified as an integer, explicit list of tick locations, or bokeh Ticker object. If set to None default bokeh ticking behavior is applied.
-
param Boolean
apply_ticks( allow_None=False, bounds=(0, 1), constant=False, default=True, instantiate=False, pickle_default_value=True, precedence=None, readonly=False, watchers={} ) - Whether to apply custom ticks.
-
param Parameter
aspect( allow_None=False, constant=False, default=square, instantiate=False, pickle_default_value=True, precedence=None, readonly=False, watchers={} ) - The aspect ratio mode of the plot. By default, a plot may select its own appropriate aspect ratio but sometimes it may be necessary to force a square aspect ratio (e.g. to display the plot as an element of a grid). The modes ‘auto’ and ‘equal’ correspond to the axis modes of the same name in matplotlib, a numeric value may also be passed.
-
param Boolean
invert_zaxis( allow_None=False, bounds=(0, 1), constant=False, default=False, instantiate=False, pickle_default_value=True, precedence=None, readonly=False, watchers={} ) - Whether to invert the plot z-axis.
-
param List
labelled( allow_None=False, bounds=(0, None), constant=False, default=[‘x’, ‘y’], instantiate=True, pickle_default_value=True, precedence=None, readonly=False, watchers={} ) - Whether to plot the ‘x’ and ‘y’ labels.
-
param Boolean
logz( allow_None=False, bounds=(0, 1), constant=False, default=False, instantiate=False, pickle_default_value=True, precedence=None, readonly=False, watchers={} ) - Whether to apply log scaling to the y-axis of the Chart.
-
param ClassSelector
xformatter( allow_None=True, constant=False, default=None, instantiate=True, is_instance=True, pickle_default_value=True, precedence=None, readonly=False, watchers={} ) - Formatter for ticks along the x-axis.
-
param ClassSelector
yformatter( allow_None=True, constant=False, default=None, instantiate=True, is_instance=True, pickle_default_value=True, precedence=None, readonly=False, watchers={} ) - Formatter for ticks along the y-axis.
-
param ClassSelector
zformatter( allow_None=True, constant=False, default=None, instantiate=True, is_instance=True, pickle_default_value=True, precedence=None, readonly=False, watchers={} ) - Formatter for ticks along the z-axis.
-
param Boolean
zaxis( allow_None=False, bounds=(0, 1), constant=False, default=True, instantiate=False, pickle_default_value=True, precedence=None, readonly=False, watchers={} ) - Whether to display the z-axis.
-
param String
zlabel( allow_None=True, basestring=<class ‘str’>, constant=False, default=None, instantiate=False, pickle_default_value=True, precedence=None, readonly=False, regex=None, watchers={} ) - An explicit override of the z-axis label, if set takes precedence over the dimension label.
-
param Integer
zrotation( allow_None=False, bounds=(0, 360), constant=False, default=0, inclusive_bounds=(True, True), instantiate=False, pickle_default_value=True, precedence=None, readonly=False, softbounds=None, time_dependent=False, time_fn=<Time Time00001>, watchers={} ) - Rotation angle of the zticks.
-
param Parameter
zticks( allow_None=True, constant=False, default=None, instantiate=False, pickle_default_value=True, precedence=None, readonly=False, watchers={} ) - Ticks along z-axis specified as an integer, explicit list of tick locations, list of tuples containing the locations and labels or a matplotlib tick locator object. If set to None default matplotlib ticking behavior is applied.
-
param Boolean
colorbar( allow_None=False, bounds=(0, 1), constant=False, default=False, instantiate=False, pickle_default_value=True, precedence=None, readonly=False, watchers={} ) - Whether to draw a colorbar.
-
param ClassSelector
color_levels( allow_None=True, constant=False, default=None, instantiate=True, is_instance=True, pickle_default_value=True, precedence=None, readonly=False, watchers={} ) - Number of discrete colors to use when colormapping or a set of color intervals defining the range of values to map each color to.
-
param Dict
clipping_colors( allow_None=False, constant=False, default={}, instantiate=True, is_instance=True, pickle_default_value=True, precedence=None, readonly=False, watchers={} ) - Dictionary to specify colors for clipped values, allows setting color for NaN values and for values above and below the min and max value. The min, max or NaN color may specify an RGB(A) color as a color hex string of the form #FFFFFF or #FFFFFFFF or a length 3 or length 4 tuple specifying values in the range 0-1 or a named HTML color.
-
param Number
cbar_padding( allow_None=False, bounds=None, constant=False, default=0.01, inclusive_bounds=(True, True), instantiate=False, pickle_default_value=True, precedence=None, readonly=False, softbounds=None, time_dependent=False, time_fn=<Time Time00001>, watchers={} ) - Padding between colorbar and other plots.
-
param Parameter
cbar_ticks( allow_None=True, constant=False, default=None, instantiate=False, pickle_default_value=True, precedence=None, readonly=False, watchers={} ) - Ticks along colorbar-axis specified as an integer, explicit list of tick locations, list of tuples containing the locations and labels or a matplotlib tick locator object. If set to None default matplotlib ticking behavior is applied.
-
param Number
cbar_width( allow_None=False, bounds=None, constant=False, default=0.05, inclusive_bounds=(True, True), instantiate=False, pickle_default_value=True, precedence=None, readonly=False, softbounds=None, time_dependent=False, time_fn=<Time Time00001>, watchers={} ) - Width of the colorbar as a fraction of the main plot
-
param Boolean
symmetric( allow_None=False, bounds=(0, 1), constant=False, default=False, instantiate=False, pickle_default_value=True, precedence=None, readonly=False, watchers={} ) - Whether to make the colormap symmetric around zero.
-
anim( start=0 , stop=None , fps=30 ) ¶ -
Method to return a matplotlib animation. The start and stop frames may be specified as well as the fps.
-
cleanup( ) ¶ -
Cleans up references to the plot on the attached Stream subscribers.
-
compute_ranges( obj , key , ranges ) ¶ -
Given an object, a specific key, and the normalization options, this method will find the specified normalization options on the appropriate OptionTree, group the elements according to the selected normalization option (i.e. either per frame or over the whole animation) and finally compute the dimension ranges in each group. The new set of ranges is returned.
-
debug( *args , **kwargs ) ¶ -
Inspect .param.debug method for the full docstring
-
defaults( *args , **kwargs ) ¶ -
Inspect .param.defaults method for the full docstring
-
force_new_dynamic_value= functools.partial(<function Parameters.deprecate.<locals>.inner>, <class 'holoviews.plotting.mpl.chart.ErrorPlot'>) 
-
get_aspect( xspan , yspan ) ¶ -
Computes the aspect ratio of the plot
-
get_extents( element , ranges , range_type='combined' , xdim=None , ydim=None , zdim=None ) ¶ -
Gets the extents for the axes from the current Element. The globally computed ranges can optionally override the extents.
The extents are computed by combining the data ranges, extents and dimension ranges. Each of these can be obtained individually by setting the range_type to one of:
- ‘data’: Just the data ranges
- ‘extents’: Element.extents
- ‘soft’: Dimension.soft_range values
- ‘hard’: Dimension.range values
To obtain the combined range, which includes range padding the default may be used:
- ‘combined’: All the range types combined and padding applied
This allows Overlay plots to obtain each range and combine them appropriately for all the objects in the overlay.
-
get_padding( extents ) ¶ -
Computes padding along the axes taking into account the plot aspect.
-
get_param_values= functools.partial(<function Parameters.deprecate.<locals>.inner>, <class 'holoviews.plotting.mpl.chart.ErrorPlot'>) 
-
get_value_generator= functools.partial(<function Parameters.deprecate.<locals>.inner>, <class 'holoviews.plotting.mpl.chart.ErrorPlot'>) 
-
get_zorder( overlay , key , el ) ¶ -
Computes the z-order of element in the NdOverlay taking into account possible batching of elements.
-
init_comm( ) ¶ -
Initializes comm and attaches streams.
-
inspect_value= functools.partial(<function Parameters.deprecate.<locals>.inner>, <class 'holoviews.plotting.mpl.chart.ErrorPlot'>) 
-
matches( spec ) ¶ -
Matches a specification against the current Plot.
-
message( *args , **kwargs ) ¶ -
Inspect .param.message method for the full docstring
-
params( *args , **kwargs ) ¶ -
Inspect .param.params method for the full docstring
-
pprint( imports=None , prefix=' ' , unknown_value='<?>' , qualify=False , separator='' ) ¶ -
(Experimental) Pretty printed representation that may be evaluated with eval. See pprint() function for more details.
-
print_param_defaults( *args , **kwargs ) ¶ -
Inspect .param.print_param_defaults method for the full docstring
-
print_param_values( *args , **kwargs ) ¶ -
Inspect .param.print_param_values method for the full docstring
-
push( ) ¶ -
Pushes updated plot data via the Comm.
-
refresh( **kwargs ) ¶ -
Refreshes the plot by rerendering it and then pushing the updated data if the plot has an associated Comm.
-
script_repr( imports=[] , prefix=' ' ) ¶ -
Variant of __repr__ designed for generating a runnable script.
-
set_default( *args , **kwargs ) ¶ -
Inspect .param.set_default method for the full docstring
-
set_dynamic_time_fn= functools.partial(<function Parameters.deprecate.<locals>.inner>, <class 'holoviews.plotting.mpl.chart.ErrorPlot'>) 
-
set_param= functools.partial(<function Parameters.deprecate.<locals>.inner>, <class 'holoviews.plotting.mpl.chart.ErrorPlot'>) 
-
state_pop( ) ¶ -
Restore the most recently saved state.
See state_push() for more details.
-
state_push( ) ¶ -
Save this instance’s state.
For Parameterized instances, this includes the state of dynamically generated values.
Subclasses that maintain short-term state should additionally save and restore that state using state_push() and state_pop().
Generally, this method is used by operations that need to test something without permanently altering the objects’ state.
-
teardown_handles( ) ¶ -
If no custom update_handles method is supplied this method is called to tear down any previous handles before replacing them.
-
traverse( fn=None , specs=None , full_breadth=True ) ¶ -
Traverses any nested DimensionedPlot returning a list of all plots that match the specs. The specs should be supplied as a list of either Plot types or callables, which should return a boolean given the plot class.
-
verbose( *args , **kwargs ) ¶ -
Inspect .param.verbose method for the full docstring
-
warning( *args , **kwargs ) ¶ -
Inspect .param.warning method for the full docstring
-
param Parameter
-
class
holoviews.plotting.mpl.chart.HistogramPlot( histograms , **params ) [source] ¶ -
Bases:
holoviews.plotting.mpl.element.ColorbarPlotHistogramPlot can plot DataHistograms and ViewMaps of DataHistograms, which can be displayed as a single frame or animation.
-
param Parameter
fontsize( allow_None=True, constant=False, default=None, instantiate=False, pickle_default_value=True, precedence=None, readonly=False, watchers={} ) - Specifies various font sizes of the displayed text. Finer control is available by supplying a dictionary where any unmentioned keys revert to the default sizes, e.g: {‘ticks’:20, ‘title’:15, ‘ylabel’:5, ‘xlabel’:5, ‘zlabel’:5, ‘legend’:8, ‘legend_title’:13} You can set the font size of ‘zlabel’, ‘ylabel’ and ‘xlabel’ together using the ‘labels’ key.
-
param Boolean
show_title( allow_None=False, bounds=(0, 1), constant=False, default=True, instantiate=False, pickle_default_value=True, precedence=None, readonly=False, watchers={} ) - Whether to display the plot title.
-
param String
title( allow_None=False, basestring=<class ‘str’>, constant=False, default={label} {group} {dimensions}, instantiate=False, pickle_default_value=True, precedence=None, readonly=False, regex=None, watchers={} ) - The formatting string for the title of this plot, allows defining a label group separator and dimension labels.
-
param String
title_format( allow_None=True, basestring=<class ‘str’>, constant=False, default=None, instantiate=False, pickle_default_value=True, precedence=None, readonly=False, regex=None, watchers={} ) - Alias for title.
-
param Boolean
normalize( allow_None=False, bounds=(0, 1), constant=False, default=True, instantiate=False, pickle_default_value=True, precedence=None, readonly=False, watchers={} ) - Whether to compute ranges across all Elements at this level of plotting. Allows selecting normalization at different levels for nested data containers.
-
param Parameter
projection( allow_None=True, constant=False, default=None, instantiate=False, pickle_default_value=True, precedence=None, readonly=False, watchers={} ) - The projection of the plot axis, default of None is equivalent to 2D plot, ‘3d’ and ‘polar’ are also supported by matplotlib by default. May also supply a custom projection that is either a matplotlib projection type or implements the _as_mpl_axes method.
-
param Number
fig_alpha( allow_None=False, bounds=(0, 1), constant=False, default=1.0, inclusive_bounds=(True, True), instantiate=False, pickle_default_value=True, precedence=None, readonly=False, softbounds=None, time_dependent=False, time_fn=<Time Time00001>, watchers={} ) - Alpha of the overall figure background.
-
param NumericTuple
fig_bounds( allow_None=False, constant=False, default=(0.15, 0.15, 0.85, 0.85), instantiate=False, length=4, pickle_default_value=True, precedence=None, readonly=False, watchers={} ) - The bounds of the overall figure as a 4-tuple of the form (left, bottom, right, top), defining the size of the border around the subplots.
-
param Parameter
fig_inches( allow_None=False, constant=False, default=4, instantiate=False, pickle_default_value=True, precedence=None, readonly=False, watchers={} ) - The overall matplotlib figure size in inches. May be set as an integer in which case it will be used to autocompute a size. Alternatively may be set with an explicit tuple or list, in which case it will be applied directly after being scaled by fig_size. If either the width or height is set to None, it will be computed automatically.
-
param Boolean
fig_latex( allow_None=False, bounds=(0, 1), constant=False, default=False, instantiate=False, pickle_default_value=True, precedence=None, readonly=False, watchers={} ) - Whether to use LaTeX text in the overall figure.
-
param Dict
fig_rcparams( allow_None=False, constant=False, default={}, instantiate=True, is_instance=True, pickle_default_value=True, precedence=None, readonly=False, watchers={} ) - matplotlib rc parameters to apply to the overall figure.
-
param Number
fig_size( allow_None=False, bounds=(1, None), constant=False, default=100.0, inclusive_bounds=(True, True), instantiate=False, pickle_default_value=True, precedence=None, readonly=False, softbounds=None, time_dependent=False, time_fn=<Time Time00001>, watchers={} ) - Size relative to the supplied overall fig_inches in percent.
-
param HookList
initial_hooks( allow_None=False, bounds=(0, None), constant=False, default=[], instantiate=True, pickle_default_value=True, precedence=None, readonly=False, watchers={} ) - Optional list of hooks called before plotting the data onto the axis (now marked for deprecation). The hook is passed the plot object and the displayed object; other plotting handles can be accessed via plot.handles.
-
param HookList
finalize_hooks( allow_None=False, bounds=(0, None), constant=False, default=[], instantiate=True, pickle_default_value=True, precedence=None, readonly=False, watchers={} ) - Deprecated; use hooks options instead.
-
param HookList
hooks( allow_None=False, bounds=(0, None), constant=False, default=[], instantiate=True, pickle_default_value=True, precedence=None, readonly=False, watchers={} ) - Optional list of hooks called when finalizing a plot. The hook is passed the plot object and the displayed element, and other plotting handles can be accessed via plot.handles.
-
param String
sublabel_format( allow_None=True, basestring=<class ‘str’>, constant=False, default=None, instantiate=False, pickle_default_value=True, precedence=None, readonly=False, regex=None, watchers={} ) - Allows labeling the subaxes in each plot with various formatters including {Alpha}, {alpha}, {numeric} and {roman}.
-
param NumericTuple
sublabel_position( allow_None=False, constant=False, default=(-0.35, 0.85), instantiate=False, length=2, pickle_default_value=True, precedence=None, readonly=False, watchers={} ) - Position relative to the plot for placing the optional subfigure label.
-
param Number
sublabel_size( allow_None=False, bounds=None, constant=False, default=18, inclusive_bounds=(True, True), instantiate=False, pickle_default_value=True, precedence=None, readonly=False, softbounds=None, time_dependent=False, time_fn=<Time Time00001>, watchers={} ) - Size of optional subfigure label.
-
param Boolean
show_frame( allow_None=False, bounds=(0, 1), constant=False, default=False, instantiate=False, pickle_default_value=True, precedence=None, readonly=False, watchers={} ) - Whether or not to show a complete frame around the plot.
-
param Boolean
apply_ranges( allow_None=False, bounds=(0, 1), constant=False, default=True, instantiate=False, pickle_default_value=True, precedence=None, readonly=False, watchers={} ) - Whether to compute the plot bounds from the data itself.
-
param Boolean
apply_extents( allow_None=False, bounds=(0, 1), constant=False, default=True, instantiate=False, pickle_default_value=True, precedence=None, readonly=False, watchers={} ) - Whether to apply extent overrides on the Elements
-
param ClassSelector
bgcolor( allow_None=True, constant=False, default=None, instantiate=True, is_instance=True, pickle_default_value=True, precedence=None, readonly=False, watchers={} ) - If set bgcolor overrides the background color of the axis.
-
param ClassSelector
default_span( allow_None=False, constant=False, default=2.0, instantiate=True, is_instance=True, pickle_default_value=True, precedence=None, readonly=False, watchers={} ) - Defines the span of an axis if the axis range is zero, i.e. if the lower and upper end of an axis are equal or no range is defined at all. For example if there is a single datapoint at 0 a default_span of 2.0 will result in axis ranges spanning from -1 to 1.
-
param Boolean
invert_axes( allow_None=False, bounds=(0, 1), constant=False, default=False, instantiate=False, pickle_default_value=True, precedence=None, readonly=False, watchers={} ) - Whether to invert the x- and y-axis
-
param Boolean
invert_xaxis( allow_None=False, bounds=(0, 1), constant=False, default=False, instantiate=False, pickle_default_value=True, precedence=None, readonly=False, watchers={} ) - Whether to invert the plot x-axis.
-
param Boolean
invert_yaxis( allow_None=False, bounds=(0, 1), constant=False, default=False, instantiate=False, pickle_default_value=True, precedence=None, readonly=False, watchers={} ) - Whether to invert the plot y-axis.
-
param Boolean
logx( allow_None=False, bounds=(0, 1), constant=False, default=False, instantiate=False, pickle_default_value=True, precedence=None, readonly=False, watchers={} ) - Whether the x-axis of the plot will be a log axis.
-
param Boolean
logy( allow_None=False, bounds=(0, 1), constant=False, default=False, instantiate=False, pickle_default_value=True, precedence=None, readonly=False, watchers={} ) - Whether the y-axis of the plot will be a log axis.
-
param ClassSelector
padding( allow_None=False, constant=False, default=0, instantiate=True, is_instance=True, pickle_default_value=True, precedence=None, readonly=False, watchers={} ) - Fraction by which to increase auto-ranged extents to make datapoints more visible around borders. To compute padding, the axis whose screen size is largest is chosen, and the range of that axis is increased by the specified fraction along each axis. Other axes are then padded ensuring that the amount of screen space devoted to padding is equal for all axes. If specified as a tuple, the int or float values in the tuple will be used for padding in each axis, in order (x,y or x,y,z). For example, for padding=0.2 on a 800x800-pixel plot, an x-axis with the range [0,10] will be padded by 20% to be [-1,11], while a y-axis with a range [0,1000] will be padded to be [-100,1100], which should make the padding be approximately the same number of pixels. But if the same plot is changed to have a height of only 200, the y-range will then be [-400,1400] so that the y-axis padding will still match that of the x-axis. It is also possible to declare non-equal padding value for the lower and upper bound of an axis by supplying nested tuples, e.g. padding=(0.1, (0, 0.1)) will pad the x-axis lower and upper bound as well as the y-axis upper bound by a fraction of 0.1 while the y-axis lower bound is not padded at all.
-
param Boolean
show_legend( allow_None=False, bounds=(0, 1), constant=False, default=True, instantiate=False, pickle_default_value=True, precedence=None, readonly=False, watchers={} ) - Whether to show legend for the plot.
-
param Boolean
show_grid( allow_None=False, bounds=(0, 1), constant=False, default=False, instantiate=False, pickle_default_value=True, precedence=None, readonly=False, watchers={} ) - Whether to show a Cartesian grid on the plot.
-
param ObjectSelector
xaxis( allow_None=None, check_on_set=True, compute_default_fn=None, constant=False, default=bottom, instantiate=False, names=None, objects=[‘top’, ‘bottom’, ‘bare’, ‘top-bare’, ‘bottom-bare’, None, True, False], pickle_default_value=True, precedence=None, readonly=False, watchers={} ) - Whether and where to display the xaxis. The “bare” options allow suppressing all axis labels, including ticks and xlabel. Valid options are ‘top’, ‘bottom’, ‘bare’, ‘top-bare’ and ‘bottom-bare’.
-
param ObjectSelector
yaxis( allow_None=None, check_on_set=True, compute_default_fn=None, constant=False, default=left, instantiate=False, names=None, objects=[‘left’, ‘right’, ‘bare’, ‘left-bare’, ‘right-bare’, None, True, False], pickle_default_value=True, precedence=None, readonly=False, watchers={} ) - Whether and where to display the yaxis. The “bare” options allow suppressing all axis labels, including ticks and ylabel. Valid options are ‘left’, ‘right’, ‘bare’, ‘left-bare’ and ‘right-bare’.
-
param String
xlabel( allow_None=True, basestring=<class ‘str’>, constant=False, default=None, instantiate=False, pickle_default_value=True, precedence=None, readonly=False, regex=None, watchers={} ) - An explicit override of the x-axis label, if set takes precedence over the dimension label.
-
param String
ylabel( allow_None=True, basestring=<class ‘str’>, constant=False, default=None, instantiate=False, pickle_default_value=True, precedence=None, readonly=False, regex=None, watchers={} ) - An explicit override of the y-axis label, if set takes precedence over the dimension label.
-
param NumericTuple
xlim( allow_None=False, constant=False, default=(nan, nan), instantiate=False, length=2, pickle_default_value=True, precedence=None, readonly=False, watchers={} ) - User-specified x-axis range limits for the plot, as a tuple (low,high). If specified, takes precedence over data and dimension ranges.
-
param NumericTuple
ylim( allow_None=False, constant=False, default=(nan, nan), instantiate=False, length=2, pickle_default_value=True, precedence=None, readonly=False, watchers={} ) - User-specified x-axis range limits for the plot, as a tuple (low,high). If specified, takes precedence over data and dimension ranges.
-
param NumericTuple
zlim( allow_None=False, constant=False, default=(nan, nan), instantiate=False, length=2, pickle_default_value=True, precedence=None, readonly=False, watchers={} ) - User-specified z-axis range limits for the plot, as a tuple (low,high). If specified, takes precedence over data and dimension ranges.
-
param Integer
xrotation( allow_None=True, bounds=(0, 360), constant=False, default=None, inclusive_bounds=(True, True), instantiate=False, pickle_default_value=True, precedence=None, readonly=False, softbounds=None, time_dependent=False, time_fn=<Time Time00001>, watchers={} ) - Rotation angle of the xticks.
-
param Integer
yrotation( allow_None=True, bounds=(0, 360), constant=False, default=None, inclusive_bounds=(True, True), instantiate=False, pickle_default_value=True, precedence=None, readonly=False, softbounds=None, time_dependent=False, time_fn=<Time Time00001>, watchers={} ) - Rotation angle of the yticks.
-
param Parameter
xticks( allow_None=True, constant=False, default=None, instantiate=False, pickle_default_value=True, precedence=None, readonly=False, watchers={} ) - Ticks along x-axis specified as an integer, explicit list of tick locations, or bokeh Ticker object. If set to None default bokeh ticking behavior is applied.
-
param Parameter
yticks( allow_None=True, constant=False, default=None, instantiate=False, pickle_default_value=True, precedence=None, readonly=False, watchers={} ) - Ticks along y-axis specified as an integer, explicit list of tick locations, or bokeh Ticker object. If set to None default bokeh ticking behavior is applied.
-
param Boolean
apply_ticks( allow_None=False, bounds=(0, 1), constant=False, default=True, instantiate=False, pickle_default_value=True, precedence=None, readonly=False, watchers={} ) - Whether to apply custom ticks.
-
param Parameter
aspect( allow_None=False, constant=False, default=square, instantiate=False, pickle_default_value=True, precedence=None, readonly=False, watchers={} ) - The aspect ratio mode of the plot. By default, a plot may select its own appropriate aspect ratio but sometimes it may be necessary to force a square aspect ratio (e.g. to display the plot as an element of a grid). The modes ‘auto’ and ‘equal’ correspond to the axis modes of the same name in matplotlib, a numeric value may also be passed.
-
param Boolean
invert_zaxis( allow_None=False, bounds=(0, 1), constant=False, default=False, instantiate=False, pickle_default_value=True, precedence=None, readonly=False, watchers={} ) - Whether to invert the plot z-axis.
-
param List
labelled( allow_None=False, bounds=(0, None), constant=False, default=[‘x’, ‘y’], instantiate=True, pickle_default_value=True, precedence=None, readonly=False, watchers={} ) - Whether to plot the ‘x’ and ‘y’ labels.
-
param Boolean
logz( allow_None=False, bounds=(0, 1), constant=False, default=False, instantiate=False, pickle_default_value=True, precedence=None, readonly=False, watchers={} ) - Whether to apply log scaling to the y-axis of the Chart.
-
param ClassSelector
xformatter( allow_None=True, constant=False, default=None, instantiate=True, is_instance=True, pickle_default_value=True, precedence=None, readonly=False, watchers={} ) - Formatter for ticks along the x-axis.
-
param ClassSelector
yformatter( allow_None=True, constant=False, default=None, instantiate=True, is_instance=True, pickle_default_value=True, precedence=None, readonly=False, watchers={} ) - Formatter for ticks along the y-axis.
-
param ClassSelector
zformatter( allow_None=True, constant=False, default=None, instantiate=True, is_instance=True, pickle_default_value=True, precedence=None, readonly=False, watchers={} ) - Formatter for ticks along the z-axis.
-
param Boolean
zaxis( allow_None=False, bounds=(0, 1), constant=False, default=True, instantiate=False, pickle_default_value=True, precedence=None, readonly=False, watchers={} ) - Whether to display the z-axis.
-
param String
zlabel( allow_None=True, basestring=<class ‘str’>, constant=False, default=None, instantiate=False, pickle_default_value=True, precedence=None, readonly=False, regex=None, watchers={} ) - An explicit override of the z-axis label, if set takes precedence over the dimension label.
-
param Integer
zrotation( allow_None=False, bounds=(0, 360), constant=False, default=0, inclusive_bounds=(True, True), instantiate=False, pickle_default_value=True, precedence=None, readonly=False, softbounds=None, time_dependent=False, time_fn=<Time Time00001>, watchers={} ) - Rotation angle of the zticks.
-
param Parameter
zticks( allow_None=True, constant=False, default=None, instantiate=False, pickle_default_value=True, precedence=None, readonly=False, watchers={} ) - Ticks along z-axis specified as an integer, explicit list of tick locations, list of tuples containing the locations and labels or a matplotlib tick locator object. If set to None default matplotlib ticking behavior is applied.
-
param Boolean
colorbar( allow_None=False, bounds=(0, 1), constant=False, default=False, instantiate=False, pickle_default_value=True, precedence=None, readonly=False, watchers={} ) - Whether to draw a colorbar.
-
param ClassSelector
color_levels( allow_None=True, constant=False, default=None, instantiate=True, is_instance=True, pickle_default_value=True, precedence=None, readonly=False, watchers={} ) - Number of discrete colors to use when colormapping or a set of color intervals defining the range of values to map each color to.
-
param Dict
clipping_colors( allow_None=False, constant=False, default={}, instantiate=True, is_instance=True, pickle_default_value=True, precedence=None, readonly=False, watchers={} ) - Dictionary to specify colors for clipped values, allows setting color for NaN values and for values above and below the min and max value. The min, max or NaN color may specify an RGB(A) color as a color hex string of the form #FFFFFF or #FFFFFFFF or a length 3 or length 4 tuple specifying values in the range 0-1 or a named HTML color.
-
param Number
cbar_padding( allow_None=False, bounds=None, constant=False, default=0.01, inclusive_bounds=(True, True), instantiate=False, pickle_default_value=True, precedence=None, readonly=False, softbounds=None, time_dependent=False, time_fn=<Time Time00001>, watchers={} ) - Padding between colorbar and other plots.
-
param Parameter
cbar_ticks( allow_None=True, constant=False, default=None, instantiate=False, pickle_default_value=True, precedence=None, readonly=False, watchers={} ) - Ticks along colorbar-axis specified as an integer, explicit list of tick locations, list of tuples containing the locations and labels or a matplotlib tick locator object. If set to None default matplotlib ticking behavior is applied.
-
param Number
cbar_width( allow_None=False, bounds=None, constant=False, default=0.05, inclusive_bounds=(True, True), instantiate=False, pickle_default_value=True, precedence=None, readonly=False, softbounds=None, time_dependent=False, time_fn=<Time Time00001>, watchers={} ) - Width of the colorbar as a fraction of the main plot
-
param Boolean
symmetric( allow_None=False, bounds=(0, 1), constant=False, default=False, instantiate=False, pickle_default_value=True, precedence=None, readonly=False, watchers={} ) - Whether to make the colormap symmetric around zero.
-
anim( start=0 , stop=None , fps=30 ) ¶ -
Method to return a matplotlib animation. The start and stop frames may be specified as well as the fps.
-
cleanup( ) ¶ -
Cleans up references to the plot on the attached Stream subscribers.
-
compute_ranges( obj , key , ranges ) ¶ -
Given an object, a specific key, and the normalization options, this method will find the specified normalization options on the appropriate OptionTree, group the elements according to the selected normalization option (i.e. either per frame or over the whole animation) and finally compute the dimension ranges in each group. The new set of ranges is returned.
-
debug( *args , **kwargs ) ¶ -
Inspect .param.debug method for the full docstring
-
defaults( *args , **kwargs ) ¶ -
Inspect .param.defaults method for the full docstring
-
force_new_dynamic_value= functools.partial(<function Parameters.deprecate.<locals>.inner>, <class 'holoviews.plotting.mpl.chart.HistogramPlot'>) 
-
get_aspect( xspan , yspan ) ¶ -
Computes the aspect ratio of the plot
-
get_padding( extents ) ¶ -
Computes padding along the axes taking into account the plot aspect.
-
get_param_values= functools.partial(<function Parameters.deprecate.<locals>.inner>, <class 'holoviews.plotting.mpl.chart.HistogramPlot'>) 
-
get_value_generator= functools.partial(<function Parameters.deprecate.<locals>.inner>, <class 'holoviews.plotting.mpl.chart.HistogramPlot'>) 
-
get_zorder( overlay , key , el ) ¶ -
Computes the z-order of element in the NdOverlay taking into account possible batching of elements.
-
init_artists( ax , plot_args , plot_kwargs ) ¶ -
Initializes the artist based on the plot method declared on the plot.
-
init_comm( ) ¶ -
Initializes comm and attaches streams.
-
inspect_value= functools.partial(<function Parameters.deprecate.<locals>.inner>, <class 'holoviews.plotting.mpl.chart.HistogramPlot'>) 
-
matches( spec ) ¶ -
Matches a specification against the current Plot.
-
message( *args , **kwargs ) ¶ -
Inspect .param.message method for the full docstring
-
params( *args , **kwargs ) ¶ -
Inspect .param.params method for the full docstring
-
pprint( imports=None , prefix=' ' , unknown_value='<?>' , qualify=False , separator='' ) ¶ -
(Experimental) Pretty printed representation that may be evaluated with eval. See pprint() function for more details.
-
print_param_defaults( *args , **kwargs ) ¶ -
Inspect .param.print_param_defaults method for the full docstring
-
print_param_values( *args , **kwargs ) ¶ -
Inspect .param.print_param_values method for the full docstring
-
push( ) ¶ -
Pushes updated plot data via the Comm.
-
refresh( **kwargs ) ¶ -
Refreshes the plot by rerendering it and then pushing the updated data if the plot has an associated Comm.
-
script_repr( imports=[] , prefix=' ' ) ¶ -
Variant of __repr__ designed for generating a runnable script.
-
set_default( *args , **kwargs ) ¶ -
Inspect .param.set_default method for the full docstring
-
set_dynamic_time_fn= functools.partial(<function Parameters.deprecate.<locals>.inner>, <class 'holoviews.plotting.mpl.chart.HistogramPlot'>) 
-
set_param= functools.partial(<function Parameters.deprecate.<locals>.inner>, <class 'holoviews.plotting.mpl.chart.HistogramPlot'>) 
-
state_pop( ) ¶ -
Restore the most recently saved state.
See state_push() for more details.
-
state_push( ) ¶ -
Save this instance’s state.
For Parameterized instances, this includes the state of dynamically generated values.
Subclasses that maintain short-term state should additionally save and restore that state using state_push() and state_pop().
Generally, this method is used by operations that need to test something without permanently altering the objects’ state.
-
teardown_handles( ) ¶ -
If no custom update_handles method is supplied this method is called to tear down any previous handles before replacing them.
-
traverse( fn=None , specs=None , full_breadth=True ) ¶ -
Traverses any nested DimensionedPlot returning a list of all plots that match the specs. The specs should be supplied as a list of either Plot types or callables, which should return a boolean given the plot class.
-
verbose( *args , **kwargs ) ¶ -
Inspect .param.verbose method for the full docstring
-
warning( *args , **kwargs ) ¶ -
Inspect .param.warning method for the full docstring
-
param Parameter
-
class
holoviews.plotting.mpl.chart.PointPlot( *args , **kwargs ) [source] ¶ -
Bases:
holoviews.plotting.mpl.chart.ChartPlot,holoviews.plotting.mpl.element.ColorbarPlotNote that the ‘cmap’, ‘vmin’ and ‘vmax’ style arguments control how point magnitudes are rendered to different colors.
-
param Parameter
fontsize( allow_None=True, constant=False, default=None, instantiate=False, pickle_default_value=True, precedence=None, readonly=False, watchers={} ) - Specifies various font sizes of the displayed text. Finer control is available by supplying a dictionary where any unmentioned keys revert to the default sizes, e.g: {‘ticks’:20, ‘title’:15, ‘ylabel’:5, ‘xlabel’:5, ‘zlabel’:5, ‘legend’:8, ‘legend_title’:13} You can set the font size of ‘zlabel’, ‘ylabel’ and ‘xlabel’ together using the ‘labels’ key.
-
param Boolean
show_title( allow_None=False, bounds=(0, 1), constant=False, default=True, instantiate=False, pickle_default_value=True, precedence=None, readonly=False, watchers={} ) - Whether to display the plot title.
-
param String
title( allow_None=False, basestring=<class ‘str’>, constant=False, default={label} {group} {dimensions}, instantiate=False, pickle_default_value=True, precedence=None, readonly=False, regex=None, watchers={} ) - The formatting string for the title of this plot, allows defining a label group separator and dimension labels.
-
param String
title_format( allow_None=True, basestring=<class ‘str’>, constant=False, default=None, instantiate=False, pickle_default_value=True, precedence=None, readonly=False, regex=None, watchers={} ) - Alias for title.
-
param Boolean
normalize( allow_None=False, bounds=(0, 1), constant=False, default=True, instantiate=False, pickle_default_value=True, precedence=None, readonly=False, watchers={} ) - Whether to compute ranges across all Elements at this level of plotting. Allows selecting normalization at different levels for nested data containers.
-
param Parameter
projection( allow_None=True, constant=False, default=None, instantiate=False, pickle_default_value=True, precedence=None, readonly=False, watchers={} ) - The projection of the plot axis, default of None is equivalent to 2D plot, ‘3d’ and ‘polar’ are also supported by matplotlib by default. May also supply a custom projection that is either a matplotlib projection type or implements the _as_mpl_axes method.
-
param Number
fig_alpha( allow_None=False, bounds=(0, 1), constant=False, default=1.0, inclusive_bounds=(True, True), instantiate=False, pickle_default_value=True, precedence=None, readonly=False, softbounds=None, time_dependent=False, time_fn=<Time Time00001>, watchers={} ) - Alpha of the overall figure background.
-
param NumericTuple
fig_bounds( allow_None=False, constant=False, default=(0.15, 0.15, 0.85, 0.85), instantiate=False, length=4, pickle_default_value=True, precedence=None, readonly=False, watchers={} ) - The bounds of the overall figure as a 4-tuple of the form (left, bottom, right, top), defining the size of the border around the subplots.
-
param Parameter
fig_inches( allow_None=False, constant=False, default=4, instantiate=False, pickle_default_value=True, precedence=None, readonly=False, watchers={} ) - The overall matplotlib figure size in inches. May be set as an integer in which case it will be used to autocompute a size. Alternatively may be set with an explicit tuple or list, in which case it will be applied directly after being scaled by fig_size. If either the width or height is set to None, it will be computed automatically.
-
param Boolean
fig_latex( allow_None=False, bounds=(0, 1), constant=False, default=False, instantiate=False, pickle_default_value=True, precedence=None, readonly=False, watchers={} ) - Whether to use LaTeX text in the overall figure.
-
param Dict
fig_rcparams( allow_None=False, constant=False, default={}, instantiate=True, is_instance=True, pickle_default_value=True, precedence=None, readonly=False, watchers={} ) - matplotlib rc parameters to apply to the overall figure.
-
param Number
fig_size( allow_None=False, bounds=(1, None), constant=False, default=100.0, inclusive_bounds=(True, True), instantiate=False, pickle_default_value=True, precedence=None, readonly=False, softbounds=None, time_dependent=False, time_fn=<Time Time00001>, watchers={} ) - Size relative to the supplied overall fig_inches in percent.
-
param HookList
initial_hooks( allow_None=False, bounds=(0, None), constant=False, default=[], instantiate=True, pickle_default_value=True, precedence=None, readonly=False, watchers={} ) - Optional list of hooks called before plotting the data onto the axis (now marked for deprecation). The hook is passed the plot object and the displayed object; other plotting handles can be accessed via plot.handles.
-
param HookList
finalize_hooks( allow_None=False, bounds=(0, None), constant=False, default=[], instantiate=True, pickle_default_value=True, precedence=None, readonly=False, watchers={} ) - Deprecated; use hooks options instead.
-
param HookList
hooks( allow_None=False, bounds=(0, None), constant=False, default=[], instantiate=True, pickle_default_value=True, precedence=None, readonly=False, watchers={} ) - Optional list of hooks called when finalizing a plot. The hook is passed the plot object and the displayed element, and other plotting handles can be accessed via plot.handles.
-
param String
sublabel_format( allow_None=True, basestring=<class ‘str’>, constant=False, default=None, instantiate=False, pickle_default_value=True, precedence=None, readonly=False, regex=None, watchers={} ) - Allows labeling the subaxes in each plot with various formatters including {Alpha}, {alpha}, {numeric} and {roman}.
-
param NumericTuple
sublabel_position( allow_None=False, constant=False, default=(-0.35, 0.85), instantiate=False, length=2, pickle_default_value=True, precedence=None, readonly=False, watchers={} ) - Position relative to the plot for placing the optional subfigure label.
-
param Number
sublabel_size( allow_None=False, bounds=None, constant=False, default=18, inclusive_bounds=(True, True), instantiate=False, pickle_default_value=True, precedence=None, readonly=False, softbounds=None, time_dependent=False, time_fn=<Time Time00001>, watchers={} ) - Size of optional subfigure label.
-
param Boolean
show_frame( allow_None=False, bounds=(0, 1), constant=False, default=False, instantiate=False, pickle_default_value=True, precedence=None, readonly=False, watchers={} ) - Whether or not to show a complete frame around the plot.
-
param Boolean
apply_ranges( allow_None=False, bounds=(0, 1), constant=False, default=True, instantiate=False, pickle_default_value=True, precedence=None, readonly=False, watchers={} ) - Whether to compute the plot bounds from the data itself.
-
param Boolean
apply_extents( allow_None=False, bounds=(0, 1), constant=False, default=True, instantiate=False, pickle_default_value=True, precedence=None, readonly=False, watchers={} ) - Whether to apply extent overrides on the Elements
-
param ClassSelector
bgcolor( allow_None=True, constant=False, default=None, instantiate=True, is_instance=True, pickle_default_value=True, precedence=None, readonly=False, watchers={} ) - If set bgcolor overrides the background color of the axis.
-
param ClassSelector
default_span( allow_None=False, constant=False, default=2.0, instantiate=True, is_instance=True, pickle_default_value=True, precedence=None, readonly=False, watchers={} ) - Defines the span of an axis if the axis range is zero, i.e. if the lower and upper end of an axis are equal or no range is defined at all. For example if there is a single datapoint at 0 a default_span of 2.0 will result in axis ranges spanning from -1 to 1.
-
param Boolean
invert_axes( allow_None=False, bounds=(0, 1), constant=False, default=False, instantiate=False, pickle_default_value=True, precedence=None, readonly=False, watchers={} ) - Whether to invert the x- and y-axis
-
param Boolean
invert_xaxis( allow_None=False, bounds=(0, 1), constant=False, default=False, instantiate=False, pickle_default_value=True, precedence=None, readonly=False, watchers={} ) - Whether to invert the plot x-axis.
-
param Boolean
invert_yaxis( allow_None=False, bounds=(0, 1), constant=False, default=False, instantiate=False, pickle_default_value=True, precedence=None, readonly=False, watchers={} ) - Whether to invert the plot y-axis.
-
param Boolean
logx( allow_None=False, bounds=(0, 1), constant=False, default=False, instantiate=False, pickle_default_value=True, precedence=None, readonly=False, watchers={} ) - Whether the x-axis of the plot will be a log axis.
-
param Boolean
logy( allow_None=False, bounds=(0, 1), constant=False, default=False, instantiate=False, pickle_default_value=True, precedence=None, readonly=False, watchers={} ) - Whether the y-axis of the plot will be a log axis.
-
param ClassSelector
padding( allow_None=False, constant=False, default=0, instantiate=True, is_instance=True, pickle_default_value=True, precedence=None, readonly=False, watchers={} ) - Fraction by which to increase auto-ranged extents to make datapoints more visible around borders. To compute padding, the axis whose screen size is largest is chosen, and the range of that axis is increased by the specified fraction along each axis. Other axes are then padded ensuring that the amount of screen space devoted to padding is equal for all axes. If specified as a tuple, the int or float values in the tuple will be used for padding in each axis, in order (x,y or x,y,z). For example, for padding=0.2 on a 800x800-pixel plot, an x-axis with the range [0,10] will be padded by 20% to be [-1,11], while a y-axis with a range [0,1000] will be padded to be [-100,1100], which should make the padding be approximately the same number of pixels. But if the same plot is changed to have a height of only 200, the y-range will then be [-400,1400] so that the y-axis padding will still match that of the x-axis. It is also possible to declare non-equal padding value for the lower and upper bound of an axis by supplying nested tuples, e.g. padding=(0.1, (0, 0.1)) will pad the x-axis lower and upper bound as well as the y-axis upper bound by a fraction of 0.1 while the y-axis lower bound is not padded at all.
-
param Boolean
show_legend( allow_None=False, bounds=(0, 1), constant=False, default=True, instantiate=False, pickle_default_value=True, precedence=None, readonly=False, watchers={} ) - Whether to show legend for the plot.
-
param Boolean
show_grid( allow_None=False, bounds=(0, 1), constant=False, default=False, instantiate=False, pickle_default_value=True, precedence=None, readonly=False, watchers={} ) - Whether to draw grid lines at the tick positions.
-
param ObjectSelector
xaxis( allow_None=None, check_on_set=True, compute_default_fn=None, constant=False, default=bottom, instantiate=False, names=None, objects=[‘top’, ‘bottom’, ‘bare’, ‘top-bare’, ‘bottom-bare’, None, True, False], pickle_default_value=True, precedence=None, readonly=False, watchers={} ) - Whether and where to display the xaxis. The “bare” options allow suppressing all axis labels, including ticks and xlabel. Valid options are ‘top’, ‘bottom’, ‘bare’, ‘top-bare’ and ‘bottom-bare’.
-
param ObjectSelector
yaxis( allow_None=None, check_on_set=True, compute_default_fn=None, constant=False, default=left, instantiate=False, names=None, objects=[‘left’, ‘right’, ‘bare’, ‘left-bare’, ‘right-bare’, None, True, False], pickle_default_value=True, precedence=None, readonly=False, watchers={} ) - Whether and where to display the yaxis. The “bare” options allow suppressing all axis labels, including ticks and ylabel. Valid options are ‘left’, ‘right’, ‘bare’, ‘left-bare’ and ‘right-bare’.
-
param String
xlabel( allow_None=True, basestring=<class ‘str’>, constant=False, default=None, instantiate=False, pickle_default_value=True, precedence=None, readonly=False, regex=None, watchers={} ) - An explicit override of the x-axis label, if set takes precedence over the dimension label.
-
param String
ylabel( allow_None=True, basestring=<class ‘str’>, constant=False, default=None, instantiate=False, pickle_default_value=True, precedence=None, readonly=False, regex=None, watchers={} ) - An explicit override of the y-axis label, if set takes precedence over the dimension label.
-
param NumericTuple
xlim( allow_None=False, constant=False, default=(nan, nan), instantiate=False, length=2, pickle_default_value=True, precedence=None, readonly=False, watchers={} ) - User-specified x-axis range limits for the plot, as a tuple (low,high). If specified, takes precedence over data and dimension ranges.
-
param NumericTuple
ylim( allow_None=False, constant=False, default=(nan, nan), instantiate=False, length=2, pickle_default_value=True, precedence=None, readonly=False, watchers={} ) - User-specified x-axis range limits for the plot, as a tuple (low,high). If specified, takes precedence over data and dimension ranges.
-
param NumericTuple
zlim( allow_None=False, constant=False, default=(nan, nan), instantiate=False, length=2, pickle_default_value=True, precedence=None, readonly=False, watchers={} ) - User-specified z-axis range limits for the plot, as a tuple (low,high). If specified, takes precedence over data and dimension ranges.
-
param Integer
xrotation( allow_None=True, bounds=(0, 360), constant=False, default=None, inclusive_bounds=(True, True), instantiate=False, pickle_default_value=True, precedence=None, readonly=False, softbounds=None, time_dependent=False, time_fn=<Time Time00001>, watchers={} ) - Rotation angle of the xticks.
-
param Integer
yrotation( allow_None=True, bounds=(0, 360), constant=False, default=None, inclusive_bounds=(True, True), instantiate=False, pickle_default_value=True, precedence=None, readonly=False, softbounds=None, time_dependent=False, time_fn=<Time Time00001>, watchers={} ) - Rotation angle of the yticks.
-
param Parameter
xticks( allow_None=True, constant=False, default=None, instantiate=False, pickle_default_value=True, precedence=None, readonly=False, watchers={} ) - Ticks along x-axis specified as an integer, explicit list of tick locations, or bokeh Ticker object. If set to None default bokeh ticking behavior is applied.
-
param Parameter
yticks( allow_None=True, constant=False, default=None, instantiate=False, pickle_default_value=True, precedence=None, readonly=False, watchers={} ) - Ticks along y-axis specified as an integer, explicit list of tick locations, or bokeh Ticker object. If set to None default bokeh ticking behavior is applied.
-
param Boolean
apply_ticks( allow_None=False, bounds=(0, 1), constant=False, default=True, instantiate=False, pickle_default_value=True, precedence=None, readonly=False, watchers={} ) - Whether to apply custom ticks.
-
param Parameter
aspect( allow_None=False, constant=False, default=square, instantiate=False, pickle_default_value=True, precedence=None, readonly=False, watchers={} ) - The aspect ratio mode of the plot. By default, a plot may select its own appropriate aspect ratio but sometimes it may be necessary to force a square aspect ratio (e.g. to display the plot as an element of a grid). The modes ‘auto’ and ‘equal’ correspond to the axis modes of the same name in matplotlib, a numeric value may also be passed.
-
param Boolean
invert_zaxis( allow_None=False, bounds=(0, 1), constant=False, default=False, instantiate=False, pickle_default_value=True, precedence=None, readonly=False, watchers={} ) - Whether to invert the plot z-axis.
-
param List
labelled( allow_None=False, bounds=(0, None), constant=False, default=[‘x’, ‘y’], instantiate=True, pickle_default_value=True, precedence=None, readonly=False, watchers={} ) - Whether to plot the ‘x’ and ‘y’ labels.
-
param Boolean
logz( allow_None=False, bounds=(0, 1), constant=False, default=False, instantiate=False, pickle_default_value=True, precedence=None, readonly=False, watchers={} ) - Whether to apply log scaling to the y-axis of the Chart.
-
param ClassSelector
xformatter( allow_None=True, constant=False, default=None, instantiate=True, is_instance=True, pickle_default_value=True, precedence=None, readonly=False, watchers={} ) - Formatter for ticks along the x-axis.
-
param ClassSelector
yformatter( allow_None=True, constant=False, default=None, instantiate=True, is_instance=True, pickle_default_value=True, precedence=None, readonly=False, watchers={} ) - Formatter for ticks along the y-axis.
-
param ClassSelector
zformatter( allow_None=True, constant=False, default=None, instantiate=True, is_instance=True, pickle_default_value=True, precedence=None, readonly=False, watchers={} ) - Formatter for ticks along the z-axis.
-
param Boolean
zaxis( allow_None=False, bounds=(0, 1), constant=False, default=True, instantiate=False, pickle_default_value=True, precedence=None, readonly=False, watchers={} ) - Whether to display the z-axis.
-
param String
zlabel( allow_None=True, basestring=<class ‘str’>, constant=False, default=None, instantiate=False, pickle_default_value=True, precedence=None, readonly=False, regex=None, watchers={} ) - An explicit override of the z-axis label, if set takes precedence over the dimension label.
-
param Integer
zrotation( allow_None=False, bounds=(0, 360), constant=False, default=0, inclusive_bounds=(True, True), instantiate=False, pickle_default_value=True, precedence=None, readonly=False, softbounds=None, time_dependent=False, time_fn=<Time Time00001>, watchers={} ) - Rotation angle of the zticks.
-
param Parameter
zticks( allow_None=True, constant=False, default=None, instantiate=False, pickle_default_value=True, precedence=None, readonly=False, watchers={} ) - Ticks along z-axis specified as an integer, explicit list of tick locations, list of tuples containing the locations and labels or a matplotlib tick locator object. If set to None default matplotlib ticking behavior is applied.
-
param Boolean
colorbar( allow_None=False, bounds=(0, 1), constant=False, default=False, instantiate=False, pickle_default_value=True, precedence=None, readonly=False, watchers={} ) - Whether to draw a colorbar.
-
param ClassSelector
color_levels( allow_None=True, constant=False, default=None, instantiate=True, is_instance=True, pickle_default_value=True, precedence=None, readonly=False, watchers={} ) - Number of discrete colors to use when colormapping or a set of color intervals defining the range of values to map each color to.
-
param Dict
clipping_colors( allow_None=False, constant=False, default={}, instantiate=True, is_instance=True, pickle_default_value=True, precedence=None, readonly=False, watchers={} ) - Dictionary to specify colors for clipped values, allows setting color for NaN values and for values above and below the min and max value. The min, max or NaN color may specify an RGB(A) color as a color hex string of the form #FFFFFF or #FFFFFFFF or a length 3 or length 4 tuple specifying values in the range 0-1 or a named HTML color.
-
param Number
cbar_padding( allow_None=False, bounds=None, constant=False, default=0.01, inclusive_bounds=(True, True), instantiate=False, pickle_default_value=True, precedence=None, readonly=False, softbounds=None, time_dependent=False, time_fn=<Time Time00001>, watchers={} ) - Padding between colorbar and other plots.
-
param Parameter
cbar_ticks( allow_None=True, constant=False, default=None, instantiate=False, pickle_default_value=True, precedence=None, readonly=False, watchers={} ) - Ticks along colorbar-axis specified as an integer, explicit list of tick locations, list of tuples containing the locations and labels or a matplotlib tick locator object. If set to None default matplotlib ticking behavior is applied.
-
param Number
cbar_width( allow_None=False, bounds=None, constant=False, default=0.05, inclusive_bounds=(True, True), instantiate=False, pickle_default_value=True, precedence=None, readonly=False, softbounds=None, time_dependent=False, time_fn=<Time Time00001>, watchers={} ) - Width of the colorbar as a fraction of the main plot
-
param Boolean
symmetric( allow_None=False, bounds=(0, 1), constant=False, default=False, instantiate=False, pickle_default_value=True, precedence=None, readonly=False, watchers={} ) - Whether to make the colormap symmetric around zero.
-
param ClassSelector
color_index( allow_None=True, constant=False, default=None, instantiate=True, is_instance=True, pickle_default_value=True, precedence=None, readonly=False, watchers={} ) - Deprecated in favor of color style mapping, e.g. color=dim(‘color’)
-
param ClassSelector
size_index( allow_None=True, constant=False, default=None, instantiate=True, is_instance=True, pickle_default_value=True, precedence=None, readonly=False, watchers={} ) - Deprecated in favor of size style mapping, e.g. size=dim(‘size’)
-
param ObjectSelector
scaling_method( allow_None=None, check_on_set=True, compute_default_fn=None, constant=False, default=area, instantiate=False, names=None, objects=[‘width’, ‘area’], pickle_default_value=True, precedence=None, readonly=False, watchers={} ) - Deprecated in favor of size style mapping, e.g. size=dim(‘size’)**2.
-
param Number
scaling_factor( allow_None=False, bounds=(0, None), constant=False, default=1, inclusive_bounds=(True, True), instantiate=False, pickle_default_value=True, precedence=None, readonly=False, softbounds=None, time_dependent=False, time_fn=<Time Time00001>, watchers={} ) - Scaling factor which is applied to either the width or area of each point, depending on the value of scaling_method .
-
param Callable
size_fn( allow_None=False, constant=False, default=<ufunc ‘absolute’>, instantiate=False, pickle_default_value=True, precedence=None, readonly=False, watchers={} ) - Function applied to size values before applying scaling, to remove values lower than zero.
-
anim( start=0 , stop=None , fps=30 ) ¶ -
Method to return a matplotlib animation. The start and stop frames may be specified as well as the fps.
-
cleanup( ) ¶ -
Cleans up references to the plot on the attached Stream subscribers.
-
compute_ranges( obj , key , ranges ) ¶ -
Given an object, a specific key, and the normalization options, this method will find the specified normalization options on the appropriate OptionTree, group the elements according to the selected normalization option (i.e. either per frame or over the whole animation) and finally compute the dimension ranges in each group. The new set of ranges is returned.
-
debug( *args , **kwargs ) ¶ -
Inspect .param.debug method for the full docstring
-
defaults( *args , **kwargs ) ¶ -
Inspect .param.defaults method for the full docstring
-
force_new_dynamic_value= functools.partial(<function Parameters.deprecate.<locals>.inner>, <class 'holoviews.plotting.mpl.chart.PointPlot'>) 
-
get_aspect( xspan , yspan ) ¶ -
Computes the aspect ratio of the plot
-
get_extents( element , ranges , range_type='combined' , xdim=None , ydim=None , zdim=None ) ¶ -
Gets the extents for the axes from the current Element. The globally computed ranges can optionally override the extents.
The extents are computed by combining the data ranges, extents and dimension ranges. Each of these can be obtained individually by setting the range_type to one of:
- ‘data’: Just the data ranges
- ‘extents’: Element.extents
- ‘soft’: Dimension.soft_range values
- ‘hard’: Dimension.range values
To obtain the combined range, which includes range padding the default may be used:
- ‘combined’: All the range types combined and padding applied
This allows Overlay plots to obtain each range and combine them appropriately for all the objects in the overlay.
-
get_padding( extents ) ¶ -
Computes padding along the axes taking into account the plot aspect.
-
get_param_values= functools.partial(<function Parameters.deprecate.<locals>.inner>, <class 'holoviews.plotting.mpl.chart.PointPlot'>) 
-
get_value_generator= functools.partial(<function Parameters.deprecate.<locals>.inner>, <class 'holoviews.plotting.mpl.chart.PointPlot'>) 
-
get_zorder( overlay , key , el ) ¶ -
Computes the z-order of element in the NdOverlay taking into account possible batching of elements.
-
init_artists( ax , plot_args , plot_kwargs ) ¶ -
Initializes the artist based on the plot method declared on the plot.
-
init_comm( ) ¶ -
Initializes comm and attaches streams.
-
inspect_value= functools.partial(<function Parameters.deprecate.<locals>.inner>, <class 'holoviews.plotting.mpl.chart.PointPlot'>) 
-
matches( spec ) ¶ -
Matches a specification against the current Plot.
-
message( *args , **kwargs ) ¶ -
Inspect .param.message method for the full docstring
-
params( *args , **kwargs ) ¶ -
Inspect .param.params method for the full docstring
-
pprint( imports=None , prefix=' ' , unknown_value='<?>' , qualify=False , separator='' ) ¶ -
(Experimental) Pretty printed representation that may be evaluated with eval. See pprint() function for more details.
-
print_param_defaults( *args , **kwargs ) ¶ -
Inspect .param.print_param_defaults method for the full docstring
-
print_param_values( *args , **kwargs ) ¶ -
Inspect .param.print_param_values method for the full docstring
-
push( ) ¶ -
Pushes updated plot data via the Comm.
-
refresh( **kwargs ) ¶ -
Refreshes the plot by rerendering it and then pushing the updated data if the plot has an associated Comm.
-
script_repr( imports=[] , prefix=' ' ) ¶ -
Variant of __repr__ designed for generating a runnable script.
-
set_default( *args , **kwargs ) ¶ -
Inspect .param.set_default method for the full docstring
-
set_dynamic_time_fn= functools.partial(<function Parameters.deprecate.<locals>.inner>, <class 'holoviews.plotting.mpl.chart.PointPlot'>) 
-
set_param= functools.partial(<function Parameters.deprecate.<locals>.inner>, <class 'holoviews.plotting.mpl.chart.PointPlot'>) 
-
size_fn= <ufunc 'absolute'> 
-
state_pop( ) ¶ -
Restore the most recently saved state.
See state_push() for more details.
-
state_push( ) ¶ -
Save this instance’s state.
For Parameterized instances, this includes the state of dynamically generated values.
Subclasses that maintain short-term state should additionally save and restore that state using state_push() and state_pop().
Generally, this method is used by operations that need to test something without permanently altering the objects’ state.
-
teardown_handles( ) ¶ -
If no custom update_handles method is supplied this method is called to tear down any previous handles before replacing them.
-
traverse( fn=None , specs=None , full_breadth=True ) ¶ -
Traverses any nested DimensionedPlot returning a list of all plots that match the specs. The specs should be supplied as a list of either Plot types or callables, which should return a boolean given the plot class.
-
verbose( *args , **kwargs ) ¶ -
Inspect .param.verbose method for the full docstring
-
warning( *args , **kwargs ) ¶ -
Inspect .param.warning method for the full docstring
-
param Parameter
-
class
holoviews.plotting.mpl.chart.SpreadPlot( element , **params ) [source] ¶ -
Bases:
holoviews.plotting.mpl.chart.AreaPlotSpreadPlot plots the Spread Element type.
-
param Parameter
fontsize( allow_None=True, constant=False, default=None, instantiate=False, pickle_default_value=True, precedence=None, readonly=False, watchers={} ) - Specifies various font sizes of the displayed text. Finer control is available by supplying a dictionary where any unmentioned keys revert to the default sizes, e.g: {‘ticks’:20, ‘title’:15, ‘ylabel’:5, ‘xlabel’:5, ‘zlabel’:5, ‘legend’:8, ‘legend_title’:13} You can set the font size of ‘zlabel’, ‘ylabel’ and ‘xlabel’ together using the ‘labels’ key.
-
param Boolean
show_title( allow_None=False, bounds=(0, 1), constant=False, default=True, instantiate=False, pickle_default_value=True, precedence=None, readonly=False, watchers={} ) - Whether to display the plot title.
-
param String
title( allow_None=False, basestring=<class ‘str’>, constant=False, default={label} {group} {dimensions}, instantiate=False, pickle_default_value=True, precedence=None, readonly=False, regex=None, watchers={} ) - The formatting string for the title of this plot, allows defining a label group separator and dimension labels.
-
param String
title_format( allow_None=True, basestring=<class ‘str’>, constant=False, default=None, instantiate=False, pickle_default_value=True, precedence=None, readonly=False, regex=None, watchers={} ) - Alias for title.
-
param Boolean
normalize( allow_None=False, bounds=(0, 1), constant=False, default=True, instantiate=False, pickle_default_value=True, precedence=None, readonly=False, watchers={} ) - Whether to compute ranges across all Elements at this level of plotting. Allows selecting normalization at different levels for nested data containers.
-
param Parameter
projection( allow_None=True, constant=False, default=None, instantiate=False, pickle_default_value=True, precedence=None, readonly=False, watchers={} ) - The projection of the plot axis, default of None is equivalent to 2D plot, ‘3d’ and ‘polar’ are also supported by matplotlib by default. May also supply a custom projection that is either a matplotlib projection type or implements the _as_mpl_axes method.
-
param Number
fig_alpha( allow_None=False, bounds=(0, 1), constant=False, default=1.0, inclusive_bounds=(True, True), instantiate=False, pickle_default_value=True, precedence=None, readonly=False, softbounds=None, time_dependent=False, time_fn=<Time Time00001>, watchers={} ) - Alpha of the overall figure background.
-
param NumericTuple
fig_bounds( allow_None=False, constant=False, default=(0.15, 0.15, 0.85, 0.85), instantiate=False, length=4, pickle_default_value=True, precedence=None, readonly=False, watchers={} ) - The bounds of the overall figure as a 4-tuple of the form (left, bottom, right, top), defining the size of the border around the subplots.
-
param Parameter
fig_inches( allow_None=False, constant=False, default=4, instantiate=False, pickle_default_value=True, precedence=None, readonly=False, watchers={} ) - The overall matplotlib figure size in inches. May be set as an integer in which case it will be used to autocompute a size. Alternatively may be set with an explicit tuple or list, in which case it will be applied directly after being scaled by fig_size. If either the width or height is set to None, it will be computed automatically.
-
param Boolean
fig_latex( allow_None=False, bounds=(0, 1), constant=False, default=False, instantiate=False, pickle_default_value=True, precedence=None, readonly=False, watchers={} ) - Whether to use LaTeX text in the overall figure.
-
param Dict
fig_rcparams( allow_None=False, constant=False, default={}, instantiate=True, is_instance=True, pickle_default_value=True, precedence=None, readonly=False, watchers={} ) - matplotlib rc parameters to apply to the overall figure.
-
param Number
fig_size( allow_None=False, bounds=(1, None), constant=False, default=100.0, inclusive_bounds=(True, True), instantiate=False, pickle_default_value=True, precedence=None, readonly=False, softbounds=None, time_dependent=False, time_fn=<Time Time00001>, watchers={} ) - Size relative to the supplied overall fig_inches in percent.
-
param HookList
initial_hooks( allow_None=False, bounds=(0, None), constant=False, default=[], instantiate=True, pickle_default_value=True, precedence=None, readonly=False, watchers={} ) - Optional list of hooks called before plotting the data onto the axis (now marked for deprecation). The hook is passed the plot object and the displayed object; other plotting handles can be accessed via plot.handles.
-
param HookList
finalize_hooks( allow_None=False, bounds=(0, None), constant=False, default=[], instantiate=True, pickle_default_value=True, precedence=None, readonly=False, watchers={} ) - Deprecated; use hooks options instead.
-
param HookList
hooks( allow_None=False, bounds=(0, None), constant=False, default=[], instantiate=True, pickle_default_value=True, precedence=None, readonly=False, watchers={} ) - Optional list of hooks called when finalizing a plot. The hook is passed the plot object and the displayed element, and other plotting handles can be accessed via plot.handles.
-
param String
sublabel_format( allow_None=True, basestring=<class ‘str’>, constant=False, default=None, instantiate=False, pickle_default_value=True, precedence=None, readonly=False, regex=None, watchers={} ) - Allows labeling the subaxes in each plot with various formatters including {Alpha}, {alpha}, {numeric} and {roman}.
-
param NumericTuple
sublabel_position( allow_None=False, constant=False, default=(-0.35, 0.85), instantiate=False, length=2, pickle_default_value=True, precedence=None, readonly=False, watchers={} ) - Position relative to the plot for placing the optional subfigure label.
-
param Number
sublabel_size( allow_None=False, bounds=None, constant=False, default=18, inclusive_bounds=(True, True), instantiate=False, pickle_default_value=True, precedence=None, readonly=False, softbounds=None, time_dependent=False, time_fn=<Time Time00001>, watchers={} ) - Size of optional subfigure label.
-
param Boolean
show_frame( allow_None=False, bounds=(0, 1), constant=False, default=False, instantiate=False, pickle_default_value=True, precedence=None, readonly=False, watchers={} ) - Whether or not to show a complete frame around the plot.
-
param Boolean
apply_ranges( allow_None=False, bounds=(0, 1), constant=False, default=True, instantiate=False, pickle_default_value=True, precedence=None, readonly=False, watchers={} ) - Whether to compute the plot bounds from the data itself.
-
param Boolean
apply_extents( allow_None=False, bounds=(0, 1), constant=False, default=True, instantiate=False, pickle_default_value=True, precedence=None, readonly=False, watchers={} ) - Whether to apply extent overrides on the Elements
-
param ClassSelector
bgcolor( allow_None=True, constant=False, default=None, instantiate=True, is_instance=True, pickle_default_value=True, precedence=None, readonly=False, watchers={} ) - If set bgcolor overrides the background color of the axis.
-
param ClassSelector
default_span( allow_None=False, constant=False, default=2.0, instantiate=True, is_instance=True, pickle_default_value=True, precedence=None, readonly=False, watchers={} ) - Defines the span of an axis if the axis range is zero, i.e. if the lower and upper end of an axis are equal or no range is defined at all. For example if there is a single datapoint at 0 a default_span of 2.0 will result in axis ranges spanning from -1 to 1.
-
param Boolean
invert_axes( allow_None=False, bounds=(0, 1), constant=False, default=False, instantiate=False, pickle_default_value=True, precedence=None, readonly=False, watchers={} ) - Whether to invert the x- and y-axis
-
param Boolean
invert_xaxis( allow_None=False, bounds=(0, 1), constant=False, default=False, instantiate=False, pickle_default_value=True, precedence=None, readonly=False, watchers={} ) - Whether to invert the plot x-axis.
-
param Boolean
invert_yaxis( allow_None=False, bounds=(0, 1), constant=False, default=False, instantiate=False, pickle_default_value=True, precedence=None, readonly=False, watchers={} ) - Whether to invert the plot y-axis.
-
param Boolean
logx( allow_None=False, bounds=(0, 1), constant=False, default=False, instantiate=False, pickle_default_value=True, precedence=None, readonly=False, watchers={} ) - Whether the x-axis of the plot will be a log axis.
-
param Boolean
logy( allow_None=False, bounds=(0, 1), constant=False, default=False, instantiate=False, pickle_default_value=True, precedence=None, readonly=False, watchers={} ) - Whether the y-axis of the plot will be a log axis.
-
param ClassSelector
padding( allow_None=False, constant=False, default=0, instantiate=True, is_instance=True, pickle_default_value=True, precedence=None, readonly=False, watchers={} ) - Fraction by which to increase auto-ranged extents to make datapoints more visible around borders. To compute padding, the axis whose screen size is largest is chosen, and the range of that axis is increased by the specified fraction along each axis. Other axes are then padded ensuring that the amount of screen space devoted to padding is equal for all axes. If specified as a tuple, the int or float values in the tuple will be used for padding in each axis, in order (x,y or x,y,z). For example, for padding=0.2 on a 800x800-pixel plot, an x-axis with the range [0,10] will be padded by 20% to be [-1,11], while a y-axis with a range [0,1000] will be padded to be [-100,1100], which should make the padding be approximately the same number of pixels. But if the same plot is changed to have a height of only 200, the y-range will then be [-400,1400] so that the y-axis padding will still match that of the x-axis. It is also possible to declare non-equal padding value for the lower and upper bound of an axis by supplying nested tuples, e.g. padding=(0.1, (0, 0.1)) will pad the x-axis lower and upper bound as well as the y-axis upper bound by a fraction of 0.1 while the y-axis lower bound is not padded at all.
-
param Boolean
show_legend( allow_None=False, bounds=(0, 1), constant=False, default=False, instantiate=False, pickle_default_value=True, precedence=None, readonly=False, watchers={} ) - Whether to show legend for the plot.
-
param Boolean
show_grid( allow_None=False, bounds=(0, 1), constant=False, default=False, instantiate=False, pickle_default_value=True, precedence=None, readonly=False, watchers={} ) - Whether to show a Cartesian grid on the plot.
-
param ObjectSelector
xaxis( allow_None=None, check_on_set=True, compute_default_fn=None, constant=False, default=bottom, instantiate=False, names=None, objects=[‘top’, ‘bottom’, ‘bare’, ‘top-bare’, ‘bottom-bare’, None, True, False], pickle_default_value=True, precedence=None, readonly=False, watchers={} ) - Whether and where to display the xaxis. The “bare” options allow suppressing all axis labels, including ticks and xlabel. Valid options are ‘top’, ‘bottom’, ‘bare’, ‘top-bare’ and ‘bottom-bare’.
-
param ObjectSelector
yaxis( allow_None=None, check_on_set=True, compute_default_fn=None, constant=False, default=left, instantiate=False, names=None, objects=[‘left’, ‘right’, ‘bare’, ‘left-bare’, ‘right-bare’, None, True, False], pickle_default_value=True, precedence=None, readonly=False, watchers={} ) - Whether and where to display the yaxis. The “bare” options allow suppressing all axis labels, including ticks and ylabel. Valid options are ‘left’, ‘right’, ‘bare’, ‘left-bare’ and ‘right-bare’.
-
param String
xlabel( allow_None=True, basestring=<class ‘str’>, constant=False, default=None, instantiate=False, pickle_default_value=True, precedence=None, readonly=False, regex=None, watchers={} ) - An explicit override of the x-axis label, if set takes precedence over the dimension label.
-
param String
ylabel( allow_None=True, basestring=<class ‘str’>, constant=False, default=None, instantiate=False, pickle_default_value=True, precedence=None, readonly=False, regex=None, watchers={} ) - An explicit override of the y-axis label, if set takes precedence over the dimension label.
-
param NumericTuple
xlim( allow_None=False, constant=False, default=(nan, nan), instantiate=False, length=2, pickle_default_value=True, precedence=None, readonly=False, watchers={} ) - User-specified x-axis range limits for the plot, as a tuple (low,high). If specified, takes precedence over data and dimension ranges.
-
param NumericTuple
ylim( allow_None=False, constant=False, default=(nan, nan), instantiate=False, length=2, pickle_default_value=True, precedence=None, readonly=False, watchers={} ) - User-specified x-axis range limits for the plot, as a tuple (low,high). If specified, takes precedence over data and dimension ranges.
-
param NumericTuple
zlim( allow_None=False, constant=False, default=(nan, nan), instantiate=False, length=2, pickle_default_value=True, precedence=None, readonly=False, watchers={} ) - User-specified z-axis range limits for the plot, as a tuple (low,high). If specified, takes precedence over data and dimension ranges.
-
param Integer
xrotation( allow_None=True, bounds=(0, 360), constant=False, default=None, inclusive_bounds=(True, True), instantiate=False, pickle_default_value=True, precedence=None, readonly=False, softbounds=None, time_dependent=False, time_fn=<Time Time00001>, watchers={} ) - Rotation angle of the xticks.
-
param Integer
yrotation( allow_None=True, bounds=(0, 360), constant=False, default=None, inclusive_bounds=(True, True), instantiate=False, pickle_default_value=True, precedence=None, readonly=False, softbounds=None, time_dependent=False, time_fn=<Time Time00001>, watchers={} ) - Rotation angle of the yticks.
-
param Parameter
xticks( allow_None=True, constant=False, default=None, instantiate=False, pickle_default_value=True, precedence=None, readonly=False, watchers={} ) - Ticks along x-axis specified as an integer, explicit list of tick locations, or bokeh Ticker object. If set to None default bokeh ticking behavior is applied.
-
param Parameter
yticks( allow_None=True, constant=False, default=None, instantiate=False, pickle_default_value=True, precedence=None, readonly=False, watchers={} ) - Ticks along y-axis specified as an integer, explicit list of tick locations, or bokeh Ticker object. If set to None default bokeh ticking behavior is applied.
-
param Boolean
apply_ticks( allow_None=False, bounds=(0, 1), constant=False, default=True, instantiate=False, pickle_default_value=True, precedence=None, readonly=False, watchers={} ) - Whether to apply custom ticks.
-
param Parameter
aspect( allow_None=False, constant=False, default=square, instantiate=False, pickle_default_value=True, precedence=None, readonly=False, watchers={} ) - The aspect ratio mode of the plot. By default, a plot may select its own appropriate aspect ratio but sometimes it may be necessary to force a square aspect ratio (e.g. to display the plot as an element of a grid). The modes ‘auto’ and ‘equal’ correspond to the axis modes of the same name in matplotlib, a numeric value may also be passed.
-
param Boolean
invert_zaxis( allow_None=False, bounds=(0, 1), constant=False, default=False, instantiate=False, pickle_default_value=True, precedence=None, readonly=False, watchers={} ) - Whether to invert the plot z-axis.
-
param List
labelled( allow_None=False, bounds=(0, None), constant=False, default=[‘x’, ‘y’], instantiate=True, pickle_default_value=True, precedence=None, readonly=False, watchers={} ) - Whether to plot the ‘x’ and ‘y’ labels.
-
param Boolean
logz( allow_None=False, bounds=(0, 1), constant=False, default=False, instantiate=False, pickle_default_value=True, precedence=None, readonly=False, watchers={} ) - Whether to apply log scaling to the y-axis of the Chart.
-
param ClassSelector
xformatter( allow_None=True, constant=False, default=None, instantiate=True, is_instance=True, pickle_default_value=True, precedence=None, readonly=False, watchers={} ) - Formatter for ticks along the x-axis.
-
param ClassSelector
yformatter( allow_None=True, constant=False, default=None, instantiate=True, is_instance=True, pickle_default_value=True, precedence=None, readonly=False, watchers={} ) - Formatter for ticks along the y-axis.
-
param ClassSelector
zformatter( allow_None=True, constant=False, default=None, instantiate=True, is_instance=True, pickle_default_value=True, precedence=None, readonly=False, watchers={} ) - Formatter for ticks along the z-axis.
-
param Boolean
zaxis( allow_None=False, bounds=(0, 1), constant=False, default=True, instantiate=False, pickle_default_value=True, precedence=None, readonly=False, watchers={} ) - Whether to display the z-axis.
-
param String
zlabel( allow_None=True, basestring=<class ‘str’>, constant=False, default=None, instantiate=False, pickle_default_value=True, precedence=None, readonly=False, regex=None, watchers={} ) - An explicit override of the z-axis label, if set takes precedence over the dimension label.
-
param Integer
zrotation( allow_None=False, bounds=(0, 360), constant=False, default=0, inclusive_bounds=(True, True), instantiate=False, pickle_default_value=True, precedence=None, readonly=False, softbounds=None, time_dependent=False, time_fn=<Time Time00001>, watchers={} ) - Rotation angle of the zticks.
-
param Parameter
zticks( allow_None=True, constant=False, default=None, instantiate=False, pickle_default_value=True, precedence=None, readonly=False, watchers={} ) - Ticks along z-axis specified as an integer, explicit list of tick locations, list of tuples containing the locations and labels or a matplotlib tick locator object. If set to None default matplotlib ticking behavior is applied.
-
anim( start=0 , stop=None , fps=30 ) ¶ -
Method to return a matplotlib animation. The start and stop frames may be specified as well as the fps.
-
cleanup( ) ¶ -
Cleans up references to the plot on the attached Stream subscribers.
-
compute_ranges( obj , key , ranges ) ¶ -
Given an object, a specific key, and the normalization options, this method will find the specified normalization options on the appropriate OptionTree, group the elements according to the selected normalization option (i.e. either per frame or over the whole animation) and finally compute the dimension ranges in each group. The new set of ranges is returned.
-
debug( *args , **kwargs ) ¶ -
Inspect .param.debug method for the full docstring
-
defaults( *args , **kwargs ) ¶ -
Inspect .param.defaults method for the full docstring
-
force_new_dynamic_value= functools.partial(<function Parameters.deprecate.<locals>.inner>, <class 'holoviews.plotting.mpl.chart.SpreadPlot'>) 
-
get_aspect( xspan , yspan ) ¶ -
Computes the aspect ratio of the plot
-
get_padding( extents ) ¶ -
Computes padding along the axes taking into account the plot aspect.
-
get_param_values= functools.partial(<function Parameters.deprecate.<locals>.inner>, <class 'holoviews.plotting.mpl.chart.SpreadPlot'>) 
-
get_value_generator= functools.partial(<function Parameters.deprecate.<locals>.inner>, <class 'holoviews.plotting.mpl.chart.SpreadPlot'>) 
-
get_zorder( overlay , key , el ) ¶ -
Computes the z-order of element in the NdOverlay taking into account possible batching of elements.
-
init_comm( ) ¶ -
Initializes comm and attaches streams.
-
inspect_value= functools.partial(<function Parameters.deprecate.<locals>.inner>, <class 'holoviews.plotting.mpl.chart.SpreadPlot'>) 
-
matches( spec ) ¶ -
Matches a specification against the current Plot.
-
message( *args , **kwargs ) ¶ -
Inspect .param.message method for the full docstring
-
params( *args , **kwargs ) ¶ -
Inspect .param.params method for the full docstring
-
pprint( imports=None , prefix=' ' , unknown_value='<?>' , qualify=False , separator='' ) ¶ -
(Experimental) Pretty printed representation that may be evaluated with eval. See pprint() function for more details.
-
print_param_defaults( *args , **kwargs ) ¶ -
Inspect .param.print_param_defaults method for the full docstring
-
print_param_values( *args , **kwargs ) ¶ -
Inspect .param.print_param_values method for the full docstring
-
push( ) ¶ -
Pushes updated plot data via the Comm.
-
refresh( **kwargs ) ¶ -
Refreshes the plot by rerendering it and then pushing the updated data if the plot has an associated Comm.
-
script_repr( imports=[] , prefix=' ' ) ¶ -
Variant of __repr__ designed for generating a runnable script.
-
set_default( *args , **kwargs ) ¶ -
Inspect .param.set_default method for the full docstring
-
set_dynamic_time_fn= functools.partial(<function Parameters.deprecate.<locals>.inner>, <class 'holoviews.plotting.mpl.chart.SpreadPlot'>) 
-
set_param= functools.partial(<function Parameters.deprecate.<locals>.inner>, <class 'holoviews.plotting.mpl.chart.SpreadPlot'>) 
-
state_pop( ) ¶ -
Restore the most recently saved state.
See state_push() for more details.
-
state_push( ) ¶ -
Save this instance’s state.
For Parameterized instances, this includes the state of dynamically generated values.
Subclasses that maintain short-term state should additionally save and restore that state using state_push() and state_pop().
Generally, this method is used by operations that need to test something without permanently altering the objects’ state.
-
teardown_handles( ) ¶ -
If no custom update_handles method is supplied this method is called to tear down any previous handles before replacing them.
-
traverse( fn=None , specs=None , full_breadth=True ) ¶ -
Traverses any nested DimensionedPlot returning a list of all plots that match the specs. The specs should be supplied as a list of either Plot types or callables, which should return a boolean given the plot class.
-
update_handles( key , axis , element , ranges , style ) ¶ -
Update the elements of the plot.
-
verbose( *args , **kwargs ) ¶ -
Inspect .param.verbose method for the full docstring
-
warning( *args , **kwargs ) ¶ -
Inspect .param.warning method for the full docstring
-
param Parameter
-
class
holoviews.plotting.mpl.chart.VectorFieldPlot( *args , **kwargs ) [source] ¶ -
Bases:
holoviews.plotting.mpl.element.ColorbarPlotRenders vector fields in sheet coordinates. The vectors are expressed in polar coordinates and may be displayed according to angle alone (with some common, arbitrary arrow length) or may be true polar vectors.
The color or magnitude can be mapped onto any dimension using the color_index and size_index.
The length of the arrows is controlled by the ‘scale’ style option. The scaling of the arrows may also be controlled via the normalize_lengths and rescale_lengths plot option, which will normalize the lengths to a maximum of 1 and scale them according to the minimum distance respectively.
-
param Parameter
fontsize( allow_None=True, constant=False, default=None, instantiate=False, pickle_default_value=True, precedence=None, readonly=False, watchers={} ) - Specifies various font sizes of the displayed text. Finer control is available by supplying a dictionary where any unmentioned keys revert to the default sizes, e.g: {‘ticks’:20, ‘title’:15, ‘ylabel’:5, ‘xlabel’:5, ‘zlabel’:5, ‘legend’:8, ‘legend_title’:13} You can set the font size of ‘zlabel’, ‘ylabel’ and ‘xlabel’ together using the ‘labels’ key.
-
param Boolean
show_title( allow_None=False, bounds=(0, 1), constant=False, default=True, instantiate=False, pickle_default_value=True, precedence=None, readonly=False, watchers={} ) - Whether to display the plot title.
-
param String
title( allow_None=False, basestring=<class ‘str’>, constant=False, default={label} {group} {dimensions}, instantiate=False, pickle_default_value=True, precedence=None, readonly=False, regex=None, watchers={} ) - The formatting string for the title of this plot, allows defining a label group separator and dimension labels.
-
param String
title_format( allow_None=True, basestring=<class ‘str’>, constant=False, default=None, instantiate=False, pickle_default_value=True, precedence=None, readonly=False, regex=None, watchers={} ) - Alias for title.
-
param Boolean
normalize( allow_None=False, bounds=(0, 1), constant=False, default=True, instantiate=False, pickle_default_value=True, precedence=None, readonly=False, watchers={} ) - Whether to compute ranges across all Elements at this level of plotting. Allows selecting normalization at different levels for nested data containers.
-
param Parameter
projection( allow_None=True, constant=False, default=None, instantiate=False, pickle_default_value=True, precedence=None, readonly=False, watchers={} ) - The projection of the plot axis, default of None is equivalent to 2D plot, ‘3d’ and ‘polar’ are also supported by matplotlib by default. May also supply a custom projection that is either a matplotlib projection type or implements the _as_mpl_axes method.
-
param Number
fig_alpha( allow_None=False, bounds=(0, 1), constant=False, default=1.0, inclusive_bounds=(True, True), instantiate=False, pickle_default_value=True, precedence=None, readonly=False, softbounds=None, time_dependent=False, time_fn=<Time Time00001>, watchers={} ) - Alpha of the overall figure background.
-
param NumericTuple
fig_bounds( allow_None=False, constant=False, default=(0.15, 0.15, 0.85, 0.85), instantiate=False, length=4, pickle_default_value=True, precedence=None, readonly=False, watchers={} ) - The bounds of the overall figure as a 4-tuple of the form (left, bottom, right, top), defining the size of the border around the subplots.
-
param Parameter
fig_inches( allow_None=False, constant=False, default=4, instantiate=False, pickle_default_value=True, precedence=None, readonly=False, watchers={} ) - The overall matplotlib figure size in inches. May be set as an integer in which case it will be used to autocompute a size. Alternatively may be set with an explicit tuple or list, in which case it will be applied directly after being scaled by fig_size. If either the width or height is set to None, it will be computed automatically.
-
param Boolean
fig_latex( allow_None=False, bounds=(0, 1), constant=False, default=False, instantiate=False, pickle_default_value=True, precedence=None, readonly=False, watchers={} ) - Whether to use LaTeX text in the overall figure.
-
param Dict
fig_rcparams( allow_None=False, constant=False, default={}, instantiate=True, is_instance=True, pickle_default_value=True, precedence=None, readonly=False, watchers={} ) - matplotlib rc parameters to apply to the overall figure.
-
param Number
fig_size( allow_None=False, bounds=(1, None), constant=False, default=100.0, inclusive_bounds=(True, True), instantiate=False, pickle_default_value=True, precedence=None, readonly=False, softbounds=None, time_dependent=False, time_fn=<Time Time00001>, watchers={} ) - Size relative to the supplied overall fig_inches in percent.
-
param HookList
initial_hooks( allow_None=False, bounds=(0, None), constant=False, default=[], instantiate=True, pickle_default_value=True, precedence=None, readonly=False, watchers={} ) - Optional list of hooks called before plotting the data onto the axis (now marked for deprecation). The hook is passed the plot object and the displayed object; other plotting handles can be accessed via plot.handles.
-
param HookList
finalize_hooks( allow_None=False, bounds=(0, None), constant=False, default=[], instantiate=True, pickle_default_value=True, precedence=None, readonly=False, watchers={} ) - Deprecated; use hooks options instead.
-
param HookList
hooks( allow_None=False, bounds=(0, None), constant=False, default=[], instantiate=True, pickle_default_value=True, precedence=None, readonly=False, watchers={} ) - Optional list of hooks called when finalizing a plot. The hook is passed the plot object and the displayed element, and other plotting handles can be accessed via plot.handles.
-
param String
sublabel_format( allow_None=True, basestring=<class ‘str’>, constant=False, default=None, instantiate=False, pickle_default_value=True, precedence=None, readonly=False, regex=None, watchers={} ) - Allows labeling the subaxes in each plot with various formatters including {Alpha}, {alpha}, {numeric} and {roman}.
-
param NumericTuple
sublabel_position( allow_None=False, constant=False, default=(-0.35, 0.85), instantiate=False, length=2, pickle_default_value=True, precedence=None, readonly=False, watchers={} ) - Position relative to the plot for placing the optional subfigure label.
-
param Number
sublabel_size( allow_None=False, bounds=None, constant=False, default=18, inclusive_bounds=(True, True), instantiate=False, pickle_default_value=True, precedence=None, readonly=False, softbounds=None, time_dependent=False, time_fn=<Time Time00001>, watchers={} ) - Size of optional subfigure label.
-
param Boolean
show_frame( allow_None=False, bounds=(0, 1), constant=False, default=False, instantiate=False, pickle_default_value=True, precedence=None, readonly=False, watchers={} ) - Whether or not to show a complete frame around the plot.
-
param Boolean
apply_ranges( allow_None=False, bounds=(0, 1), constant=False, default=True, instantiate=False, pickle_default_value=True, precedence=None, readonly=False, watchers={} ) - Whether to compute the plot bounds from the data itself.
-
param Boolean
apply_extents( allow_None=False, bounds=(0, 1), constant=False, default=True, instantiate=False, pickle_default_value=True, precedence=None, readonly=False, watchers={} ) - Whether to apply extent overrides on the Elements
-
param ClassSelector
bgcolor( allow_None=True, constant=False, default=None, instantiate=True, is_instance=True, pickle_default_value=True, precedence=None, readonly=False, watchers={} ) - If set bgcolor overrides the background color of the axis.
-
param ClassSelector
default_span( allow_None=False, constant=False, default=2.0, instantiate=True, is_instance=True, pickle_default_value=True, precedence=None, readonly=False, watchers={} ) - Defines the span of an axis if the axis range is zero, i.e. if the lower and upper end of an axis are equal or no range is defined at all. For example if there is a single datapoint at 0 a default_span of 2.0 will result in axis ranges spanning from -1 to 1.
-
param Boolean
invert_axes( allow_None=False, bounds=(0, 1), constant=False, default=False, instantiate=False, pickle_default_value=True, precedence=None, readonly=False, watchers={} ) - Whether to invert the x- and y-axis
-
param Boolean
invert_xaxis( allow_None=False, bounds=(0, 1), constant=False, default=False, instantiate=False, pickle_default_value=True, precedence=None, readonly=False, watchers={} ) - Whether to invert the plot x-axis.
-
param Boolean
invert_yaxis( allow_None=False, bounds=(0, 1), constant=False, default=False, instantiate=False, pickle_default_value=True, precedence=None, readonly=False, watchers={} ) - Whether to invert the plot y-axis.
-
param Boolean
logx( allow_None=False, bounds=(0, 1), constant=False, default=False, instantiate=False, pickle_default_value=True, precedence=None, readonly=False, watchers={} ) - Whether the x-axis of the plot will be a log axis.
-
param Boolean
logy( allow_None=False, bounds=(0, 1), constant=False, default=False, instantiate=False, pickle_default_value=True, precedence=None, readonly=False, watchers={} ) - Whether the y-axis of the plot will be a log axis.
-
param ClassSelector
padding( allow_None=False, constant=False, default=0, instantiate=True, is_instance=True, pickle_default_value=True, precedence=None, readonly=False, watchers={} ) - Fraction by which to increase auto-ranged extents to make datapoints more visible around borders. To compute padding, the axis whose screen size is largest is chosen, and the range of that axis is increased by the specified fraction along each axis. Other axes are then padded ensuring that the amount of screen space devoted to padding is equal for all axes. If specified as a tuple, the int or float values in the tuple will be used for padding in each axis, in order (x,y or x,y,z). For example, for padding=0.2 on a 800x800-pixel plot, an x-axis with the range [0,10] will be padded by 20% to be [-1,11], while a y-axis with a range [0,1000] will be padded to be [-100,1100], which should make the padding be approximately the same number of pixels. But if the same plot is changed to have a height of only 200, the y-range will then be [-400,1400] so that the y-axis padding will still match that of the x-axis. It is also possible to declare non-equal padding value for the lower and upper bound of an axis by supplying nested tuples, e.g. padding=(0.1, (0, 0.1)) will pad the x-axis lower and upper bound as well as the y-axis upper bound by a fraction of 0.1 while the y-axis lower bound is not padded at all.
-
param Boolean
show_legend( allow_None=False, bounds=(0, 1), constant=False, default=True, instantiate=False, pickle_default_value=True, precedence=None, readonly=False, watchers={} ) - Whether to show legend for the plot.
-
param Boolean
show_grid( allow_None=False, bounds=(0, 1), constant=False, default=False, instantiate=False, pickle_default_value=True, precedence=None, readonly=False, watchers={} ) - Whether to show a Cartesian grid on the plot.
-
param ObjectSelector
xaxis( allow_None=None, check_on_set=True, compute_default_fn=None, constant=False, default=bottom, instantiate=False, names=None, objects=[‘top’, ‘bottom’, ‘bare’, ‘top-bare’, ‘bottom-bare’, None, True, False], pickle_default_value=True, precedence=None, readonly=False, watchers={} ) - Whether and where to display the xaxis. The “bare” options allow suppressing all axis labels, including ticks and xlabel. Valid options are ‘top’, ‘bottom’, ‘bare’, ‘top-bare’ and ‘bottom-bare’.
-
param ObjectSelector
yaxis( allow_None=None, check_on_set=True, compute_default_fn=None, constant=False, default=left, instantiate=False, names=None, objects=[‘left’, ‘right’, ‘bare’, ‘left-bare’, ‘right-bare’, None, True, False], pickle_default_value=True, precedence=None, readonly=False, watchers={} ) - Whether and where to display the yaxis. The “bare” options allow suppressing all axis labels, including ticks and ylabel. Valid options are ‘left’, ‘right’, ‘bare’, ‘left-bare’ and ‘right-bare’.
-
param String
xlabel( allow_None=True, basestring=<class ‘str’>, constant=False, default=None, instantiate=False, pickle_default_value=True, precedence=None, readonly=False, regex=None, watchers={} ) - An explicit override of the x-axis label, if set takes precedence over the dimension label.
-
param String
ylabel( allow_None=True, basestring=<class ‘str’>, constant=False, default=None, instantiate=False, pickle_default_value=True, precedence=None, readonly=False, regex=None, watchers={} ) - An explicit override of the y-axis label, if set takes precedence over the dimension label.
-
param NumericTuple
xlim( allow_None=False, constant=False, default=(nan, nan), instantiate=False, length=2, pickle_default_value=True, precedence=None, readonly=False, watchers={} ) - User-specified x-axis range limits for the plot, as a tuple (low,high). If specified, takes precedence over data and dimension ranges.
-
param NumericTuple
ylim( allow_None=False, constant=False, default=(nan, nan), instantiate=False, length=2, pickle_default_value=True, precedence=None, readonly=False, watchers={} ) - User-specified x-axis range limits for the plot, as a tuple (low,high). If specified, takes precedence over data and dimension ranges.
-
param NumericTuple
zlim( allow_None=False, constant=False, default=(nan, nan), instantiate=False, length=2, pickle_default_value=True, precedence=None, readonly=False, watchers={} ) - User-specified z-axis range limits for the plot, as a tuple (low,high). If specified, takes precedence over data and dimension ranges.
-
param Integer
xrotation( allow_None=True, bounds=(0, 360), constant=False, default=None, inclusive_bounds=(True, True), instantiate=False, pickle_default_value=True, precedence=None, readonly=False, softbounds=None, time_dependent=False, time_fn=<Time Time00001>, watchers={} ) - Rotation angle of the xticks.
-
param Integer
yrotation( allow_None=True, bounds=(0, 360), constant=False, default=None, inclusive_bounds=(True, True), instantiate=False, pickle_default_value=True, precedence=None, readonly=False, softbounds=None, time_dependent=False, time_fn=<Time Time00001>, watchers={} ) - Rotation angle of the yticks.
-
param Parameter
xticks( allow_None=True, constant=False, default=None, instantiate=False, pickle_default_value=True, precedence=None, readonly=False, watchers={} ) - Ticks along x-axis specified as an integer, explicit list of tick locations, or bokeh Ticker object. If set to None default bokeh ticking behavior is applied.
-
param Parameter
yticks( allow_None=True, constant=False, default=None, instantiate=False, pickle_default_value=True, precedence=None, readonly=False, watchers={} ) - Ticks along y-axis specified as an integer, explicit list of tick locations, or bokeh Ticker object. If set to None default bokeh ticking behavior is applied.
-
param Boolean
apply_ticks( allow_None=False, bounds=(0, 1), constant=False, default=True, instantiate=False, pickle_default_value=True, precedence=None, readonly=False, watchers={} ) - Whether to apply custom ticks.
-
param Parameter
aspect( allow_None=False, constant=False, default=square, instantiate=False, pickle_default_value=True, precedence=None, readonly=False, watchers={} ) - The aspect ratio mode of the plot. By default, a plot may select its own appropriate aspect ratio but sometimes it may be necessary to force a square aspect ratio (e.g. to display the plot as an element of a grid). The modes ‘auto’ and ‘equal’ correspond to the axis modes of the same name in matplotlib, a numeric value may also be passed.
-
param Boolean
invert_zaxis( allow_None=False, bounds=(0, 1), constant=False, default=False, instantiate=False, pickle_default_value=True, precedence=None, readonly=False, watchers={} ) - Whether to invert the plot z-axis.
-
param List
labelled( allow_None=False, bounds=(0, None), constant=False, default=[‘x’, ‘y’], instantiate=True, pickle_default_value=True, precedence=None, readonly=False, watchers={} ) - Whether to plot the ‘x’ and ‘y’ labels.
-
param Boolean
logz( allow_None=False, bounds=(0, 1), constant=False, default=False, instantiate=False, pickle_default_value=True, precedence=None, readonly=False, watchers={} ) - Whether to apply log scaling to the y-axis of the Chart.
-
param ClassSelector
xformatter( allow_None=True, constant=False, default=None, instantiate=True, is_instance=True, pickle_default_value=True, precedence=None, readonly=False, watchers={} ) - Formatter for ticks along the x-axis.
-
param ClassSelector
yformatter( allow_None=True, constant=False, default=None, instantiate=True, is_instance=True, pickle_default_value=True, precedence=None, readonly=False, watchers={} ) - Formatter for ticks along the y-axis.
-
param ClassSelector
zformatter( allow_None=True, constant=False, default=None, instantiate=True, is_instance=True, pickle_default_value=True, precedence=None, readonly=False, watchers={} ) - Formatter for ticks along the z-axis.
-
param Boolean
zaxis( allow_None=False, bounds=(0, 1), constant=False, default=True, instantiate=False, pickle_default_value=True, precedence=None, readonly=False, watchers={} ) - Whether to display the z-axis.
-
param String
zlabel( allow_None=True, basestring=<class ‘str’>, constant=False, default=None, instantiate=False, pickle_default_value=True, precedence=None, readonly=False, regex=None, watchers={} ) - An explicit override of the z-axis label, if set takes precedence over the dimension label.
-
param Integer
zrotation( allow_None=False, bounds=(0, 360), constant=False, default=0, inclusive_bounds=(True, True), instantiate=False, pickle_default_value=True, precedence=None, readonly=False, softbounds=None, time_dependent=False, time_fn=<Time Time00001>, watchers={} ) - Rotation angle of the zticks.
-
param Parameter
zticks( allow_None=True, constant=False, default=None, instantiate=False, pickle_default_value=True, precedence=None, readonly=False, watchers={} ) - Ticks along z-axis specified as an integer, explicit list of tick locations, list of tuples containing the locations and labels or a matplotlib tick locator object. If set to None default matplotlib ticking behavior is applied.
-
param Boolean
colorbar( allow_None=False, bounds=(0, 1), constant=False, default=False, instantiate=False, pickle_default_value=True, precedence=None, readonly=False, watchers={} ) - Whether to draw a colorbar.
-
param ClassSelector
color_levels( allow_None=True, constant=False, default=None, instantiate=True, is_instance=True, pickle_default_value=True, precedence=None, readonly=False, watchers={} ) - Number of discrete colors to use when colormapping or a set of color intervals defining the range of values to map each color to.
-
param Dict
clipping_colors( allow_None=False, constant=False, default={}, instantiate=True, is_instance=True, pickle_default_value=True, precedence=None, readonly=False, watchers={} ) - Dictionary to specify colors for clipped values, allows setting color for NaN values and for values above and below the min and max value. The min, max or NaN color may specify an RGB(A) color as a color hex string of the form #FFFFFF or #FFFFFFFF or a length 3 or length 4 tuple specifying values in the range 0-1 or a named HTML color.
-
param Number
cbar_padding( allow_None=False, bounds=None, constant=False, default=0.01, inclusive_bounds=(True, True), instantiate=False, pickle_default_value=True, precedence=None, readonly=False, softbounds=None, time_dependent=False, time_fn=<Time Time00001>, watchers={} ) - Padding between colorbar and other plots.
-
param Parameter
cbar_ticks( allow_None=True, constant=False, default=None, instantiate=False, pickle_default_value=True, precedence=None, readonly=False, watchers={} ) - Ticks along colorbar-axis specified as an integer, explicit list of tick locations, list of tuples containing the locations and labels or a matplotlib tick locator object. If set to None default matplotlib ticking behavior is applied.
-
param Number
cbar_width( allow_None=False, bounds=None, constant=False, default=0.05, inclusive_bounds=(True, True), instantiate=False, pickle_default_value=True, precedence=None, readonly=False, softbounds=None, time_dependent=False, time_fn=<Time Time00001>, watchers={} ) - Width of the colorbar as a fraction of the main plot
-
param Boolean
symmetric( allow_None=False, bounds=(0, 1), constant=False, default=False, instantiate=False, pickle_default_value=True, precedence=None, readonly=False, watchers={} ) - Whether to make the colormap symmetric around zero.
-
param Boolean
arrow_heads( allow_None=False, bounds=(0, 1), constant=False, default=True, instantiate=False, pickle_default_value=True, precedence=None, readonly=False, watchers={} ) - Whether or not to draw arrow heads. If arrowheads are enabled, they may be customized with the ‘headlength’ and ‘headaxislength’ style options.
-
param ClassSelector
magnitude( allow_None=True, constant=False, default=None, instantiate=True, is_instance=True, pickle_default_value=True, precedence=None, readonly=False, watchers={} ) - Dimension or dimension value transform that declares the magnitude of each vector. Magnitude is expected to be scaled between 0-1, by default the magnitudes are rescaled relative to the minimum distance between vectors, this can be disabled with the rescale_lengths option.
-
param Boolean
rescale_lengths( allow_None=False, bounds=(0, 1), constant=False, default=True, instantiate=False, pickle_default_value=True, precedence=None, readonly=False, watchers={} ) - Whether the lengths will be rescaled to take into account the smallest non-zero distance between two vectors.
-
param ClassSelector
color_index( allow_None=True, constant=False, default=None, instantiate=True, is_instance=True, pickle_default_value=True, precedence=None, readonly=False, watchers={} ) - Deprecated in favor of dimension value transform on color option, e.g. color=dim(‘Magnitude’) .
-
param ClassSelector
size_index( allow_None=True, constant=False, default=None, instantiate=True, is_instance=True, pickle_default_value=True, precedence=None, readonly=False, watchers={} ) - Deprecated in favor of the magnitude option, e.g. magnitude=dim(‘Magnitude’) .
-
param Boolean
normalize_lengths( allow_None=False, bounds=(0, 1), constant=False, default=True, instantiate=False, pickle_default_value=True, precedence=None, readonly=False, watchers={} ) - Deprecated in favor of rescaling length using dimension value transforms using the magnitude option, e.g. dim(‘Magnitude’).norm() .
-
anim( start=0 , stop=None , fps=30 ) ¶ -
Method to return a matplotlib animation. The start and stop frames may be specified as well as the fps.
-
cleanup( ) ¶ -
Cleans up references to the plot on the attached Stream subscribers.
-
compute_ranges( obj , key , ranges ) ¶ -
Given an object, a specific key, and the normalization options, this method will find the specified normalization options on the appropriate OptionTree, group the elements according to the selected normalization option (i.e. either per frame or over the whole animation) and finally compute the dimension ranges in each group. The new set of ranges is returned.
-
debug( *args , **kwargs ) ¶ -
Inspect .param.debug method for the full docstring
-
defaults( *args , **kwargs ) ¶ -
Inspect .param.defaults method for the full docstring
-
force_new_dynamic_value= functools.partial(<function Parameters.deprecate.<locals>.inner>, <class 'holoviews.plotting.mpl.chart.VectorFieldPlot'>) 
-
get_aspect( xspan , yspan ) ¶ -
Computes the aspect ratio of the plot
-
get_extents( element , ranges , range_type='combined' , xdim=None , ydim=None , zdim=None ) ¶ -
Gets the extents for the axes from the current Element. The globally computed ranges can optionally override the extents.
The extents are computed by combining the data ranges, extents and dimension ranges. Each of these can be obtained individually by setting the range_type to one of:
- ‘data’: Just the data ranges
- ‘extents’: Element.extents
- ‘soft’: Dimension.soft_range values
- ‘hard’: Dimension.range values
To obtain the combined range, which includes range padding the default may be used:
- ‘combined’: All the range types combined and padding applied
This allows Overlay plots to obtain each range and combine them appropriately for all the objects in the overlay.
-
get_padding( extents ) ¶ -
Computes padding along the axes taking into account the plot aspect.
-
get_param_values= functools.partial(<function Parameters.deprecate.<locals>.inner>, <class 'holoviews.plotting.mpl.chart.VectorFieldPlot'>) 
-
get_value_generator= functools.partial(<function Parameters.deprecate.<locals>.inner>, <class 'holoviews.plotting.mpl.chart.VectorFieldPlot'>) 
-
get_zorder( overlay , key , el ) ¶ -
Computes the z-order of element in the NdOverlay taking into account possible batching of elements.
-
init_artists( ax , plot_args , plot_kwargs ) ¶ -
Initializes the artist based on the plot method declared on the plot.
-
init_comm( ) ¶ -
Initializes comm and attaches streams.
-
inspect_value= functools.partial(<function Parameters.deprecate.<locals>.inner>, <class 'holoviews.plotting.mpl.chart.VectorFieldPlot'>) 
-
matches( spec ) ¶ -
Matches a specification against the current Plot.
-
message( *args , **kwargs ) ¶ -
Inspect .param.message method for the full docstring
-
params( *args , **kwargs ) ¶ -
Inspect .param.params method for the full docstring
-
pprint( imports=None , prefix=' ' , unknown_value='<?>' , qualify=False , separator='' ) ¶ -
(Experimental) Pretty printed representation that may be evaluated with eval. See pprint() function for more details.
-
print_param_defaults( *args , **kwargs ) ¶ -
Inspect .param.print_param_defaults method for the full docstring
-
print_param_values( *args , **kwargs ) ¶ -
Inspect .param.print_param_values method for the full docstring
-
push( ) ¶ -
Pushes updated plot data via the Comm.
-
refresh( **kwargs ) ¶ -
Refreshes the plot by rerendering it and then pushing the updated data if the plot has an associated Comm.
-
script_repr( imports=[] , prefix=' ' ) ¶ -
Variant of __repr__ designed for generating a runnable script.
-
set_default( *args , **kwargs ) ¶ -
Inspect .param.set_default method for the full docstring
-
set_dynamic_time_fn= functools.partial(<function Parameters.deprecate.<locals>.inner>, <class 'holoviews.plotting.mpl.chart.VectorFieldPlot'>) 
-
set_param= functools.partial(<function Parameters.deprecate.<locals>.inner>, <class 'holoviews.plotting.mpl.chart.VectorFieldPlot'>) 
-
state_pop( ) ¶ -
Restore the most recently saved state.
See state_push() for more details.
-
state_push( ) ¶ -
Save this instance’s state.
For Parameterized instances, this includes the state of dynamically generated values.
Subclasses that maintain short-term state should additionally save and restore that state using state_push() and state_pop().
Generally, this method is used by operations that need to test something without permanently altering the objects’ state.
-
teardown_handles( ) ¶ -
If no custom update_handles method is supplied this method is called to tear down any previous handles before replacing them.
-
traverse( fn=None , specs=None , full_breadth=True ) ¶ -
Traverses any nested DimensionedPlot returning a list of all plots that match the specs. The specs should be supplied as a list of either Plot types or callables, which should return a boolean given the plot class.
-
verbose( *args , **kwargs ) ¶ -
Inspect .param.verbose method for the full docstring
-
warning( *args , **kwargs ) ¶ -
Inspect .param.warning method for the full docstring
-
param Parameter
chart3d
Module

-
class
holoviews.plotting.mpl.chart3d.Path3DPlot( *args , **kwargs ) [source] ¶ -
Bases:
holoviews.plotting.mpl.chart3d.Plot3D,holoviews.plotting.mpl.path.PathPlotAllows plotting paths on a 3D axis.
-
param Parameter
fontsize( allow_None=True, constant=False, default=None, instantiate=False, pickle_default_value=True, precedence=None, readonly=False, watchers={} ) - Specifies various font sizes of the displayed text. Finer control is available by supplying a dictionary where any unmentioned keys revert to the default sizes, e.g: {‘ticks’:20, ‘title’:15, ‘ylabel’:5, ‘xlabel’:5, ‘zlabel’:5, ‘legend’:8, ‘legend_title’:13} You can set the font size of ‘zlabel’, ‘ylabel’ and ‘xlabel’ together using the ‘labels’ key.
-
param Boolean
show_title( allow_None=False, bounds=(0, 1), constant=False, default=True, instantiate=False, pickle_default_value=True, precedence=None, readonly=False, watchers={} ) - Whether to display the plot title.
-
param String
title( allow_None=False, basestring=<class ‘str’>, constant=False, default={label} {group} {dimensions}, instantiate=False, pickle_default_value=True, precedence=None, readonly=False, regex=None, watchers={} ) - The formatting string for the title of this plot, allows defining a label group separator and dimension labels.
-
param String
title_format( allow_None=True, basestring=<class ‘str’>, constant=False, default=None, instantiate=False, pickle_default_value=True, precedence=None, readonly=False, regex=None, watchers={} ) - Alias for title.
-
param Boolean
normalize( allow_None=False, bounds=(0, 1), constant=False, default=True, instantiate=False, pickle_default_value=True, precedence=None, readonly=False, watchers={} ) - Whether to compute ranges across all Elements at this level of plotting. Allows selecting normalization at different levels for nested data containers.
-
param ObjectSelector
projection( allow_None=True, check_on_set=True, compute_default_fn=None, constant=False, default=3d, instantiate=False, names=None, objects=[‘3d’], pickle_default_value=True, precedence=None, readonly=False, watchers={} ) - The projection of the matplotlib axis.
-
param Number
fig_alpha( allow_None=False, bounds=(0, 1), constant=False, default=1.0, inclusive_bounds=(True, True), instantiate=False, pickle_default_value=True, precedence=None, readonly=False, softbounds=None, time_dependent=False, time_fn=<Time Time00001>, watchers={} ) - Alpha of the overall figure background.
-
param NumericTuple
fig_bounds( allow_None=False, constant=False, default=(0.15, 0.15, 0.85, 0.85), instantiate=False, length=4, pickle_default_value=True, precedence=None, readonly=False, watchers={} ) - The bounds of the overall figure as a 4-tuple of the form (left, bottom, right, top), defining the size of the border around the subplots.
-
param Parameter
fig_inches( allow_None=False, constant=False, default=4, instantiate=False, pickle_default_value=True, precedence=None, readonly=False, watchers={} ) - The overall matplotlib figure size in inches. May be set as an integer in which case it will be used to autocompute a size. Alternatively may be set with an explicit tuple or list, in which case it will be applied directly after being scaled by fig_size. If either the width or height is set to None, it will be computed automatically.
-
param Boolean
fig_latex( allow_None=False, bounds=(0, 1), constant=False, default=False, instantiate=False, pickle_default_value=True, precedence=None, readonly=False, watchers={} ) - Whether to use LaTeX text in the overall figure.
-
param Dict
fig_rcparams( allow_None=False, constant=False, default={}, instantiate=True, is_instance=True, pickle_default_value=True, precedence=None, readonly=False, watchers={} ) - matplotlib rc parameters to apply to the overall figure.
-
param Number
fig_size( allow_None=False, bounds=(1, None), constant=False, default=100.0, inclusive_bounds=(True, True), instantiate=False, pickle_default_value=True, precedence=None, readonly=False, softbounds=None, time_dependent=False, time_fn=<Time Time00001>, watchers={} ) - Size relative to the supplied overall fig_inches in percent.
-
param HookList
initial_hooks( allow_None=False, bounds=(0, None), constant=False, default=[], instantiate=True, pickle_default_value=True, precedence=None, readonly=False, watchers={} ) - Optional list of hooks called before plotting the data onto the axis (now marked for deprecation). The hook is passed the plot object and the displayed object; other plotting handles can be accessed via plot.handles.
-
param HookList
finalize_hooks( allow_None=False, bounds=(0, None), constant=False, default=[], instantiate=True, pickle_default_value=True, precedence=None, readonly=False, watchers={} ) - Deprecated; use hooks options instead.
-
param HookList
hooks( allow_None=False, bounds=(0, None), constant=False, default=[], instantiate=True, pickle_default_value=True, precedence=None, readonly=False, watchers={} ) - Optional list of hooks called when finalizing a plot. The hook is passed the plot object and the displayed element, and other plotting handles can be accessed via plot.handles.
-
param String
sublabel_format( allow_None=True, basestring=<class ‘str’>, constant=False, default=None, instantiate=False, pickle_default_value=True, precedence=None, readonly=False, regex=None, watchers={} ) - Allows labeling the subaxes in each plot with various formatters including {Alpha}, {alpha}, {numeric} and {roman}.
-
param NumericTuple
sublabel_position( allow_None=False, constant=False, default=(-0.35, 0.85), instantiate=False, length=2, pickle_default_value=True, precedence=None, readonly=False, watchers={} ) - Position relative to the plot for placing the optional subfigure label.
-
param Number
sublabel_size( allow_None=False, bounds=None, constant=False, default=18, inclusive_bounds=(True, True), instantiate=False, pickle_default_value=True, precedence=None, readonly=False, softbounds=None, time_dependent=False, time_fn=<Time Time00001>, watchers={} ) - Size of optional subfigure label.
-
param Boolean
show_frame( allow_None=False, bounds=(0, 1), constant=False, default=False, instantiate=False, pickle_default_value=True, precedence=None, readonly=False, watchers={} ) - Whether or not to show a complete frame around the plot.
-
param Boolean
apply_ranges( allow_None=False, bounds=(0, 1), constant=False, default=True, instantiate=False, pickle_default_value=True, precedence=None, readonly=False, watchers={} ) - Whether to compute the plot bounds from the data itself.
-
param Boolean
apply_extents( allow_None=False, bounds=(0, 1), constant=False, default=True, instantiate=False, pickle_default_value=True, precedence=None, readonly=False, watchers={} ) - Whether to apply extent overrides on the Elements
-
param String
bgcolor( allow_None=False, basestring=<class ‘str’>, constant=False, default=white, instantiate=True, pickle_default_value=True, precedence=None, readonly=False, regex=None, watchers={} ) - Background color of the axis.
-
param ClassSelector
default_span( allow_None=False, constant=False, default=2.0, instantiate=True, is_instance=True, pickle_default_value=True, precedence=None, readonly=False, watchers={} ) - Defines the span of an axis if the axis range is zero, i.e. if the lower and upper end of an axis are equal or no range is defined at all. For example if there is a single datapoint at 0 a default_span of 2.0 will result in axis ranges spanning from -1 to 1.
-
param Boolean
invert_axes( allow_None=False, bounds=(0, 1), constant=False, default=False, instantiate=False, pickle_default_value=True, precedence=None, readonly=False, watchers={} ) - Whether to invert the x- and y-axis
-
param Boolean
invert_xaxis( allow_None=False, bounds=(0, 1), constant=False, default=False, instantiate=False, pickle_default_value=True, precedence=None, readonly=False, watchers={} ) - Whether to invert the plot x-axis.
-
param Boolean
invert_yaxis( allow_None=False, bounds=(0, 1), constant=False, default=False, instantiate=False, pickle_default_value=True, precedence=None, readonly=False, watchers={} ) - Whether to invert the plot y-axis.
-
param Boolean
logx( allow_None=False, bounds=(0, 1), constant=False, default=False, instantiate=False, pickle_default_value=True, precedence=None, readonly=False, watchers={} ) - Whether the x-axis of the plot will be a log axis.
-
param Boolean
logy( allow_None=False, bounds=(0, 1), constant=False, default=False, instantiate=False, pickle_default_value=True, precedence=None, readonly=False, watchers={} ) - Whether the y-axis of the plot will be a log axis.
-
param ClassSelector
padding( allow_None=False, constant=False, default=0, instantiate=True, is_instance=True, pickle_default_value=True, precedence=None, readonly=False, watchers={} ) - Fraction by which to increase auto-ranged extents to make datapoints more visible around borders. To compute padding, the axis whose screen size is largest is chosen, and the range of that axis is increased by the specified fraction along each axis. Other axes are then padded ensuring that the amount of screen space devoted to padding is equal for all axes. If specified as a tuple, the int or float values in the tuple will be used for padding in each axis, in order (x,y or x,y,z). For example, for padding=0.2 on a 800x800-pixel plot, an x-axis with the range [0,10] will be padded by 20% to be [-1,11], while a y-axis with a range [0,1000] will be padded to be [-100,1100], which should make the padding be approximately the same number of pixels. But if the same plot is changed to have a height of only 200, the y-range will then be [-400,1400] so that the y-axis padding will still match that of the x-axis. It is also possible to declare non-equal padding value for the lower and upper bound of an axis by supplying nested tuples, e.g. padding=(0.1, (0, 0.1)) will pad the x-axis lower and upper bound as well as the y-axis upper bound by a fraction of 0.1 while the y-axis lower bound is not padded at all.
-
param Boolean
show_legend( allow_None=False, bounds=(0, 1), constant=False, default=False, instantiate=False, pickle_default_value=True, precedence=None, readonly=False, watchers={} ) - Whether to show legend for the plot.
-
param Boolean
show_grid( allow_None=False, bounds=(0, 1), constant=False, default=True, instantiate=False, pickle_default_value=True, precedence=None, readonly=False, watchers={} ) - Whether to draw a grid in the figure.
-
param ObjectSelector
xaxis( allow_None=None, check_on_set=True, compute_default_fn=None, constant=False, default=fixed, instantiate=False, names=None, objects=[‘fixed’, None], pickle_default_value=True, precedence=None, readonly=False, watchers={} ) - Whether and where to display the xaxis.
-
param ObjectSelector
yaxis( allow_None=None, check_on_set=True, compute_default_fn=None, constant=False, default=fixed, instantiate=False, names=None, objects=[‘fixed’, None], pickle_default_value=True, precedence=None, readonly=False, watchers={} ) - Whether and where to display the yaxis.
-
param String
xlabel( allow_None=True, basestring=<class ‘str’>, constant=False, default=None, instantiate=False, pickle_default_value=True, precedence=None, readonly=False, regex=None, watchers={} ) - An explicit override of the x-axis label, if set takes precedence over the dimension label.
-
param String
ylabel( allow_None=True, basestring=<class ‘str’>, constant=False, default=None, instantiate=False, pickle_default_value=True, precedence=None, readonly=False, regex=None, watchers={} ) - An explicit override of the y-axis label, if set takes precedence over the dimension label.
-
param NumericTuple
xlim( allow_None=False, constant=False, default=(nan, nan), instantiate=False, length=2, pickle_default_value=True, precedence=None, readonly=False, watchers={} ) - User-specified x-axis range limits for the plot, as a tuple (low,high). If specified, takes precedence over data and dimension ranges.
-
param NumericTuple
ylim( allow_None=False, constant=False, default=(nan, nan), instantiate=False, length=2, pickle_default_value=True, precedence=None, readonly=False, watchers={} ) - User-specified x-axis range limits for the plot, as a tuple (low,high). If specified, takes precedence over data and dimension ranges.
-
param NumericTuple
zlim( allow_None=False, constant=False, default=(nan, nan), instantiate=False, length=2, pickle_default_value=True, precedence=None, readonly=False, watchers={} ) - User-specified z-axis range limits for the plot, as a tuple (low,high). If specified, takes precedence over data and dimension ranges.
-
param Integer
xrotation( allow_None=True, bounds=(0, 360), constant=False, default=None, inclusive_bounds=(True, True), instantiate=False, pickle_default_value=True, precedence=None, readonly=False, softbounds=None, time_dependent=False, time_fn=<Time Time00001>, watchers={} ) - Rotation angle of the xticks.
-
param Integer
yrotation( allow_None=True, bounds=(0, 360), constant=False, default=None, inclusive_bounds=(True, True), instantiate=False, pickle_default_value=True, precedence=None, readonly=False, softbounds=None, time_dependent=False, time_fn=<Time Time00001>, watchers={} ) - Rotation angle of the yticks.
-
param Parameter
xticks( allow_None=True, constant=False, default=None, instantiate=False, pickle_default_value=True, precedence=None, readonly=False, watchers={} ) - Ticks along x-axis specified as an integer, explicit list of tick locations, or bokeh Ticker object. If set to None default bokeh ticking behavior is applied.
-
param Parameter
yticks( allow_None=True, constant=False, default=None, instantiate=False, pickle_default_value=True, precedence=None, readonly=False, watchers={} ) - Ticks along y-axis specified as an integer, explicit list of tick locations, or bokeh Ticker object. If set to None default bokeh ticking behavior is applied.
-
param Boolean
apply_ticks( allow_None=False, bounds=(0, 1), constant=False, default=True, instantiate=False, pickle_default_value=True, precedence=None, readonly=False, watchers={} ) - Whether to apply custom ticks.
-
param Parameter
aspect( allow_None=False, constant=False, default=square, instantiate=False, pickle_default_value=True, precedence=None, readonly=False, watchers={} ) - PathPlots axes usually define single space so aspect of Paths follows aspect in data coordinates by default.
-
param Boolean
invert_zaxis( allow_None=False, bounds=(0, 1), constant=False, default=False, instantiate=False, pickle_default_value=True, precedence=None, readonly=False, watchers={} ) - Whether to invert the plot z-axis.
-
param List
labelled( allow_None=False, bounds=(0, None), constant=False, default=[‘x’, ‘y’, ‘z’], instantiate=True, pickle_default_value=True, precedence=None, readonly=False, watchers={} ) - Whether to plot the ‘x’, ‘y’ and ‘z’ labels.
-
param Boolean
logz( allow_None=False, bounds=(0, 1), constant=False, default=False, instantiate=False, pickle_default_value=True, precedence=None, readonly=False, watchers={} ) - Whether to apply log scaling to the y-axis of the Chart.
-
param ClassSelector
xformatter( allow_None=True, constant=False, default=None, instantiate=True, is_instance=True, pickle_default_value=True, precedence=None, readonly=False, watchers={} ) - Formatter for ticks along the x-axis.
-
param ClassSelector
yformatter( allow_None=True, constant=False, default=None, instantiate=True, is_instance=True, pickle_default_value=True, precedence=None, readonly=False, watchers={} ) - Formatter for ticks along the y-axis.
-
param ClassSelector
zformatter( allow_None=True, constant=False, default=None, instantiate=True, is_instance=True, pickle_default_value=True, precedence=None, readonly=False, watchers={} ) - Formatter for ticks along the z-axis.
-
param ObjectSelector
zaxis( allow_None=False, check_on_set=True, compute_default_fn=None, constant=False, default=fixed, instantiate=False, names=None, objects=[‘fixed’, None], pickle_default_value=True, precedence=None, readonly=False, watchers={} ) - Whether and where to display the yaxis.
-
param String
zlabel( allow_None=True, basestring=<class ‘str’>, constant=False, default=None, instantiate=False, pickle_default_value=True, precedence=None, readonly=False, regex=None, watchers={} ) - An explicit override of the z-axis label, if set takes precedence over the dimension label.
-
param Integer
zrotation( allow_None=False, bounds=(0, 360), constant=False, default=0, inclusive_bounds=(True, True), instantiate=False, pickle_default_value=True, precedence=None, readonly=False, softbounds=None, time_dependent=False, time_fn=<Time Time00001>, watchers={} ) - Rotation angle of the zticks.
-
param Parameter
zticks( allow_None=True, constant=False, default=None, instantiate=False, pickle_default_value=True, precedence=None, readonly=False, watchers={} ) - Ticks along z-axis specified as an integer, explicit list of tick locations, list of tuples containing the locations and labels or a matplotlib tick locator object. If set to None default matplotlib ticking behavior is applied.
-
param Boolean
colorbar( allow_None=False, bounds=(0, 1), constant=False, default=False, instantiate=False, pickle_default_value=True, precedence=None, readonly=False, watchers={} ) - Whether to draw a colorbar.
-
param ClassSelector
color_levels( allow_None=True, constant=False, default=None, instantiate=True, is_instance=True, pickle_default_value=True, precedence=None, readonly=False, watchers={} ) - Number of discrete colors to use when colormapping or a set of color intervals defining the range of values to map each color to.
-
param Dict
clipping_colors( allow_None=False, constant=False, default={}, instantiate=True, is_instance=True, pickle_default_value=True, precedence=None, readonly=False, watchers={} ) - Dictionary to specify colors for clipped values, allows setting color for NaN values and for values above and below the min and max value. The min, max or NaN color may specify an RGB(A) color as a color hex string of the form #FFFFFF or #FFFFFFFF or a length 3 or length 4 tuple specifying values in the range 0-1 or a named HTML color.
-
param Number
cbar_padding( allow_None=False, bounds=None, constant=False, default=0.01, inclusive_bounds=(True, True), instantiate=False, pickle_default_value=True, precedence=None, readonly=False, softbounds=None, time_dependent=False, time_fn=<Time Time00001>, watchers={} ) - Padding between colorbar and other plots.
-
param Parameter
cbar_ticks( allow_None=True, constant=False, default=None, instantiate=False, pickle_default_value=True, precedence=None, readonly=False, watchers={} ) - Ticks along colorbar-axis specified as an integer, explicit list of tick locations, list of tuples containing the locations and labels or a matplotlib tick locator object. If set to None default matplotlib ticking behavior is applied.
-
param Number
cbar_width( allow_None=False, bounds=None, constant=False, default=0.05, inclusive_bounds=(True, True), instantiate=False, pickle_default_value=True, precedence=None, readonly=False, softbounds=None, time_dependent=False, time_fn=<Time Time00001>, watchers={} ) - Width of the colorbar as a fraction of the main plot
-
param Boolean
symmetric( allow_None=False, bounds=(0, 1), constant=False, default=False, instantiate=False, pickle_default_value=True, precedence=None, readonly=False, watchers={} ) - Whether to make the colormap symmetric around zero.
-
param ClassSelector
color_index( allow_None=True, constant=False, default=None, instantiate=True, is_instance=True, pickle_default_value=True, precedence=None, readonly=False, watchers={} ) - Index of the dimension from which the color will the drawn
-
param Integer
azimuth( allow_None=False, bounds=(-180, 180), constant=False, default=-60, inclusive_bounds=(True, True), instantiate=False, pickle_default_value=True, precedence=None, readonly=False, softbounds=None, time_dependent=False, time_fn=<Time Time00001>, watchers={} ) - Azimuth angle in the x,y plane.
-
param Integer
elevation( allow_None=False, bounds=(0, 180), constant=False, default=30, inclusive_bounds=(True, True), instantiate=False, pickle_default_value=True, precedence=None, readonly=False, softbounds=None, time_dependent=False, time_fn=<Time Time00001>, watchers={} ) - Elevation angle in the z-axis.
-
param Integer
distance( allow_None=False, bounds=(7, 15), constant=False, default=10, inclusive_bounds=(True, True), instantiate=False, pickle_default_value=True, precedence=None, readonly=False, softbounds=None, time_dependent=False, time_fn=<Time Time00001>, watchers={} ) - Distance from the plotted object.
-
param Boolean
disable_axes( allow_None=False, bounds=(0, 1), constant=False, default=False, instantiate=False, pickle_default_value=True, precedence=None, readonly=False, watchers={} ) - Disable all axes.
-
anim( start=0 , stop=None , fps=30 ) ¶ -
Method to return a matplotlib animation. The start and stop frames may be specified as well as the fps.
-
cleanup( ) ¶ -
Cleans up references to the plot on the attached Stream subscribers.
-
compute_ranges( obj , key , ranges ) ¶ -
Given an object, a specific key, and the normalization options, this method will find the specified normalization options on the appropriate OptionTree, group the elements according to the selected normalization option (i.e. either per frame or over the whole animation) and finally compute the dimension ranges in each group. The new set of ranges is returned.
-
debug( *args , **kwargs ) ¶ -
Inspect .param.debug method for the full docstring
-
defaults( *args , **kwargs ) ¶ -
Inspect .param.defaults method for the full docstring
-
force_new_dynamic_value= functools.partial(<function Parameters.deprecate.<locals>.inner>, <class 'holoviews.plotting.mpl.chart3d.Path3DPlot'>) 
-
get_aspect( xspan , yspan ) ¶ -
Computes the aspect ratio of the plot
-
get_extents( element , ranges , range_type='combined' , xdim=None , ydim=None , zdim=None ) ¶ -
Gets the extents for the axes from the current Element. The globally computed ranges can optionally override the extents.
The extents are computed by combining the data ranges, extents and dimension ranges. Each of these can be obtained individually by setting the range_type to one of:
- ‘data’: Just the data ranges
- ‘extents’: Element.extents
- ‘soft’: Dimension.soft_range values
- ‘hard’: Dimension.range values
To obtain the combined range, which includes range padding the default may be used:
- ‘combined’: All the range types combined and padding applied
This allows Overlay plots to obtain each range and combine them appropriately for all the objects in the overlay.
-
get_padding( extents ) ¶ -
Computes padding along the axes taking into account the plot aspect.
-
get_param_values= functools.partial(<function Parameters.deprecate.<locals>.inner>, <class 'holoviews.plotting.mpl.chart3d.Path3DPlot'>) 
-
get_value_generator= functools.partial(<function Parameters.deprecate.<locals>.inner>, <class 'holoviews.plotting.mpl.chart3d.Path3DPlot'>) 
-
get_zorder( overlay , key , el ) ¶ -
Computes the z-order of element in the NdOverlay taking into account possible batching of elements.
-
init_comm( ) ¶ -
Initializes comm and attaches streams.
-
inspect_value= functools.partial(<function Parameters.deprecate.<locals>.inner>, <class 'holoviews.plotting.mpl.chart3d.Path3DPlot'>) 
-
matches( spec ) ¶ -
Matches a specification against the current Plot.
-
message( *args , **kwargs ) ¶ -
Inspect .param.message method for the full docstring
-
params( *args , **kwargs ) ¶ -
Inspect .param.params method for the full docstring
-
pprint( imports=None , prefix=' ' , unknown_value='<?>' , qualify=False , separator='' ) ¶ -
(Experimental) Pretty printed representation that may be evaluated with eval. See pprint() function for more details.
-
print_param_defaults( *args , **kwargs ) ¶ -
Inspect .param.print_param_defaults method for the full docstring
-
print_param_values( *args , **kwargs ) ¶ -
Inspect .param.print_param_values method for the full docstring
-
push( ) ¶ -
Pushes updated plot data via the Comm.
-
refresh( **kwargs ) ¶ -
Refreshes the plot by rerendering it and then pushing the updated data if the plot has an associated Comm.
-
script_repr( imports=[] , prefix=' ' ) ¶ -
Variant of __repr__ designed for generating a runnable script.
-
set_default( *args , **kwargs ) ¶ -
Inspect .param.set_default method for the full docstring
-
set_dynamic_time_fn= functools.partial(<function Parameters.deprecate.<locals>.inner>, <class 'holoviews.plotting.mpl.chart3d.Path3DPlot'>) 
-
set_param= functools.partial(<function Parameters.deprecate.<locals>.inner>, <class 'holoviews.plotting.mpl.chart3d.Path3DPlot'>) 
-
state_pop( ) ¶ -
Restore the most recently saved state.
See state_push() for more details.
-
state_push( ) ¶ -
Save this instance’s state.
For Parameterized instances, this includes the state of dynamically generated values.
Subclasses that maintain short-term state should additionally save and restore that state using state_push() and state_pop().
Generally, this method is used by operations that need to test something without permanently altering the objects’ state.
-
teardown_handles( ) ¶ -
If no custom update_handles method is supplied this method is called to tear down any previous handles before replacing them.
-
traverse( fn=None , specs=None , full_breadth=True ) ¶ -
Traverses any nested DimensionedPlot returning a list of all plots that match the specs. The specs should be supplied as a list of either Plot types or callables, which should return a boolean given the plot class.
-
verbose( *args , **kwargs ) ¶ -
Inspect .param.verbose method for the full docstring
-
warning( *args , **kwargs ) ¶ -
Inspect .param.warning method for the full docstring
-
param Parameter
-
class
holoviews.plotting.mpl.chart3d.Plot3D( *args , **kwargs ) [source] ¶ -
Bases:
holoviews.plotting.mpl.element.ColorbarPlotPlot3D provides a common baseclass for mplot3d based plots.
-
param Parameter
fontsize( allow_None=True, constant=False, default=None, instantiate=False, pickle_default_value=True, precedence=None, readonly=False, watchers={} ) - Specifies various font sizes of the displayed text. Finer control is available by supplying a dictionary where any unmentioned keys revert to the default sizes, e.g: {‘ticks’:20, ‘title’:15, ‘ylabel’:5, ‘xlabel’:5, ‘zlabel’:5, ‘legend’:8, ‘legend_title’:13} You can set the font size of ‘zlabel’, ‘ylabel’ and ‘xlabel’ together using the ‘labels’ key.
-
param Boolean
show_title( allow_None=False, bounds=(0, 1), constant=False, default=True, instantiate=False, pickle_default_value=True, precedence=None, readonly=False, watchers={} ) - Whether to display the plot title.
-
param String
title( allow_None=False, basestring=<class ‘str’>, constant=False, default={label} {group} {dimensions}, instantiate=False, pickle_default_value=True, precedence=None, readonly=False, regex=None, watchers={} ) - The formatting string for the title of this plot, allows defining a label group separator and dimension labels.
-
param String
title_format( allow_None=True, basestring=<class ‘str’>, constant=False, default=None, instantiate=False, pickle_default_value=True, precedence=None, readonly=False, regex=None, watchers={} ) - Alias for title.
-
param Boolean
normalize( allow_None=False, bounds=(0, 1), constant=False, default=True, instantiate=False, pickle_default_value=True, precedence=None, readonly=False, watchers={} ) - Whether to compute ranges across all Elements at this level of plotting. Allows selecting normalization at different levels for nested data containers.
-
param ObjectSelector
projection( allow_None=True, check_on_set=True, compute_default_fn=None, constant=False, default=3d, instantiate=False, names=None, objects=[‘3d’], pickle_default_value=True, precedence=None, readonly=False, watchers={} ) - The projection of the matplotlib axis.
-
param Number
fig_alpha( allow_None=False, bounds=(0, 1), constant=False, default=1.0, inclusive_bounds=(True, True), instantiate=False, pickle_default_value=True, precedence=None, readonly=False, softbounds=None, time_dependent=False, time_fn=<Time Time00001>, watchers={} ) - Alpha of the overall figure background.
-
param NumericTuple
fig_bounds( allow_None=False, constant=False, default=(0.15, 0.15, 0.85, 0.85), instantiate=False, length=4, pickle_default_value=True, precedence=None, readonly=False, watchers={} ) - The bounds of the overall figure as a 4-tuple of the form (left, bottom, right, top), defining the size of the border around the subplots.
-
param Parameter
fig_inches( allow_None=False, constant=False, default=4, instantiate=False, pickle_default_value=True, precedence=None, readonly=False, watchers={} ) - The overall matplotlib figure size in inches. May be set as an integer in which case it will be used to autocompute a size. Alternatively may be set with an explicit tuple or list, in which case it will be applied directly after being scaled by fig_size. If either the width or height is set to None, it will be computed automatically.
-
param Boolean
fig_latex( allow_None=False, bounds=(0, 1), constant=False, default=False, instantiate=False, pickle_default_value=True, precedence=None, readonly=False, watchers={} ) - Whether to use LaTeX text in the overall figure.
-
param Dict
fig_rcparams( allow_None=False, constant=False, default={}, instantiate=True, is_instance=True, pickle_default_value=True, precedence=None, readonly=False, watchers={} ) - matplotlib rc parameters to apply to the overall figure.
-
param Number
fig_size( allow_None=False, bounds=(1, None), constant=False, default=100.0, inclusive_bounds=(True, True), instantiate=False, pickle_default_value=True, precedence=None, readonly=False, softbounds=None, time_dependent=False, time_fn=<Time Time00001>, watchers={} ) - Size relative to the supplied overall fig_inches in percent.
-
param HookList
initial_hooks( allow_None=False, bounds=(0, None), constant=False, default=[], instantiate=True, pickle_default_value=True, precedence=None, readonly=False, watchers={} ) - Optional list of hooks called before plotting the data onto the axis (now marked for deprecation). The hook is passed the plot object and the displayed object; other plotting handles can be accessed via plot.handles.
-
param HookList
finalize_hooks( allow_None=False, bounds=(0, None), constant=False, default=[], instantiate=True, pickle_default_value=True, precedence=None, readonly=False, watchers={} ) - Deprecated; use hooks options instead.
-
param HookList
hooks( allow_None=False, bounds=(0, None), constant=False, default=[], instantiate=True, pickle_default_value=True, precedence=None, readonly=False, watchers={} ) - Optional list of hooks called when finalizing a plot. The hook is passed the plot object and the displayed element, and other plotting handles can be accessed via plot.handles.
-
param String
sublabel_format( allow_None=True, basestring=<class ‘str’>, constant=False, default=None, instantiate=False, pickle_default_value=True, precedence=None, readonly=False, regex=None, watchers={} ) - Allows labeling the subaxes in each plot with various formatters including {Alpha}, {alpha}, {numeric} and {roman}.
-
param NumericTuple
sublabel_position( allow_None=False, constant=False, default=(-0.35, 0.85), instantiate=False, length=2, pickle_default_value=True, precedence=None, readonly=False, watchers={} ) - Position relative to the plot for placing the optional subfigure label.
-
param Number
sublabel_size( allow_None=False, bounds=None, constant=False, default=18, inclusive_bounds=(True, True), instantiate=False, pickle_default_value=True, precedence=None, readonly=False, softbounds=None, time_dependent=False, time_fn=<Time Time00001>, watchers={} ) - Size of optional subfigure label.
-
param Boolean
show_frame( allow_None=False, bounds=(0, 1), constant=False, default=False, instantiate=False, pickle_default_value=True, precedence=None, readonly=False, watchers={} ) - Whether or not to show a complete frame around the plot.
-
param Boolean
apply_ranges( allow_None=False, bounds=(0, 1), constant=False, default=True, instantiate=False, pickle_default_value=True, precedence=None, readonly=False, watchers={} ) - Whether to compute the plot bounds from the data itself.
-
param Boolean
apply_extents( allow_None=False, bounds=(0, 1), constant=False, default=True, instantiate=False, pickle_default_value=True, precedence=None, readonly=False, watchers={} ) - Whether to apply extent overrides on the Elements
-
param String
bgcolor( allow_None=False, basestring=<class ‘str’>, constant=False, default=white, instantiate=True, pickle_default_value=True, precedence=None, readonly=False, regex=None, watchers={} ) - Background color of the axis.
-
param ClassSelector
default_span( allow_None=False, constant=False, default=2.0, instantiate=True, is_instance=True, pickle_default_value=True, precedence=None, readonly=False, watchers={} ) - Defines the span of an axis if the axis range is zero, i.e. if the lower and upper end of an axis are equal or no range is defined at all. For example if there is a single datapoint at 0 a default_span of 2.0 will result in axis ranges spanning from -1 to 1.
-
param Boolean
invert_axes( allow_None=False, bounds=(0, 1), constant=False, default=False, instantiate=False, pickle_default_value=True, precedence=None, readonly=False, watchers={} ) - Whether to invert the x- and y-axis
-
param Boolean
invert_xaxis( allow_None=False, bounds=(0, 1), constant=False, default=False, instantiate=False, pickle_default_value=True, precedence=None, readonly=False, watchers={} ) - Whether to invert the plot x-axis.
-
param Boolean
invert_yaxis( allow_None=False, bounds=(0, 1), constant=False, default=False, instantiate=False, pickle_default_value=True, precedence=None, readonly=False, watchers={} ) - Whether to invert the plot y-axis.
-
param Boolean
logx( allow_None=False, bounds=(0, 1), constant=False, default=False, instantiate=False, pickle_default_value=True, precedence=None, readonly=False, watchers={} ) - Whether the x-axis of the plot will be a log axis.
-
param Boolean
logy( allow_None=False, bounds=(0, 1), constant=False, default=False, instantiate=False, pickle_default_value=True, precedence=None, readonly=False, watchers={} ) - Whether the y-axis of the plot will be a log axis.
-
param ClassSelector
padding( allow_None=False, constant=False, default=0, instantiate=True, is_instance=True, pickle_default_value=True, precedence=None, readonly=False, watchers={} ) - Fraction by which to increase auto-ranged extents to make datapoints more visible around borders. To compute padding, the axis whose screen size is largest is chosen, and the range of that axis is increased by the specified fraction along each axis. Other axes are then padded ensuring that the amount of screen space devoted to padding is equal for all axes. If specified as a tuple, the int or float values in the tuple will be used for padding in each axis, in order (x,y or x,y,z). For example, for padding=0.2 on a 800x800-pixel plot, an x-axis with the range [0,10] will be padded by 20% to be [-1,11], while a y-axis with a range [0,1000] will be padded to be [-100,1100], which should make the padding be approximately the same number of pixels. But if the same plot is changed to have a height of only 200, the y-range will then be [-400,1400] so that the y-axis padding will still match that of the x-axis. It is also possible to declare non-equal padding value for the lower and upper bound of an axis by supplying nested tuples, e.g. padding=(0.1, (0, 0.1)) will pad the x-axis lower and upper bound as well as the y-axis upper bound by a fraction of 0.1 while the y-axis lower bound is not padded at all.
-
param Boolean
show_legend( allow_None=False, bounds=(0, 1), constant=False, default=True, instantiate=False, pickle_default_value=True, precedence=None, readonly=False, watchers={} ) - Whether to show legend for the plot.
-
param Boolean
show_grid( allow_None=False, bounds=(0, 1), constant=False, default=True, instantiate=False, pickle_default_value=True, precedence=None, readonly=False, watchers={} ) - Whether to draw a grid in the figure.
-
param ObjectSelector
xaxis( allow_None=None, check_on_set=True, compute_default_fn=None, constant=False, default=fixed, instantiate=False, names=None, objects=[‘fixed’, None], pickle_default_value=True, precedence=None, readonly=False, watchers={} ) - Whether and where to display the xaxis.
-
param ObjectSelector
yaxis( allow_None=None, check_on_set=True, compute_default_fn=None, constant=False, default=fixed, instantiate=False, names=None, objects=[‘fixed’, None], pickle_default_value=True, precedence=None, readonly=False, watchers={} ) - Whether and where to display the yaxis.
-
param String
xlabel( allow_None=True, basestring=<class ‘str’>, constant=False, default=None, instantiate=False, pickle_default_value=True, precedence=None, readonly=False, regex=None, watchers={} ) - An explicit override of the x-axis label, if set takes precedence over the dimension label.
-
param String
ylabel( allow_None=True, basestring=<class ‘str’>, constant=False, default=None, instantiate=False, pickle_default_value=True, precedence=None, readonly=False, regex=None, watchers={} ) - An explicit override of the y-axis label, if set takes precedence over the dimension label.
-
param NumericTuple
xlim( allow_None=False, constant=False, default=(nan, nan), instantiate=False, length=2, pickle_default_value=True, precedence=None, readonly=False, watchers={} ) - User-specified x-axis range limits for the plot, as a tuple (low,high). If specified, takes precedence over data and dimension ranges.
-
param NumericTuple
ylim( allow_None=False, constant=False, default=(nan, nan), instantiate=False, length=2, pickle_default_value=True, precedence=None, readonly=False, watchers={} ) - User-specified x-axis range limits for the plot, as a tuple (low,high). If specified, takes precedence over data and dimension ranges.
-
param NumericTuple
zlim( allow_None=False, constant=False, default=(nan, nan), instantiate=False, length=2, pickle_default_value=True, precedence=None, readonly=False, watchers={} ) - User-specified z-axis range limits for the plot, as a tuple (low,high). If specified, takes precedence over data and dimension ranges.
-
param Integer
xrotation( allow_None=True, bounds=(0, 360), constant=False, default=None, inclusive_bounds=(True, True), instantiate=False, pickle_default_value=True, precedence=None, readonly=False, softbounds=None, time_dependent=False, time_fn=<Time Time00001>, watchers={} ) - Rotation angle of the xticks.
-
param Integer
yrotation( allow_None=True, bounds=(0, 360), constant=False, default=None, inclusive_bounds=(True, True), instantiate=False, pickle_default_value=True, precedence=None, readonly=False, softbounds=None, time_dependent=False, time_fn=<Time Time00001>, watchers={} ) - Rotation angle of the yticks.
-
param Parameter
xticks( allow_None=True, constant=False, default=None, instantiate=False, pickle_default_value=True, precedence=None, readonly=False, watchers={} ) - Ticks along x-axis specified as an integer, explicit list of tick locations, or bokeh Ticker object. If set to None default bokeh ticking behavior is applied.
-
param Parameter
yticks( allow_None=True, constant=False, default=None, instantiate=False, pickle_default_value=True, precedence=None, readonly=False, watchers={} ) - Ticks along y-axis specified as an integer, explicit list of tick locations, or bokeh Ticker object. If set to None default bokeh ticking behavior is applied.
-
param Boolean
apply_ticks( allow_None=False, bounds=(0, 1), constant=False, default=True, instantiate=False, pickle_default_value=True, precedence=None, readonly=False, watchers={} ) - Whether to apply custom ticks.
-
param Parameter
aspect( allow_None=False, constant=False, default=square, instantiate=False, pickle_default_value=True, precedence=None, readonly=False, watchers={} ) - The aspect ratio mode of the plot. By default, a plot may select its own appropriate aspect ratio but sometimes it may be necessary to force a square aspect ratio (e.g. to display the plot as an element of a grid). The modes ‘auto’ and ‘equal’ correspond to the axis modes of the same name in matplotlib, a numeric value may also be passed.
-
param Boolean
invert_zaxis( allow_None=False, bounds=(0, 1), constant=False, default=False, instantiate=False, pickle_default_value=True, precedence=None, readonly=False, watchers={} ) - Whether to invert the plot z-axis.
-
param List
labelled( allow_None=False, bounds=(0, None), constant=False, default=[‘x’, ‘y’, ‘z’], instantiate=True, pickle_default_value=True, precedence=None, readonly=False, watchers={} ) - Whether to plot the ‘x’, ‘y’ and ‘z’ labels.
-
param Boolean
logz( allow_None=False, bounds=(0, 1), constant=False, default=False, instantiate=False, pickle_default_value=True, precedence=None, readonly=False, watchers={} ) - Whether to apply log scaling to the y-axis of the Chart.
-
param ClassSelector
xformatter( allow_None=True, constant=False, default=None, instantiate=True, is_instance=True, pickle_default_value=True, precedence=None, readonly=False, watchers={} ) - Formatter for ticks along the x-axis.
-
param ClassSelector
yformatter( allow_None=True, constant=False, default=None, instantiate=True, is_instance=True, pickle_default_value=True, precedence=None, readonly=False, watchers={} ) - Formatter for ticks along the y-axis.
-
param ClassSelector
zformatter( allow_None=True, constant=False, default=None, instantiate=True, is_instance=True, pickle_default_value=True, precedence=None, readonly=False, watchers={} ) - Formatter for ticks along the z-axis.
-
param ObjectSelector
zaxis( allow_None=False, check_on_set=True, compute_default_fn=None, constant=False, default=fixed, instantiate=False, names=None, objects=[‘fixed’, None], pickle_default_value=True, precedence=None, readonly=False, watchers={} ) - Whether and where to display the yaxis.
-
param String
zlabel( allow_None=True, basestring=<class ‘str’>, constant=False, default=None, instantiate=False, pickle_default_value=True, precedence=None, readonly=False, regex=None, watchers={} ) - An explicit override of the z-axis label, if set takes precedence over the dimension label.
-
param Integer
zrotation( allow_None=False, bounds=(0, 360), constant=False, default=0, inclusive_bounds=(True, True), instantiate=False, pickle_default_value=True, precedence=None, readonly=False, softbounds=None, time_dependent=False, time_fn=<Time Time00001>, watchers={} ) - Rotation angle of the zticks.
-
param Parameter
zticks( allow_None=True, constant=False, default=None, instantiate=False, pickle_default_value=True, precedence=None, readonly=False, watchers={} ) - Ticks along z-axis specified as an integer, explicit list of tick locations, list of tuples containing the locations and labels or a matplotlib tick locator object. If set to None default matplotlib ticking behavior is applied.
-
param Boolean
colorbar( allow_None=False, bounds=(0, 1), constant=False, default=False, instantiate=False, pickle_default_value=True, precedence=None, readonly=False, watchers={} ) - Whether to draw a colorbar.
-
param ClassSelector
color_levels( allow_None=True, constant=False, default=None, instantiate=True, is_instance=True, pickle_default_value=True, precedence=None, readonly=False, watchers={} ) - Number of discrete colors to use when colormapping or a set of color intervals defining the range of values to map each color to.
-
param Dict
clipping_colors( allow_None=False, constant=False, default={}, instantiate=True, is_instance=True, pickle_default_value=True, precedence=None, readonly=False, watchers={} ) - Dictionary to specify colors for clipped values, allows setting color for NaN values and for values above and below the min and max value. The min, max or NaN color may specify an RGB(A) color as a color hex string of the form #FFFFFF or #FFFFFFFF or a length 3 or length 4 tuple specifying values in the range 0-1 or a named HTML color.
-
param Number
cbar_padding( allow_None=False, bounds=None, constant=False, default=0.01, inclusive_bounds=(True, True), instantiate=False, pickle_default_value=True, precedence=None, readonly=False, softbounds=None, time_dependent=False, time_fn=<Time Time00001>, watchers={} ) - Padding between colorbar and other plots.
-
param Parameter
cbar_ticks( allow_None=True, constant=False, default=None, instantiate=False, pickle_default_value=True, precedence=None, readonly=False, watchers={} ) - Ticks along colorbar-axis specified as an integer, explicit list of tick locations, list of tuples containing the locations and labels or a matplotlib tick locator object. If set to None default matplotlib ticking behavior is applied.
-
param Number
cbar_width( allow_None=False, bounds=None, constant=False, default=0.05, inclusive_bounds=(True, True), instantiate=False, pickle_default_value=True, precedence=None, readonly=False, softbounds=None, time_dependent=False, time_fn=<Time Time00001>, watchers={} ) - Width of the colorbar as a fraction of the main plot
-
param Boolean
symmetric( allow_None=False, bounds=(0, 1), constant=False, default=False, instantiate=False, pickle_default_value=True, precedence=None, readonly=False, watchers={} ) - Whether to make the colormap symmetric around zero.
-
param Integer
azimuth( allow_None=False, bounds=(-180, 180), constant=False, default=-60, inclusive_bounds=(True, True), instantiate=False, pickle_default_value=True, precedence=None, readonly=False, softbounds=None, time_dependent=False, time_fn=<Time Time00001>, watchers={} ) - Azimuth angle in the x,y plane.
-
param Integer
elevation( allow_None=False, bounds=(0, 180), constant=False, default=30, inclusive_bounds=(True, True), instantiate=False, pickle_default_value=True, precedence=None, readonly=False, softbounds=None, time_dependent=False, time_fn=<Time Time00001>, watchers={} ) - Elevation angle in the z-axis.
-
param Integer
distance( allow_None=False, bounds=(7, 15), constant=False, default=10, inclusive_bounds=(True, True), instantiate=False, pickle_default_value=True, precedence=None, readonly=False, softbounds=None, time_dependent=False, time_fn=<Time Time00001>, watchers={} ) - Distance from the plotted object.
-
param Boolean
disable_axes( allow_None=False, bounds=(0, 1), constant=False, default=False, instantiate=False, pickle_default_value=True, precedence=None, readonly=False, watchers={} ) - Disable all axes.
-
anim( start=0 , stop=None , fps=30 ) ¶ -
Method to return a matplotlib animation. The start and stop frames may be specified as well as the fps.
-
cleanup( ) ¶ -
Cleans up references to the plot on the attached Stream subscribers.
-
compute_ranges( obj , key , ranges ) ¶ -
Given an object, a specific key, and the normalization options, this method will find the specified normalization options on the appropriate OptionTree, group the elements according to the selected normalization option (i.e. either per frame or over the whole animation) and finally compute the dimension ranges in each group. The new set of ranges is returned.
-
debug( *args , **kwargs ) ¶ -
Inspect .param.debug method for the full docstring
-
defaults( *args , **kwargs ) ¶ -
Inspect .param.defaults method for the full docstring
-
force_new_dynamic_value= functools.partial(<function Parameters.deprecate.<locals>.inner>, <class 'holoviews.plotting.mpl.chart3d.Plot3D'>) 
-
get_aspect( xspan , yspan ) ¶ -
Computes the aspect ratio of the plot
-
get_extents( element , ranges , range_type='combined' , xdim=None , ydim=None , zdim=None ) ¶ -
Gets the extents for the axes from the current Element. The globally computed ranges can optionally override the extents.
The extents are computed by combining the data ranges, extents and dimension ranges. Each of these can be obtained individually by setting the range_type to one of:
- ‘data’: Just the data ranges
- ‘extents’: Element.extents
- ‘soft’: Dimension.soft_range values
- ‘hard’: Dimension.range values
To obtain the combined range, which includes range padding the default may be used:
- ‘combined’: All the range types combined and padding applied
This allows Overlay plots to obtain each range and combine them appropriately for all the objects in the overlay.
-
get_padding( extents ) ¶ -
Computes padding along the axes taking into account the plot aspect.
-
get_param_values= functools.partial(<function Parameters.deprecate.<locals>.inner>, <class 'holoviews.plotting.mpl.chart3d.Plot3D'>) 
-
get_value_generator= functools.partial(<function Parameters.deprecate.<locals>.inner>, <class 'holoviews.plotting.mpl.chart3d.Plot3D'>) 
-
get_zorder( overlay , key , el ) ¶ -
Computes the z-order of element in the NdOverlay taking into account possible batching of elements.
-
init_artists( ax , plot_args , plot_kwargs ) ¶ -
Initializes the artist based on the plot method declared on the plot.
-
init_comm( ) ¶ -
Initializes comm and attaches streams.
-
inspect_value= functools.partial(<function Parameters.deprecate.<locals>.inner>, <class 'holoviews.plotting.mpl.chart3d.Plot3D'>) 
-
matches( spec ) ¶ -
Matches a specification against the current Plot.
-
message( *args , **kwargs ) ¶ -
Inspect .param.message method for the full docstring
-
params( *args , **kwargs ) ¶ -
Inspect .param.params method for the full docstring
-
pprint( imports=None , prefix=' ' , unknown_value='<?>' , qualify=False , separator='' ) ¶ -
(Experimental) Pretty printed representation that may be evaluated with eval. See pprint() function for more details.
-
print_param_defaults( *args , **kwargs ) ¶ -
Inspect .param.print_param_defaults method for the full docstring
-
print_param_values( *args , **kwargs ) ¶ -
Inspect .param.print_param_values method for the full docstring
-
push( ) ¶ -
Pushes updated plot data via the Comm.
-
refresh( **kwargs ) ¶ -
Refreshes the plot by rerendering it and then pushing the updated data if the plot has an associated Comm.
-
script_repr( imports=[] , prefix=' ' ) ¶ -
Variant of __repr__ designed for generating a runnable script.
-
set_default( *args , **kwargs ) ¶ -
Inspect .param.set_default method for the full docstring
-
set_dynamic_time_fn= functools.partial(<function Parameters.deprecate.<locals>.inner>, <class 'holoviews.plotting.mpl.chart3d.Plot3D'>) 
-
set_param= functools.partial(<function Parameters.deprecate.<locals>.inner>, <class 'holoviews.plotting.mpl.chart3d.Plot3D'>) 
-
state_pop( ) ¶ -
Restore the most recently saved state.
See state_push() for more details.
-
state_push( ) ¶ -
Save this instance’s state.
For Parameterized instances, this includes the state of dynamically generated values.
Subclasses that maintain short-term state should additionally save and restore that state using state_push() and state_pop().
Generally, this method is used by operations that need to test something without permanently altering the objects’ state.
-
teardown_handles( ) ¶ -
If no custom update_handles method is supplied this method is called to tear down any previous handles before replacing them.
-
traverse( fn=None , specs=None , full_breadth=True ) ¶ -
Traverses any nested DimensionedPlot returning a list of all plots that match the specs. The specs should be supplied as a list of either Plot types or callables, which should return a boolean given the plot class.
-
update_handles( key , axis , element , ranges , style ) ¶ -
Update the elements of the plot.
-
verbose( *args , **kwargs ) ¶ -
Inspect .param.verbose method for the full docstring
-
warning( *args , **kwargs ) ¶ -
Inspect .param.warning method for the full docstring
-
param Parameter
-
class
holoviews.plotting.mpl.chart3d.Scatter3DPlot( *args , **kwargs ) [source] ¶ -
Bases:
holoviews.plotting.mpl.chart3d.Plot3D,holoviews.plotting.mpl.chart.PointPlotSubclass of PointPlot allowing plotting of Points on a 3D axis, also allows mapping color and size onto a particular Dimension of the data.
-
param Parameter
fontsize( allow_None=True, constant=False, default=None, instantiate=False, pickle_default_value=True, precedence=None, readonly=False, watchers={} ) - Specifies various font sizes of the displayed text. Finer control is available by supplying a dictionary where any unmentioned keys revert to the default sizes, e.g: {‘ticks’:20, ‘title’:15, ‘ylabel’:5, ‘xlabel’:5, ‘zlabel’:5, ‘legend’:8, ‘legend_title’:13} You can set the font size of ‘zlabel’, ‘ylabel’ and ‘xlabel’ together using the ‘labels’ key.
-
param Boolean
show_title( allow_None=False, bounds=(0, 1), constant=False, default=True, instantiate=False, pickle_default_value=True, precedence=None, readonly=False, watchers={} ) - Whether to display the plot title.
-
param String
title( allow_None=False, basestring=<class ‘str’>, constant=False, default={label} {group} {dimensions}, instantiate=False, pickle_default_value=True, precedence=None, readonly=False, regex=None, watchers={} ) - The formatting string for the title of this plot, allows defining a label group separator and dimension labels.
-
param String
title_format( allow_None=True, basestring=<class ‘str’>, constant=False, default=None, instantiate=False, pickle_default_value=True, precedence=None, readonly=False, regex=None, watchers={} ) - Alias for title.
-
param Boolean
normalize( allow_None=False, bounds=(0, 1), constant=False, default=True, instantiate=False, pickle_default_value=True, precedence=None, readonly=False, watchers={} ) - Whether to compute ranges across all Elements at this level of plotting. Allows selecting normalization at different levels for nested data containers.
-
param ObjectSelector
projection( allow_None=True, check_on_set=True, compute_default_fn=None, constant=False, default=3d, instantiate=False, names=None, objects=[‘3d’], pickle_default_value=True, precedence=None, readonly=False, watchers={} ) - The projection of the matplotlib axis.
-
param Number
fig_alpha( allow_None=False, bounds=(0, 1), constant=False, default=1.0, inclusive_bounds=(True, True), instantiate=False, pickle_default_value=True, precedence=None, readonly=False, softbounds=None, time_dependent=False, time_fn=<Time Time00001>, watchers={} ) - Alpha of the overall figure background.
-
param NumericTuple
fig_bounds( allow_None=False, constant=False, default=(0.15, 0.15, 0.85, 0.85), instantiate=False, length=4, pickle_default_value=True, precedence=None, readonly=False, watchers={} ) - The bounds of the overall figure as a 4-tuple of the form (left, bottom, right, top), defining the size of the border around the subplots.
-
param Parameter
fig_inches( allow_None=False, constant=False, default=4, instantiate=False, pickle_default_value=True, precedence=None, readonly=False, watchers={} ) - The overall matplotlib figure size in inches. May be set as an integer in which case it will be used to autocompute a size. Alternatively may be set with an explicit tuple or list, in which case it will be applied directly after being scaled by fig_size. If either the width or height is set to None, it will be computed automatically.
-
param Boolean
fig_latex( allow_None=False, bounds=(0, 1), constant=False, default=False, instantiate=False, pickle_default_value=True, precedence=None, readonly=False, watchers={} ) - Whether to use LaTeX text in the overall figure.
-
param Dict
fig_rcparams( allow_None=False, constant=False, default={}, instantiate=True, is_instance=True, pickle_default_value=True, precedence=None, readonly=False, watchers={} ) - matplotlib rc parameters to apply to the overall figure.
-
param Number
fig_size( allow_None=False, bounds=(1, None), constant=False, default=100.0, inclusive_bounds=(True, True), instantiate=False, pickle_default_value=True, precedence=None, readonly=False, softbounds=None, time_dependent=False, time_fn=<Time Time00001>, watchers={} ) - Size relative to the supplied overall fig_inches in percent.
-
param HookList
initial_hooks( allow_None=False, bounds=(0, None), constant=False, default=[], instantiate=True, pickle_default_value=True, precedence=None, readonly=False, watchers={} ) - Optional list of hooks called before plotting the data onto the axis (now marked for deprecation). The hook is passed the plot object and the displayed object; other plotting handles can be accessed via plot.handles.
-
param HookList
finalize_hooks( allow_None=False, bounds=(0, None), constant=False, default=[], instantiate=True, pickle_default_value=True, precedence=None, readonly=False, watchers={} ) - Deprecated; use hooks options instead.
-
param HookList
hooks( allow_None=False, bounds=(0, None), constant=False, default=[], instantiate=True, pickle_default_value=True, precedence=None, readonly=False, watchers={} ) - Optional list of hooks called when finalizing a plot. The hook is passed the plot object and the displayed element, and other plotting handles can be accessed via plot.handles.
-
param String
sublabel_format( allow_None=True, basestring=<class ‘str’>, constant=False, default=None, instantiate=False, pickle_default_value=True, precedence=None, readonly=False, regex=None, watchers={} ) - Allows labeling the subaxes in each plot with various formatters including {Alpha}, {alpha}, {numeric} and {roman}.
-
param NumericTuple
sublabel_position( allow_None=False, constant=False, default=(-0.35, 0.85), instantiate=False, length=2, pickle_default_value=True, precedence=None, readonly=False, watchers={} ) - Position relative to the plot for placing the optional subfigure label.
-
param Number
sublabel_size( allow_None=False, bounds=None, constant=False, default=18, inclusive_bounds=(True, True), instantiate=False, pickle_default_value=True, precedence=None, readonly=False, softbounds=None, time_dependent=False, time_fn=<Time Time00001>, watchers={} ) - Size of optional subfigure label.
-
param Boolean
show_frame( allow_None=False, bounds=(0, 1), constant=False, default=False, instantiate=False, pickle_default_value=True, precedence=None, readonly=False, watchers={} ) - Whether or not to show a complete frame around the plot.
-
param Boolean
apply_ranges( allow_None=False, bounds=(0, 1), constant=False, default=True, instantiate=False, pickle_default_value=True, precedence=None, readonly=False, watchers={} ) - Whether to compute the plot bounds from the data itself.
-
param Boolean
apply_extents( allow_None=False, bounds=(0, 1), constant=False, default=True, instantiate=False, pickle_default_value=True, precedence=None, readonly=False, watchers={} ) - Whether to apply extent overrides on the Elements
-
param String
bgcolor( allow_None=False, basestring=<class ‘str’>, constant=False, default=white, instantiate=True, pickle_default_value=True, precedence=None, readonly=False, regex=None, watchers={} ) - Background color of the axis.
-
param ClassSelector
default_span( allow_None=False, constant=False, default=2.0, instantiate=True, is_instance=True, pickle_default_value=True, precedence=None, readonly=False, watchers={} ) - Defines the span of an axis if the axis range is zero, i.e. if the lower and upper end of an axis are equal or no range is defined at all. For example if there is a single datapoint at 0 a default_span of 2.0 will result in axis ranges spanning from -1 to 1.
-
param Boolean
invert_axes( allow_None=False, bounds=(0, 1), constant=False, default=False, instantiate=False, pickle_default_value=True, precedence=None, readonly=False, watchers={} ) - Whether to invert the x- and y-axis
-
param Boolean
invert_xaxis( allow_None=False, bounds=(0, 1), constant=False, default=False, instantiate=False, pickle_default_value=True, precedence=None, readonly=False, watchers={} ) - Whether to invert the plot x-axis.
-
param Boolean
invert_yaxis( allow_None=False, bounds=(0, 1), constant=False, default=False, instantiate=False, pickle_default_value=True, precedence=None, readonly=False, watchers={} ) - Whether to invert the plot y-axis.
-
param Boolean
logx( allow_None=False, bounds=(0, 1), constant=False, default=False, instantiate=False, pickle_default_value=True, precedence=None, readonly=False, watchers={} ) - Whether the x-axis of the plot will be a log axis.
-
param Boolean
logy( allow_None=False, bounds=(0, 1), constant=False, default=False, instantiate=False, pickle_default_value=True, precedence=None, readonly=False, watchers={} ) - Whether the y-axis of the plot will be a log axis.
-
param ClassSelector
padding( allow_None=False, constant=False, default=0, instantiate=True, is_instance=True, pickle_default_value=True, precedence=None, readonly=False, watchers={} ) - Fraction by which to increase auto-ranged extents to make datapoints more visible around borders. To compute padding, the axis whose screen size is largest is chosen, and the range of that axis is increased by the specified fraction along each axis. Other axes are then padded ensuring that the amount of screen space devoted to padding is equal for all axes. If specified as a tuple, the int or float values in the tuple will be used for padding in each axis, in order (x,y or x,y,z). For example, for padding=0.2 on a 800x800-pixel plot, an x-axis with the range [0,10] will be padded by 20% to be [-1,11], while a y-axis with a range [0,1000] will be padded to be [-100,1100], which should make the padding be approximately the same number of pixels. But if the same plot is changed to have a height of only 200, the y-range will then be [-400,1400] so that the y-axis padding will still match that of the x-axis. It is also possible to declare non-equal padding value for the lower and upper bound of an axis by supplying nested tuples, e.g. padding=(0.1, (0, 0.1)) will pad the x-axis lower and upper bound as well as the y-axis upper bound by a fraction of 0.1 while the y-axis lower bound is not padded at all.
-
param Boolean
show_legend( allow_None=False, bounds=(0, 1), constant=False, default=True, instantiate=False, pickle_default_value=True, precedence=None, readonly=False, watchers={} ) - Whether to show legend for the plot.
-
param Boolean
show_grid( allow_None=False, bounds=(0, 1), constant=False, default=True, instantiate=False, pickle_default_value=True, precedence=None, readonly=False, watchers={} ) - Whether to draw a grid in the figure.
-
param ObjectSelector
xaxis( allow_None=None, check_on_set=True, compute_default_fn=None, constant=False, default=fixed, instantiate=False, names=None, objects=[‘fixed’, None], pickle_default_value=True, precedence=None, readonly=False, watchers={} ) - Whether and where to display the xaxis.
-
param ObjectSelector
yaxis( allow_None=None, check_on_set=True, compute_default_fn=None, constant=False, default=fixed, instantiate=False, names=None, objects=[‘fixed’, None], pickle_default_value=True, precedence=None, readonly=False, watchers={} ) - Whether and where to display the yaxis.
-
param String
xlabel( allow_None=True, basestring=<class ‘str’>, constant=False, default=None, instantiate=False, pickle_default_value=True, precedence=None, readonly=False, regex=None, watchers={} ) - An explicit override of the x-axis label, if set takes precedence over the dimension label.
-
param String
ylabel( allow_None=True, basestring=<class ‘str’>, constant=False, default=None, instantiate=False, pickle_default_value=True, precedence=None, readonly=False, regex=None, watchers={} ) - An explicit override of the y-axis label, if set takes precedence over the dimension label.
-
param NumericTuple
xlim( allow_None=False, constant=False, default=(nan, nan), instantiate=False, length=2, pickle_default_value=True, precedence=None, readonly=False, watchers={} ) - User-specified x-axis range limits for the plot, as a tuple (low,high). If specified, takes precedence over data and dimension ranges.
-
param NumericTuple
ylim( allow_None=False, constant=False, default=(nan, nan), instantiate=False, length=2, pickle_default_value=True, precedence=None, readonly=False, watchers={} ) - User-specified x-axis range limits for the plot, as a tuple (low,high). If specified, takes precedence over data and dimension ranges.
-
param NumericTuple
zlim( allow_None=False, constant=False, default=(nan, nan), instantiate=False, length=2, pickle_default_value=True, precedence=None, readonly=False, watchers={} ) - User-specified z-axis range limits for the plot, as a tuple (low,high). If specified, takes precedence over data and dimension ranges.
-
param Integer
xrotation( allow_None=True, bounds=(0, 360), constant=False, default=None, inclusive_bounds=(True, True), instantiate=False, pickle_default_value=True, precedence=None, readonly=False, softbounds=None, time_dependent=False, time_fn=<Time Time00001>, watchers={} ) - Rotation angle of the xticks.
-
param Integer
yrotation( allow_None=True, bounds=(0, 360), constant=False, default=None, inclusive_bounds=(True, True), instantiate=False, pickle_default_value=True, precedence=None, readonly=False, softbounds=None, time_dependent=False, time_fn=<Time Time00001>, watchers={} ) - Rotation angle of the yticks.
-
param Parameter
xticks( allow_None=True, constant=False, default=None, instantiate=False, pickle_default_value=True, precedence=None, readonly=False, watchers={} ) - Ticks along x-axis specified as an integer, explicit list of tick locations, or bokeh Ticker object. If set to None default bokeh ticking behavior is applied.
-
param Parameter
yticks( allow_None=True, constant=False, default=None, instantiate=False, pickle_default_value=True, precedence=None, readonly=False, watchers={} ) - Ticks along y-axis specified as an integer, explicit list of tick locations, or bokeh Ticker object. If set to None default bokeh ticking behavior is applied.
-
param Boolean
apply_ticks( allow_None=False, bounds=(0, 1), constant=False, default=True, instantiate=False, pickle_default_value=True, precedence=None, readonly=False, watchers={} ) - Whether to apply custom ticks.
-
param Parameter
aspect( allow_None=False, constant=False, default=square, instantiate=False, pickle_default_value=True, precedence=None, readonly=False, watchers={} ) - The aspect ratio mode of the plot. By default, a plot may select its own appropriate aspect ratio but sometimes it may be necessary to force a square aspect ratio (e.g. to display the plot as an element of a grid). The modes ‘auto’ and ‘equal’ correspond to the axis modes of the same name in matplotlib, a numeric value may also be passed.
-
param Boolean
invert_zaxis( allow_None=False, bounds=(0, 1), constant=False, default=False, instantiate=False, pickle_default_value=True, precedence=None, readonly=False, watchers={} ) - Whether to invert the plot z-axis.
-
param List
labelled( allow_None=False, bounds=(0, None), constant=False, default=[‘x’, ‘y’, ‘z’], instantiate=True, pickle_default_value=True, precedence=None, readonly=False, watchers={} ) - Whether to plot the ‘x’, ‘y’ and ‘z’ labels.
-
param Boolean
logz( allow_None=False, bounds=(0, 1), constant=False, default=False, instantiate=False, pickle_default_value=True, precedence=None, readonly=False, watchers={} ) - Whether to apply log scaling to the y-axis of the Chart.
-
param ClassSelector
xformatter( allow_None=True, constant=False, default=None, instantiate=True, is_instance=True, pickle_default_value=True, precedence=None, readonly=False, watchers={} ) - Formatter for ticks along the x-axis.
-
param ClassSelector
yformatter( allow_None=True, constant=False, default=None, instantiate=True, is_instance=True, pickle_default_value=True, precedence=None, readonly=False, watchers={} ) - Formatter for ticks along the y-axis.
-
param ClassSelector
zformatter( allow_None=True, constant=False, default=None, instantiate=True, is_instance=True, pickle_default_value=True, precedence=None, readonly=False, watchers={} ) - Formatter for ticks along the z-axis.
-
param ObjectSelector
zaxis( allow_None=False, check_on_set=True, compute_default_fn=None, constant=False, default=fixed, instantiate=False, names=None, objects=[‘fixed’, None], pickle_default_value=True, precedence=None, readonly=False, watchers={} ) - Whether and where to display the yaxis.
-
param String
zlabel( allow_None=True, basestring=<class ‘str’>, constant=False, default=None, instantiate=False, pickle_default_value=True, precedence=None, readonly=False, regex=None, watchers={} ) - An explicit override of the z-axis label, if set takes precedence over the dimension label.
-
param Integer
zrotation( allow_None=False, bounds=(0, 360), constant=False, default=0, inclusive_bounds=(True, True), instantiate=False, pickle_default_value=True, precedence=None, readonly=False, softbounds=None, time_dependent=False, time_fn=<Time Time00001>, watchers={} ) - Rotation angle of the zticks.
-
param Parameter
zticks( allow_None=True, constant=False, default=None, instantiate=False, pickle_default_value=True, precedence=None, readonly=False, watchers={} ) - Ticks along z-axis specified as an integer, explicit list of tick locations, list of tuples containing the locations and labels or a matplotlib tick locator object. If set to None default matplotlib ticking behavior is applied.
-
param Boolean
colorbar( allow_None=False, bounds=(0, 1), constant=False, default=False, instantiate=False, pickle_default_value=True, precedence=None, readonly=False, watchers={} ) - Whether to draw a colorbar.
-
param ClassSelector
color_levels( allow_None=True, constant=False, default=None, instantiate=True, is_instance=True, pickle_default_value=True, precedence=None, readonly=False, watchers={} ) - Number of discrete colors to use when colormapping or a set of color intervals defining the range of values to map each color to.
-
param Dict
clipping_colors( allow_None=False, constant=False, default={}, instantiate=True, is_instance=True, pickle_default_value=True, precedence=None, readonly=False, watchers={} ) - Dictionary to specify colors for clipped values, allows setting color for NaN values and for values above and below the min and max value. The min, max or NaN color may specify an RGB(A) color as a color hex string of the form #FFFFFF or #FFFFFFFF or a length 3 or length 4 tuple specifying values in the range 0-1 or a named HTML color.
-
param Number
cbar_padding( allow_None=False, bounds=None, constant=False, default=0.01, inclusive_bounds=(True, True), instantiate=False, pickle_default_value=True, precedence=None, readonly=False, softbounds=None, time_dependent=False, time_fn=<Time Time00001>, watchers={} ) - Padding between colorbar and other plots.
-
param Parameter
cbar_ticks( allow_None=True, constant=False, default=None, instantiate=False, pickle_default_value=True, precedence=None, readonly=False, watchers={} ) - Ticks along colorbar-axis specified as an integer, explicit list of tick locations, list of tuples containing the locations and labels or a matplotlib tick locator object. If set to None default matplotlib ticking behavior is applied.
-
param Number
cbar_width( allow_None=False, bounds=None, constant=False, default=0.05, inclusive_bounds=(True, True), instantiate=False, pickle_default_value=True, precedence=None, readonly=False, softbounds=None, time_dependent=False, time_fn=<Time Time00001>, watchers={} ) - Width of the colorbar as a fraction of the main plot
-
param Boolean
symmetric( allow_None=False, bounds=(0, 1), constant=False, default=False, instantiate=False, pickle_default_value=True, precedence=None, readonly=False, watchers={} ) - Whether to make the colormap symmetric around zero.
-
param ClassSelector
color_index( allow_None=True, constant=False, default=None, instantiate=True, is_instance=True, pickle_default_value=True, precedence=None, readonly=False, watchers={} ) - Index of the dimension from which the color will the drawn
-
param ClassSelector
size_index( allow_None=True, constant=False, default=None, instantiate=True, is_instance=True, pickle_default_value=True, precedence=None, readonly=False, watchers={} ) - Index of the dimension from which the sizes will the drawn.
-
param ObjectSelector
scaling_method( allow_None=None, check_on_set=True, compute_default_fn=None, constant=False, default=area, instantiate=False, names=None, objects=[‘width’, ‘area’], pickle_default_value=True, precedence=None, readonly=False, watchers={} ) - Deprecated in favor of size style mapping, e.g. size=dim(‘size’)**2.
-
param Number
scaling_factor( allow_None=False, bounds=(0, None), constant=False, default=1, inclusive_bounds=(True, True), instantiate=False, pickle_default_value=True, precedence=None, readonly=False, softbounds=None, time_dependent=False, time_fn=<Time Time00001>, watchers={} ) - Scaling factor which is applied to either the width or area of each point, depending on the value of scaling_method .
-
param Callable
size_fn( allow_None=False, constant=False, default=<ufunc ‘absolute’>, instantiate=False, pickle_default_value=True, precedence=None, readonly=False, watchers={} ) - Function applied to size values before applying scaling, to remove values lower than zero.
-
param Integer
azimuth( allow_None=False, bounds=(-180, 180), constant=False, default=-60, inclusive_bounds=(True, True), instantiate=False, pickle_default_value=True, precedence=None, readonly=False, softbounds=None, time_dependent=False, time_fn=<Time Time00001>, watchers={} ) - Azimuth angle in the x,y plane.
-
param Integer
elevation( allow_None=False, bounds=(0, 180), constant=False, default=30, inclusive_bounds=(True, True), instantiate=False, pickle_default_value=True, precedence=None, readonly=False, softbounds=None, time_dependent=False, time_fn=<Time Time00001>, watchers={} ) - Elevation angle in the z-axis.
-
param Integer
distance( allow_None=False, bounds=(7, 15), constant=False, default=10, inclusive_bounds=(True, True), instantiate=False, pickle_default_value=True, precedence=None, readonly=False, softbounds=None, time_dependent=False, time_fn=<Time Time00001>, watchers={} ) - Distance from the plotted object.
-
param Boolean
disable_axes( allow_None=False, bounds=(0, 1), constant=False, default=False, instantiate=False, pickle_default_value=True, precedence=None, readonly=False, watchers={} ) - Disable all axes.
-
anim( start=0 , stop=None , fps=30 ) ¶ -
Method to return a matplotlib animation. The start and stop frames may be specified as well as the fps.
-
cleanup( ) ¶ -
Cleans up references to the plot on the attached Stream subscribers.
-
compute_ranges( obj , key , ranges ) ¶ -
Given an object, a specific key, and the normalization options, this method will find the specified normalization options on the appropriate OptionTree, group the elements according to the selected normalization option (i.e. either per frame or over the whole animation) and finally compute the dimension ranges in each group. The new set of ranges is returned.
-
debug( *args , **kwargs ) ¶ -
Inspect .param.debug method for the full docstring
-
defaults( *args , **kwargs ) ¶ -
Inspect .param.defaults method for the full docstring
-
force_new_dynamic_value= functools.partial(<function Parameters.deprecate.<locals>.inner>, <class 'holoviews.plotting.mpl.chart3d.Scatter3DPlot'>) 
-
get_aspect( xspan , yspan ) ¶ -
Computes the aspect ratio of the plot
-
get_extents( element , ranges , range_type='combined' , xdim=None , ydim=None , zdim=None ) ¶ -
Gets the extents for the axes from the current Element. The globally computed ranges can optionally override the extents.
The extents are computed by combining the data ranges, extents and dimension ranges. Each of these can be obtained individually by setting the range_type to one of:
- ‘data’: Just the data ranges
- ‘extents’: Element.extents
- ‘soft’: Dimension.soft_range values
- ‘hard’: Dimension.range values
To obtain the combined range, which includes range padding the default may be used:
- ‘combined’: All the range types combined and padding applied
This allows Overlay plots to obtain each range and combine them appropriately for all the objects in the overlay.
-
get_padding( extents ) ¶ -
Computes padding along the axes taking into account the plot aspect.
-
get_param_values= functools.partial(<function Parameters.deprecate.<locals>.inner>, <class 'holoviews.plotting.mpl.chart3d.Scatter3DPlot'>) 
-
get_value_generator= functools.partial(<function Parameters.deprecate.<locals>.inner>, <class 'holoviews.plotting.mpl.chart3d.Scatter3DPlot'>) 
-
get_zorder( overlay , key , el ) ¶ -
Computes the z-order of element in the NdOverlay taking into account possible batching of elements.
-
init_artists( ax , plot_args , plot_kwargs ) ¶ -
Initializes the artist based on the plot method declared on the plot.
-
init_comm( ) ¶ -
Initializes comm and attaches streams.
-
inspect_value= functools.partial(<function Parameters.deprecate.<locals>.inner>, <class 'holoviews.plotting.mpl.chart3d.Scatter3DPlot'>) 
-
matches( spec ) ¶ -
Matches a specification against the current Plot.
-
message( *args , **kwargs ) ¶ -
Inspect .param.message method for the full docstring
-
params( *args , **kwargs ) ¶ -
Inspect .param.params method for the full docstring
-
pprint( imports=None , prefix=' ' , unknown_value='<?>' , qualify=False , separator='' ) ¶ -
(Experimental) Pretty printed representation that may be evaluated with eval. See pprint() function for more details.
-
print_param_defaults( *args , **kwargs ) ¶ -
Inspect .param.print_param_defaults method for the full docstring
-
print_param_values( *args , **kwargs ) ¶ -
Inspect .param.print_param_values method for the full docstring
-
push( ) ¶ -
Pushes updated plot data via the Comm.
-
refresh( **kwargs ) ¶ -
Refreshes the plot by rerendering it and then pushing the updated data if the plot has an associated Comm.
-
script_repr( imports=[] , prefix=' ' ) ¶ -
Variant of __repr__ designed for generating a runnable script.
-
set_default( *args , **kwargs ) ¶ -
Inspect .param.set_default method for the full docstring
-
set_dynamic_time_fn= functools.partial(<function Parameters.deprecate.<locals>.inner>, <class 'holoviews.plotting.mpl.chart3d.Scatter3DPlot'>) 
-
set_param= functools.partial(<function Parameters.deprecate.<locals>.inner>, <class 'holoviews.plotting.mpl.chart3d.Scatter3DPlot'>) 
-
size_fn= <ufunc 'absolute'> 
-
state_pop( ) ¶ -
Restore the most recently saved state.
See state_push() for more details.
-
state_push( ) ¶ -
Save this instance’s state.
For Parameterized instances, this includes the state of dynamically generated values.
Subclasses that maintain short-term state should additionally save and restore that state using state_push() and state_pop().
Generally, this method is used by operations that need to test something without permanently altering the objects’ state.
-
teardown_handles( ) ¶ -
If no custom update_handles method is supplied this method is called to tear down any previous handles before replacing them.
-
traverse( fn=None , specs=None , full_breadth=True ) ¶ -
Traverses any nested DimensionedPlot returning a list of all plots that match the specs. The specs should be supplied as a list of either Plot types or callables, which should return a boolean given the plot class.
-
verbose( *args , **kwargs ) ¶ -
Inspect .param.verbose method for the full docstring
-
warning( *args , **kwargs ) ¶ -
Inspect .param.warning method for the full docstring
-
param Parameter
-
class
holoviews.plotting.mpl.chart3d.SurfacePlot( *args , **kwargs ) [source] ¶ -
Bases:
holoviews.plotting.mpl.chart3d.Plot3DPlots surfaces wireframes and contours in 3D space. Provides options to switch the display type via the plot_type parameter has support for a number of styling options including strides and colors.
-
param Parameter
fontsize( allow_None=True, constant=False, default=None, instantiate=False, pickle_default_value=True, precedence=None, readonly=False, watchers={} ) - Specifies various font sizes of the displayed text. Finer control is available by supplying a dictionary where any unmentioned keys revert to the default sizes, e.g: {‘ticks’:20, ‘title’:15, ‘ylabel’:5, ‘xlabel’:5, ‘zlabel’:5, ‘legend’:8, ‘legend_title’:13} You can set the font size of ‘zlabel’, ‘ylabel’ and ‘xlabel’ together using the ‘labels’ key.
-
param Boolean
show_title( allow_None=False, bounds=(0, 1), constant=False, default=True, instantiate=False, pickle_default_value=True, precedence=None, readonly=False, watchers={} ) - Whether to display the plot title.
-
param String
title( allow_None=False, basestring=<class ‘str’>, constant=False, default={label} {group} {dimensions}, instantiate=False, pickle_default_value=True, precedence=None, readonly=False, regex=None, watchers={} ) - The formatting string for the title of this plot, allows defining a label group separator and dimension labels.
-
param String
title_format( allow_None=True, basestring=<class ‘str’>, constant=False, default=None, instantiate=False, pickle_default_value=True, precedence=None, readonly=False, regex=None, watchers={} ) - Alias for title.
-
param Boolean
normalize( allow_None=False, bounds=(0, 1), constant=False, default=True, instantiate=False, pickle_default_value=True, precedence=None, readonly=False, watchers={} ) - Whether to compute ranges across all Elements at this level of plotting. Allows selecting normalization at different levels for nested data containers.
-
param ObjectSelector
projection( allow_None=True, check_on_set=True, compute_default_fn=None, constant=False, default=3d, instantiate=False, names=None, objects=[‘3d’], pickle_default_value=True, precedence=None, readonly=False, watchers={} ) - The projection of the matplotlib axis.
-
param Number
fig_alpha( allow_None=False, bounds=(0, 1), constant=False, default=1.0, inclusive_bounds=(True, True), instantiate=False, pickle_default_value=True, precedence=None, readonly=False, softbounds=None, time_dependent=False, time_fn=<Time Time00001>, watchers={} ) - Alpha of the overall figure background.
-
param NumericTuple
fig_bounds( allow_None=False, constant=False, default=(0.15, 0.15, 0.85, 0.85), instantiate=False, length=4, pickle_default_value=True, precedence=None, readonly=False, watchers={} ) - The bounds of the overall figure as a 4-tuple of the form (left, bottom, right, top), defining the size of the border around the subplots.
-
param Parameter
fig_inches( allow_None=False, constant=False, default=4, instantiate=False, pickle_default_value=True, precedence=None, readonly=False, watchers={} ) - The overall matplotlib figure size in inches. May be set as an integer in which case it will be used to autocompute a size. Alternatively may be set with an explicit tuple or list, in which case it will be applied directly after being scaled by fig_size. If either the width or height is set to None, it will be computed automatically.
-
param Boolean
fig_latex( allow_None=False, bounds=(0, 1), constant=False, default=False, instantiate=False, pickle_default_value=True, precedence=None, readonly=False, watchers={} ) - Whether to use LaTeX text in the overall figure.
-
param Dict
fig_rcparams( allow_None=False, constant=False, default={}, instantiate=True, is_instance=True, pickle_default_value=True, precedence=None, readonly=False, watchers={} ) - matplotlib rc parameters to apply to the overall figure.
-
param Number
fig_size( allow_None=False, bounds=(1, None), constant=False, default=100.0, inclusive_bounds=(True, True), instantiate=False, pickle_default_value=True, precedence=None, readonly=False, softbounds=None, time_dependent=False, time_fn=<Time Time00001>, watchers={} ) - Size relative to the supplied overall fig_inches in percent.
-
param HookList
initial_hooks( allow_None=False, bounds=(0, None), constant=False, default=[], instantiate=True, pickle_default_value=True, precedence=None, readonly=False, watchers={} ) - Optional list of hooks called before plotting the data onto the axis (now marked for deprecation). The hook is passed the plot object and the displayed object; other plotting handles can be accessed via plot.handles.
-
param HookList
finalize_hooks( allow_None=False, bounds=(0, None), constant=False, default=[], instantiate=True, pickle_default_value=True, precedence=None, readonly=False, watchers={} ) - Deprecated; use hooks options instead.
-
param HookList
hooks( allow_None=False, bounds=(0, None), constant=False, default=[], instantiate=True, pickle_default_value=True, precedence=None, readonly=False, watchers={} ) - Optional list of hooks called when finalizing a plot. The hook is passed the plot object and the displayed element, and other plotting handles can be accessed via plot.handles.
-
param String
sublabel_format( allow_None=True, basestring=<class ‘str’>, constant=False, default=None, instantiate=False, pickle_default_value=True, precedence=None, readonly=False, regex=None, watchers={} ) - Allows labeling the subaxes in each plot with various formatters including {Alpha}, {alpha}, {numeric} and {roman}.
-
param NumericTuple
sublabel_position( allow_None=False, constant=False, default=(-0.35, 0.85), instantiate=False, length=2, pickle_default_value=True, precedence=None, readonly=False, watchers={} ) - Position relative to the plot for placing the optional subfigure label.
-
param Number
sublabel_size( allow_None=False, bounds=None, constant=False, default=18, inclusive_bounds=(True, True), instantiate=False, pickle_default_value=True, precedence=None, readonly=False, softbounds=None, time_dependent=False, time_fn=<Time Time00001>, watchers={} ) - Size of optional subfigure label.
-
param Boolean
show_frame( allow_None=False, bounds=(0, 1), constant=False, default=False, instantiate=False, pickle_default_value=True, precedence=None, readonly=False, watchers={} ) - Whether or not to show a complete frame around the plot.
-
param Boolean
apply_ranges( allow_None=False, bounds=(0, 1), constant=False, default=True, instantiate=False, pickle_default_value=True, precedence=None, readonly=False, watchers={} ) - Whether to compute the plot bounds from the data itself.
-
param Boolean
apply_extents( allow_None=False, bounds=(0, 1), constant=False, default=True, instantiate=False, pickle_default_value=True, precedence=None, readonly=False, watchers={} ) - Whether to apply extent overrides on the Elements
-
param String
bgcolor( allow_None=False, basestring=<class ‘str’>, constant=False, default=white, instantiate=True, pickle_default_value=True, precedence=None, readonly=False, regex=None, watchers={} ) - Background color of the axis.
-
param ClassSelector
default_span( allow_None=False, constant=False, default=2.0, instantiate=True, is_instance=True, pickle_default_value=True, precedence=None, readonly=False, watchers={} ) - Defines the span of an axis if the axis range is zero, i.e. if the lower and upper end of an axis are equal or no range is defined at all. For example if there is a single datapoint at 0 a default_span of 2.0 will result in axis ranges spanning from -1 to 1.
-
param Boolean
invert_axes( allow_None=False, bounds=(0, 1), constant=False, default=False, instantiate=False, pickle_default_value=True, precedence=None, readonly=False, watchers={} ) - Whether to invert the x- and y-axis
-
param Boolean
invert_xaxis( allow_None=False, bounds=(0, 1), constant=False, default=False, instantiate=False, pickle_default_value=True, precedence=None, readonly=False, watchers={} ) - Whether to invert the plot x-axis.
-
param Boolean
invert_yaxis( allow_None=False, bounds=(0, 1), constant=False, default=False, instantiate=False, pickle_default_value=True, precedence=None, readonly=False, watchers={} ) - Whether to invert the plot y-axis.
-
param Boolean
logx( allow_None=False, bounds=(0, 1), constant=False, default=False, instantiate=False, pickle_default_value=True, precedence=None, readonly=False, watchers={} ) - Whether the x-axis of the plot will be a log axis.
-
param Boolean
logy( allow_None=False, bounds=(0, 1), constant=False, default=False, instantiate=False, pickle_default_value=True, precedence=None, readonly=False, watchers={} ) - Whether the y-axis of the plot will be a log axis.
-
param ClassSelector
padding( allow_None=False, constant=False, default=0, instantiate=True, is_instance=True, pickle_default_value=True, precedence=None, readonly=False, watchers={} ) - Fraction by which to increase auto-ranged extents to make datapoints more visible around borders. To compute padding, the axis whose screen size is largest is chosen, and the range of that axis is increased by the specified fraction along each axis. Other axes are then padded ensuring that the amount of screen space devoted to padding is equal for all axes. If specified as a tuple, the int or float values in the tuple will be used for padding in each axis, in order (x,y or x,y,z). For example, for padding=0.2 on a 800x800-pixel plot, an x-axis with the range [0,10] will be padded by 20% to be [-1,11], while a y-axis with a range [0,1000] will be padded to be [-100,1100], which should make the padding be approximately the same number of pixels. But if the same plot is changed to have a height of only 200, the y-range will then be [-400,1400] so that the y-axis padding will still match that of the x-axis. It is also possible to declare non-equal padding value for the lower and upper bound of an axis by supplying nested tuples, e.g. padding=(0.1, (0, 0.1)) will pad the x-axis lower and upper bound as well as the y-axis upper bound by a fraction of 0.1 while the y-axis lower bound is not padded at all.
-
param Boolean
show_legend( allow_None=False, bounds=(0, 1), constant=False, default=True, instantiate=False, pickle_default_value=True, precedence=None, readonly=False, watchers={} ) - Whether to show legend for the plot.
-
param Boolean
show_grid( allow_None=False, bounds=(0, 1), constant=False, default=True, instantiate=False, pickle_default_value=True, precedence=None, readonly=False, watchers={} ) - Whether to draw a grid in the figure.
-
param ObjectSelector
xaxis( allow_None=None, check_on_set=True, compute_default_fn=None, constant=False, default=fixed, instantiate=False, names=None, objects=[‘fixed’, None], pickle_default_value=True, precedence=None, readonly=False, watchers={} ) - Whether and where to display the xaxis.
-
param ObjectSelector
yaxis( allow_None=None, check_on_set=True, compute_default_fn=None, constant=False, default=fixed, instantiate=False, names=None, objects=[‘fixed’, None], pickle_default_value=True, precedence=None, readonly=False, watchers={} ) - Whether and where to display the yaxis.
-
param String
xlabel( allow_None=True, basestring=<class ‘str’>, constant=False, default=None, instantiate=False, pickle_default_value=True, precedence=None, readonly=False, regex=None, watchers={} ) - An explicit override of the x-axis label, if set takes precedence over the dimension label.
-
param String
ylabel( allow_None=True, basestring=<class ‘str’>, constant=False, default=None, instantiate=False, pickle_default_value=True, precedence=None, readonly=False, regex=None, watchers={} ) - An explicit override of the y-axis label, if set takes precedence over the dimension label.
-
param NumericTuple
xlim( allow_None=False, constant=False, default=(nan, nan), instantiate=False, length=2, pickle_default_value=True, precedence=None, readonly=False, watchers={} ) - User-specified x-axis range limits for the plot, as a tuple (low,high). If specified, takes precedence over data and dimension ranges.
-
param NumericTuple
ylim( allow_None=False, constant=False, default=(nan, nan), instantiate=False, length=2, pickle_default_value=True, precedence=None, readonly=False, watchers={} ) - User-specified x-axis range limits for the plot, as a tuple (low,high). If specified, takes precedence over data and dimension ranges.
-
param NumericTuple
zlim( allow_None=False, constant=False, default=(nan, nan), instantiate=False, length=2, pickle_default_value=True, precedence=None, readonly=False, watchers={} ) - User-specified z-axis range limits for the plot, as a tuple (low,high). If specified, takes precedence over data and dimension ranges.
-
param Integer
xrotation( allow_None=True, bounds=(0, 360), constant=False, default=None, inclusive_bounds=(True, True), instantiate=False, pickle_default_value=True, precedence=None, readonly=False, softbounds=None, time_dependent=False, time_fn=<Time Time00001>, watchers={} ) - Rotation angle of the xticks.
-
param Integer
yrotation( allow_None=True, bounds=(0, 360), constant=False, default=None, inclusive_bounds=(True, True), instantiate=False, pickle_default_value=True, precedence=None, readonly=False, softbounds=None, time_dependent=False, time_fn=<Time Time00001>, watchers={} ) - Rotation angle of the yticks.
-
param Parameter
xticks( allow_None=True, constant=False, default=None, instantiate=False, pickle_default_value=True, precedence=None, readonly=False, watchers={} ) - Ticks along x-axis specified as an integer, explicit list of tick locations, or bokeh Ticker object. If set to None default bokeh ticking behavior is applied.
-
param Parameter
yticks( allow_None=True, constant=False, default=None, instantiate=False, pickle_default_value=True, precedence=None, readonly=False, watchers={} ) - Ticks along y-axis specified as an integer, explicit list of tick locations, or bokeh Ticker object. If set to None default bokeh ticking behavior is applied.
-
param Boolean
apply_ticks( allow_None=False, bounds=(0, 1), constant=False, default=True, instantiate=False, pickle_default_value=True, precedence=None, readonly=False, watchers={} ) - Whether to apply custom ticks.
-
param Parameter
aspect( allow_None=False, constant=False, default=square, instantiate=False, pickle_default_value=True, precedence=None, readonly=False, watchers={} ) - The aspect ratio mode of the plot. By default, a plot may select its own appropriate aspect ratio but sometimes it may be necessary to force a square aspect ratio (e.g. to display the plot as an element of a grid). The modes ‘auto’ and ‘equal’ correspond to the axis modes of the same name in matplotlib, a numeric value may also be passed.
-
param Boolean
invert_zaxis( allow_None=False, bounds=(0, 1), constant=False, default=False, instantiate=False, pickle_default_value=True, precedence=None, readonly=False, watchers={} ) - Whether to invert the plot z-axis.
-
param List
labelled( allow_None=False, bounds=(0, None), constant=False, default=[‘x’, ‘y’, ‘z’], instantiate=True, pickle_default_value=True, precedence=None, readonly=False, watchers={} ) - Whether to plot the ‘x’, ‘y’ and ‘z’ labels.
-
param Boolean
logz( allow_None=False, bounds=(0, 1), constant=False, default=False, instantiate=False, pickle_default_value=True, precedence=None, readonly=False, watchers={} ) - Whether to apply log scaling to the y-axis of the Chart.
-
param ClassSelector
xformatter( allow_None=True, constant=False, default=None, instantiate=True, is_instance=True, pickle_default_value=True, precedence=None, readonly=False, watchers={} ) - Formatter for ticks along the x-axis.
-
param ClassSelector
yformatter( allow_None=True, constant=False, default=None, instantiate=True, is_instance=True, pickle_default_value=True, precedence=None, readonly=False, watchers={} ) - Formatter for ticks along the y-axis.
-
param ClassSelector
zformatter( allow_None=True, constant=False, default=None, instantiate=True, is_instance=True, pickle_default_value=True, precedence=None, readonly=False, watchers={} ) - Formatter for ticks along the z-axis.
-
param ObjectSelector
zaxis( allow_None=False, check_on_set=True, compute_default_fn=None, constant=False, default=fixed, instantiate=False, names=None, objects=[‘fixed’, None], pickle_default_value=True, precedence=None, readonly=False, watchers={} ) - Whether and where to display the yaxis.
-
param String
zlabel( allow_None=True, basestring=<class ‘str’>, constant=False, default=None, instantiate=False, pickle_default_value=True, precedence=None, readonly=False, regex=None, watchers={} ) - An explicit override of the z-axis label, if set takes precedence over the dimension label.
-
param Integer
zrotation( allow_None=False, bounds=(0, 360), constant=False, default=0, inclusive_bounds=(True, True), instantiate=False, pickle_default_value=True, precedence=None, readonly=False, softbounds=None, time_dependent=False, time_fn=<Time Time00001>, watchers={} ) - Rotation angle of the zticks.
-
param Parameter
zticks( allow_None=True, constant=False, default=None, instantiate=False, pickle_default_value=True, precedence=None, readonly=False, watchers={} ) - Ticks along z-axis specified as an integer, explicit list of tick locations, list of tuples containing the locations and labels or a matplotlib tick locator object. If set to None default matplotlib ticking behavior is applied.
-
param Boolean
colorbar( allow_None=False, bounds=(0, 1), constant=False, default=False, instantiate=False, pickle_default_value=True, precedence=None, readonly=False, watchers={} ) - Whether to add a colorbar to the plot.
-
param ClassSelector
color_levels( allow_None=True, constant=False, default=None, instantiate=True, is_instance=True, pickle_default_value=True, precedence=None, readonly=False, watchers={} ) - Number of discrete colors to use when colormapping or a set of color intervals defining the range of values to map each color to.
-
param Dict
clipping_colors( allow_None=False, constant=False, default={}, instantiate=True, is_instance=True, pickle_default_value=True, precedence=None, readonly=False, watchers={} ) - Dictionary to specify colors for clipped values, allows setting color for NaN values and for values above and below the min and max value. The min, max or NaN color may specify an RGB(A) color as a color hex string of the form #FFFFFF or #FFFFFFFF or a length 3 or length 4 tuple specifying values in the range 0-1 or a named HTML color.
-
param Number
cbar_padding( allow_None=False, bounds=None, constant=False, default=0.01, inclusive_bounds=(True, True), instantiate=False, pickle_default_value=True, precedence=None, readonly=False, softbounds=None, time_dependent=False, time_fn=<Time Time00001>, watchers={} ) - Padding between colorbar and other plots.
-
param Parameter
cbar_ticks( allow_None=True, constant=False, default=None, instantiate=False, pickle_default_value=True, precedence=None, readonly=False, watchers={} ) - Ticks along colorbar-axis specified as an integer, explicit list of tick locations, list of tuples containing the locations and labels or a matplotlib tick locator object. If set to None default matplotlib ticking behavior is applied.
-
param Number
cbar_width( allow_None=False, bounds=None, constant=False, default=0.05, inclusive_bounds=(True, True), instantiate=False, pickle_default_value=True, precedence=None, readonly=False, softbounds=None, time_dependent=False, time_fn=<Time Time00001>, watchers={} ) - Width of the colorbar as a fraction of the main plot
-
param Boolean
symmetric( allow_None=False, bounds=(0, 1), constant=False, default=False, instantiate=False, pickle_default_value=True, precedence=None, readonly=False, watchers={} ) - Whether to make the colormap symmetric around zero.
-
param Integer
azimuth( allow_None=False, bounds=(-180, 180), constant=False, default=-60, inclusive_bounds=(True, True), instantiate=False, pickle_default_value=True, precedence=None, readonly=False, softbounds=None, time_dependent=False, time_fn=<Time Time00001>, watchers={} ) - Azimuth angle in the x,y plane.
-
param Integer
elevation( allow_None=False, bounds=(0, 180), constant=False, default=30, inclusive_bounds=(True, True), instantiate=False, pickle_default_value=True, precedence=None, readonly=False, softbounds=None, time_dependent=False, time_fn=<Time Time00001>, watchers={} ) - Elevation angle in the z-axis.
-
param Integer
distance( allow_None=False, bounds=(7, 15), constant=False, default=10, inclusive_bounds=(True, True), instantiate=False, pickle_default_value=True, precedence=None, readonly=False, softbounds=None, time_dependent=False, time_fn=<Time Time00001>, watchers={} ) - Distance from the plotted object.
-
param Boolean
disable_axes( allow_None=False, bounds=(0, 1), constant=False, default=False, instantiate=False, pickle_default_value=True, precedence=None, readonly=False, watchers={} ) - Disable all axes.
-
param ObjectSelector
plot_type( allow_None=None, check_on_set=True, compute_default_fn=None, constant=False, default=surface, instantiate=False, names=None, objects=[‘surface’, ‘wireframe’, ‘contour’], pickle_default_value=True, precedence=None, readonly=False, watchers={} ) - Specifies the type of visualization for the Surface object. Valid values are ‘surface’, ‘wireframe’ and ‘contour’.
-
anim( start=0 , stop=None , fps=30 ) ¶ -
Method to return a matplotlib animation. The start and stop frames may be specified as well as the fps.
-
cleanup( ) ¶ -
Cleans up references to the plot on the attached Stream subscribers.
-
compute_ranges( obj , key , ranges ) ¶ -
Given an object, a specific key, and the normalization options, this method will find the specified normalization options on the appropriate OptionTree, group the elements according to the selected normalization option (i.e. either per frame or over the whole animation) and finally compute the dimension ranges in each group. The new set of ranges is returned.
-
debug( *args , **kwargs ) ¶ -
Inspect .param.debug method for the full docstring
-
defaults( *args , **kwargs ) ¶ -
Inspect .param.defaults method for the full docstring
-
force_new_dynamic_value= functools.partial(<function Parameters.deprecate.<locals>.inner>, <class 'holoviews.plotting.mpl.chart3d.SurfacePlot'>) 
-
get_aspect( xspan , yspan ) ¶ -
Computes the aspect ratio of the plot
-
get_extents( element , ranges , range_type='combined' , xdim=None , ydim=None , zdim=None ) ¶ -
Gets the extents for the axes from the current Element. The globally computed ranges can optionally override the extents.
The extents are computed by combining the data ranges, extents and dimension ranges. Each of these can be obtained individually by setting the range_type to one of:
- ‘data’: Just the data ranges
- ‘extents’: Element.extents
- ‘soft’: Dimension.soft_range values
- ‘hard’: Dimension.range values
To obtain the combined range, which includes range padding the default may be used:
- ‘combined’: All the range types combined and padding applied
This allows Overlay plots to obtain each range and combine them appropriately for all the objects in the overlay.
-
get_padding( extents ) ¶ -
Computes padding along the axes taking into account the plot aspect.
-
get_param_values= functools.partial(<function Parameters.deprecate.<locals>.inner>, <class 'holoviews.plotting.mpl.chart3d.SurfacePlot'>) 
-
get_value_generator= functools.partial(<function Parameters.deprecate.<locals>.inner>, <class 'holoviews.plotting.mpl.chart3d.SurfacePlot'>) 
-
get_zorder( overlay , key , el ) ¶ -
Computes the z-order of element in the NdOverlay taking into account possible batching of elements.
-
init_comm( ) ¶ -
Initializes comm and attaches streams.
-
inspect_value= functools.partial(<function Parameters.deprecate.<locals>.inner>, <class 'holoviews.plotting.mpl.chart3d.SurfacePlot'>) 
-
matches( spec ) ¶ -
Matches a specification against the current Plot.
-
message( *args , **kwargs ) ¶ -
Inspect .param.message method for the full docstring
-
params( *args , **kwargs ) ¶ -
Inspect .param.params method for the full docstring
-
pprint( imports=None , prefix=' ' , unknown_value='<?>' , qualify=False , separator='' ) ¶ -
(Experimental) Pretty printed representation that may be evaluated with eval. See pprint() function for more details.
-
print_param_defaults( *args , **kwargs ) ¶ -
Inspect .param.print_param_defaults method for the full docstring
-
print_param_values( *args , **kwargs ) ¶ -
Inspect .param.print_param_values method for the full docstring
-
push( ) ¶ -
Pushes updated plot data via the Comm.
-
refresh( **kwargs ) ¶ -
Refreshes the plot by rerendering it and then pushing the updated data if the plot has an associated Comm.
-
script_repr( imports=[] , prefix=' ' ) ¶ -
Variant of __repr__ designed for generating a runnable script.
-
set_default( *args , **kwargs ) ¶ -
Inspect .param.set_default method for the full docstring
-
set_dynamic_time_fn= functools.partial(<function Parameters.deprecate.<locals>.inner>, <class 'holoviews.plotting.mpl.chart3d.SurfacePlot'>) 
-
set_param= functools.partial(<function Parameters.deprecate.<locals>.inner>, <class 'holoviews.plotting.mpl.chart3d.SurfacePlot'>) 
-
state_pop( ) ¶ -
Restore the most recently saved state.
See state_push() for more details.
-
state_push( ) ¶ -
Save this instance’s state.
For Parameterized instances, this includes the state of dynamically generated values.
Subclasses that maintain short-term state should additionally save and restore that state using state_push() and state_pop().
Generally, this method is used by operations that need to test something without permanently altering the objects’ state.
-
teardown_handles( ) ¶ -
If no custom update_handles method is supplied this method is called to tear down any previous handles before replacing them.
-
traverse( fn=None , specs=None , full_breadth=True ) ¶ -
Traverses any nested DimensionedPlot returning a list of all plots that match the specs. The specs should be supplied as a list of either Plot types or callables, which should return a boolean given the plot class.
-
update_handles( key , axis , element , ranges , style ) ¶ -
Update the elements of the plot.
-
verbose( *args , **kwargs ) ¶ -
Inspect .param.verbose method for the full docstring
-
warning( *args , **kwargs ) ¶ -
Inspect .param.warning method for the full docstring
-
param Parameter
-
class
holoviews.plotting.mpl.chart3d.TriSurfacePlot( *args , **kwargs ) [source] ¶ -
Bases:
holoviews.plotting.mpl.chart3d.Plot3DPlots a trisurface given a TriSurface element, containing X, Y and Z coordinates.
-
param Parameter
fontsize( allow_None=True, constant=False, default=None, instantiate=False, pickle_default_value=True, precedence=None, readonly=False, watchers={} ) - Specifies various font sizes of the displayed text. Finer control is available by supplying a dictionary where any unmentioned keys revert to the default sizes, e.g: {‘ticks’:20, ‘title’:15, ‘ylabel’:5, ‘xlabel’:5, ‘zlabel’:5, ‘legend’:8, ‘legend_title’:13} You can set the font size of ‘zlabel’, ‘ylabel’ and ‘xlabel’ together using the ‘labels’ key.
-
param Boolean
show_title( allow_None=False, bounds=(0, 1), constant=False, default=True, instantiate=False, pickle_default_value=True, precedence=None, readonly=False, watchers={} ) - Whether to display the plot title.
-
param String
title( allow_None=False, basestring=<class ‘str’>, constant=False, default={label} {group} {dimensions}, instantiate=False, pickle_default_value=True, precedence=None, readonly=False, regex=None, watchers={} ) - The formatting string for the title of this plot, allows defining a label group separator and dimension labels.
-
param String
title_format( allow_None=True, basestring=<class ‘str’>, constant=False, default=None, instantiate=False, pickle_default_value=True, precedence=None, readonly=False, regex=None, watchers={} ) - Alias for title.
-
param Boolean
normalize( allow_None=False, bounds=(0, 1), constant=False, default=True, instantiate=False, pickle_default_value=True, precedence=None, readonly=False, watchers={} ) - Whether to compute ranges across all Elements at this level of plotting. Allows selecting normalization at different levels for nested data containers.
-
param ObjectSelector
projection( allow_None=True, check_on_set=True, compute_default_fn=None, constant=False, default=3d, instantiate=False, names=None, objects=[‘3d’], pickle_default_value=True, precedence=None, readonly=False, watchers={} ) - The projection of the matplotlib axis.
-
param Number
fig_alpha( allow_None=False, bounds=(0, 1), constant=False, default=1.0, inclusive_bounds=(True, True), instantiate=False, pickle_default_value=True, precedence=None, readonly=False, softbounds=None, time_dependent=False, time_fn=<Time Time00001>, watchers={} ) - Alpha of the overall figure background.
-
param NumericTuple
fig_bounds( allow_None=False, constant=False, default=(0.15, 0.15, 0.85, 0.85), instantiate=False, length=4, pickle_default_value=True, precedence=None, readonly=False, watchers={} ) - The bounds of the overall figure as a 4-tuple of the form (left, bottom, right, top), defining the size of the border around the subplots.
-
param Parameter
fig_inches( allow_None=False, constant=False, default=4, instantiate=False, pickle_default_value=True, precedence=None, readonly=False, watchers={} ) - The overall matplotlib figure size in inches. May be set as an integer in which case it will be used to autocompute a size. Alternatively may be set with an explicit tuple or list, in which case it will be applied directly after being scaled by fig_size. If either the width or height is set to None, it will be computed automatically.
-
param Boolean
fig_latex( allow_None=False, bounds=(0, 1), constant=False, default=False, instantiate=False, pickle_default_value=True, precedence=None, readonly=False, watchers={} ) - Whether to use LaTeX text in the overall figure.
-
param Dict
fig_rcparams( allow_None=False, constant=False, default={}, instantiate=True, is_instance=True, pickle_default_value=True, precedence=None, readonly=False, watchers={} ) - matplotlib rc parameters to apply to the overall figure.
-
param Number
fig_size( allow_None=False, bounds=(1, None), constant=False, default=100.0, inclusive_bounds=(True, True), instantiate=False, pickle_default_value=True, precedence=None, readonly=False, softbounds=None, time_dependent=False, time_fn=<Time Time00001>, watchers={} ) - Size relative to the supplied overall fig_inches in percent.
-
param HookList
initial_hooks( allow_None=False, bounds=(0, None), constant=False, default=[], instantiate=True, pickle_default_value=True, precedence=None, readonly=False, watchers={} ) - Optional list of hooks called before plotting the data onto the axis (now marked for deprecation). The hook is passed the plot object and the displayed object; other plotting handles can be accessed via plot.handles.
-
param HookList
finalize_hooks( allow_None=False, bounds=(0, None), constant=False, default=[], instantiate=True, pickle_default_value=True, precedence=None, readonly=False, watchers={} ) - Deprecated; use hooks options instead.
-
param HookList
hooks( allow_None=False, bounds=(0, None), constant=False, default=[], instantiate=True, pickle_default_value=True, precedence=None, readonly=False, watchers={} ) - Optional list of hooks called when finalizing a plot. The hook is passed the plot object and the displayed element, and other plotting handles can be accessed via plot.handles.
-
param String
sublabel_format( allow_None=True, basestring=<class ‘str’>, constant=False, default=None, instantiate=False, pickle_default_value=True, precedence=None, readonly=False, regex=None, watchers={} ) - Allows labeling the subaxes in each plot with various formatters including {Alpha}, {alpha}, {numeric} and {roman}.
-
param NumericTuple
sublabel_position( allow_None=False, constant=False, default=(-0.35, 0.85), instantiate=False, length=2, pickle_default_value=True, precedence=None, readonly=False, watchers={} ) - Position relative to the plot for placing the optional subfigure label.
-
param Number
sublabel_size( allow_None=False, bounds=None, constant=False, default=18, inclusive_bounds=(True, True), instantiate=False, pickle_default_value=True, precedence=None, readonly=False, softbounds=None, time_dependent=False, time_fn=<Time Time00001>, watchers={} ) - Size of optional subfigure label.
-
param Boolean
show_frame( allow_None=False, bounds=(0, 1), constant=False, default=False, instantiate=False, pickle_default_value=True, precedence=None, readonly=False, watchers={} ) - Whether or not to show a complete frame around the plot.
-
param Boolean
apply_ranges( allow_None=False, bounds=(0, 1), constant=False, default=True, instantiate=False, pickle_default_value=True, precedence=None, readonly=False, watchers={} ) - Whether to compute the plot bounds from the data itself.
-
param Boolean
apply_extents( allow_None=False, bounds=(0, 1), constant=False, default=True, instantiate=False, pickle_default_value=True, precedence=None, readonly=False, watchers={} ) - Whether to apply extent overrides on the Elements
-
param String
bgcolor( allow_None=False, basestring=<class ‘str’>, constant=False, default=white, instantiate=True, pickle_default_value=True, precedence=None, readonly=False, regex=None, watchers={} ) - Background color of the axis.
-
param ClassSelector
default_span( allow_None=False, constant=False, default=2.0, instantiate=True, is_instance=True, pickle_default_value=True, precedence=None, readonly=False, watchers={} ) - Defines the span of an axis if the axis range is zero, i.e. if the lower and upper end of an axis are equal or no range is defined at all. For example if there is a single datapoint at 0 a default_span of 2.0 will result in axis ranges spanning from -1 to 1.
-
param Boolean
invert_axes( allow_None=False, bounds=(0, 1), constant=False, default=False, instantiate=False, pickle_default_value=True, precedence=None, readonly=False, watchers={} ) - Whether to invert the x- and y-axis
-
param Boolean
invert_xaxis( allow_None=False, bounds=(0, 1), constant=False, default=False, instantiate=False, pickle_default_value=True, precedence=None, readonly=False, watchers={} ) - Whether to invert the plot x-axis.
-
param Boolean
invert_yaxis( allow_None=False, bounds=(0, 1), constant=False, default=False, instantiate=False, pickle_default_value=True, precedence=None, readonly=False, watchers={} ) - Whether to invert the plot y-axis.
-
param Boolean
logx( allow_None=False, bounds=(0, 1), constant=False, default=False, instantiate=False, pickle_default_value=True, precedence=None, readonly=False, watchers={} ) - Whether the x-axis of the plot will be a log axis.
-
param Boolean
logy( allow_None=False, bounds=(0, 1), constant=False, default=False, instantiate=False, pickle_default_value=True, precedence=None, readonly=False, watchers={} ) - Whether the y-axis of the plot will be a log axis.
-
param ClassSelector
padding( allow_None=False, constant=False, default=0, instantiate=True, is_instance=True, pickle_default_value=True, precedence=None, readonly=False, watchers={} ) - Fraction by which to increase auto-ranged extents to make datapoints more visible around borders. To compute padding, the axis whose screen size is largest is chosen, and the range of that axis is increased by the specified fraction along each axis. Other axes are then padded ensuring that the amount of screen space devoted to padding is equal for all axes. If specified as a tuple, the int or float values in the tuple will be used for padding in each axis, in order (x,y or x,y,z). For example, for padding=0.2 on a 800x800-pixel plot, an x-axis with the range [0,10] will be padded by 20% to be [-1,11], while a y-axis with a range [0,1000] will be padded to be [-100,1100], which should make the padding be approximately the same number of pixels. But if the same plot is changed to have a height of only 200, the y-range will then be [-400,1400] so that the y-axis padding will still match that of the x-axis. It is also possible to declare non-equal padding value for the lower and upper bound of an axis by supplying nested tuples, e.g. padding=(0.1, (0, 0.1)) will pad the x-axis lower and upper bound as well as the y-axis upper bound by a fraction of 0.1 while the y-axis lower bound is not padded at all.
-
param Boolean
show_legend( allow_None=False, bounds=(0, 1), constant=False, default=True, instantiate=False, pickle_default_value=True, precedence=None, readonly=False, watchers={} ) - Whether to show legend for the plot.
-
param Boolean
show_grid( allow_None=False, bounds=(0, 1), constant=False, default=True, instantiate=False, pickle_default_value=True, precedence=None, readonly=False, watchers={} ) - Whether to draw a grid in the figure.
-
param ObjectSelector
xaxis( allow_None=None, check_on_set=True, compute_default_fn=None, constant=False, default=fixed, instantiate=False, names=None, objects=[‘fixed’, None], pickle_default_value=True, precedence=None, readonly=False, watchers={} ) - Whether and where to display the xaxis.
-
param ObjectSelector
yaxis( allow_None=None, check_on_set=True, compute_default_fn=None, constant=False, default=fixed, instantiate=False, names=None, objects=[‘fixed’, None], pickle_default_value=True, precedence=None, readonly=False, watchers={} ) - Whether and where to display the yaxis.
-
param String
xlabel( allow_None=True, basestring=<class ‘str’>, constant=False, default=None, instantiate=False, pickle_default_value=True, precedence=None, readonly=False, regex=None, watchers={} ) - An explicit override of the x-axis label, if set takes precedence over the dimension label.
-
param String
ylabel( allow_None=True, basestring=<class ‘str’>, constant=False, default=None, instantiate=False, pickle_default_value=True, precedence=None, readonly=False, regex=None, watchers={} ) - An explicit override of the y-axis label, if set takes precedence over the dimension label.
-
param NumericTuple
xlim( allow_None=False, constant=False, default=(nan, nan), instantiate=False, length=2, pickle_default_value=True, precedence=None, readonly=False, watchers={} ) - User-specified x-axis range limits for the plot, as a tuple (low,high). If specified, takes precedence over data and dimension ranges.
-
param NumericTuple
ylim( allow_None=False, constant=False, default=(nan, nan), instantiate=False, length=2, pickle_default_value=True, precedence=None, readonly=False, watchers={} ) - User-specified x-axis range limits for the plot, as a tuple (low,high). If specified, takes precedence over data and dimension ranges.
-
param NumericTuple
zlim( allow_None=False, constant=False, default=(nan, nan), instantiate=False, length=2, pickle_default_value=True, precedence=None, readonly=False, watchers={} ) - User-specified z-axis range limits for the plot, as a tuple (low,high). If specified, takes precedence over data and dimension ranges.
-
param Integer
xrotation( allow_None=True, bounds=(0, 360), constant=False, default=None, inclusive_bounds=(True, True), instantiate=False, pickle_default_value=True, precedence=None, readonly=False, softbounds=None, time_dependent=False, time_fn=<Time Time00001>, watchers={} ) - Rotation angle of the xticks.
-
param Integer
yrotation( allow_None=True, bounds=(0, 360), constant=False, default=None, inclusive_bounds=(True, True), instantiate=False, pickle_default_value=True, precedence=None, readonly=False, softbounds=None, time_dependent=False, time_fn=<Time Time00001>, watchers={} ) - Rotation angle of the yticks.
-
param Parameter
xticks( allow_None=True, constant=False, default=None, instantiate=False, pickle_default_value=True, precedence=None, readonly=False, watchers={} ) - Ticks along x-axis specified as an integer, explicit list of tick locations, or bokeh Ticker object. If set to None default bokeh ticking behavior is applied.
-
param Parameter
yticks( allow_None=True, constant=False, default=None, instantiate=False, pickle_default_value=True, precedence=None, readonly=False, watchers={} ) - Ticks along y-axis specified as an integer, explicit list of tick locations, or bokeh Ticker object. If set to None default bokeh ticking behavior is applied.
-
param Boolean
apply_ticks( allow_None=False, bounds=(0, 1), constant=False, default=True, instantiate=False, pickle_default_value=True, precedence=None, readonly=False, watchers={} ) - Whether to apply custom ticks.
-
param Parameter
aspect( allow_None=False, constant=False, default=square, instantiate=False, pickle_default_value=True, precedence=None, readonly=False, watchers={} ) - The aspect ratio mode of the plot. By default, a plot may select its own appropriate aspect ratio but sometimes it may be necessary to force a square aspect ratio (e.g. to display the plot as an element of a grid). The modes ‘auto’ and ‘equal’ correspond to the axis modes of the same name in matplotlib, a numeric value may also be passed.
-
param Boolean
invert_zaxis( allow_None=False, bounds=(0, 1), constant=False, default=False, instantiate=False, pickle_default_value=True, precedence=None, readonly=False, watchers={} ) - Whether to invert the plot z-axis.
-
param List
labelled( allow_None=False, bounds=(0, None), constant=False, default=[‘x’, ‘y’, ‘z’], instantiate=True, pickle_default_value=True, precedence=None, readonly=False, watchers={} ) - Whether to plot the ‘x’, ‘y’ and ‘z’ labels.
-
param Boolean
logz( allow_None=False, bounds=(0, 1), constant=False, default=False, instantiate=False, pickle_default_value=True, precedence=None, readonly=False, watchers={} ) - Whether to apply log scaling to the y-axis of the Chart.
-
param ClassSelector
xformatter( allow_None=True, constant=False, default=None, instantiate=True, is_instance=True, pickle_default_value=True, precedence=None, readonly=False, watchers={} ) - Formatter for ticks along the x-axis.
-
param ClassSelector
yformatter( allow_None=True, constant=False, default=None, instantiate=True, is_instance=True, pickle_default_value=True, precedence=None, readonly=False, watchers={} ) - Formatter for ticks along the y-axis.
-
param ClassSelector
zformatter( allow_None=True, constant=False, default=None, instantiate=True, is_instance=True, pickle_default_value=True, precedence=None, readonly=False, watchers={} ) - Formatter for ticks along the z-axis.
-
param ObjectSelector
zaxis( allow_None=False, check_on_set=True, compute_default_fn=None, constant=False, default=fixed, instantiate=False, names=None, objects=[‘fixed’, None], pickle_default_value=True, precedence=None, readonly=False, watchers={} ) - Whether and where to display the yaxis.
-
param String
zlabel( allow_None=True, basestring=<class ‘str’>, constant=False, default=None, instantiate=False, pickle_default_value=True, precedence=None, readonly=False, regex=None, watchers={} ) - An explicit override of the z-axis label, if set takes precedence over the dimension label.
-
param Integer
zrotation( allow_None=False, bounds=(0, 360), constant=False, default=0, inclusive_bounds=(True, True), instantiate=False, pickle_default_value=True, precedence=None, readonly=False, softbounds=None, time_dependent=False, time_fn=<Time Time00001>, watchers={} ) - Rotation angle of the zticks.
-
param Parameter
zticks( allow_None=True, constant=False, default=None, instantiate=False, pickle_default_value=True, precedence=None, readonly=False, watchers={} ) - Ticks along z-axis specified as an integer, explicit list of tick locations, list of tuples containing the locations and labels or a matplotlib tick locator object. If set to None default matplotlib ticking behavior is applied.
-
param Boolean
colorbar( allow_None=False, bounds=(0, 1), constant=False, default=False, instantiate=False, pickle_default_value=True, precedence=None, readonly=False, watchers={} ) - Whether to add a colorbar to the plot.
-
param ClassSelector
color_levels( allow_None=True, constant=False, default=None, instantiate=True, is_instance=True, pickle_default_value=True, precedence=None, readonly=False, watchers={} ) - Number of discrete colors to use when colormapping or a set of color intervals defining the range of values to map each color to.
-
param Dict
clipping_colors( allow_None=False, constant=False, default={}, instantiate=True, is_instance=True, pickle_default_value=True, precedence=None, readonly=False, watchers={} ) - Dictionary to specify colors for clipped values, allows setting color for NaN values and for values above and below the min and max value. The min, max or NaN color may specify an RGB(A) color as a color hex string of the form #FFFFFF or #FFFFFFFF or a length 3 or length 4 tuple specifying values in the range 0-1 or a named HTML color.
-
param Number
cbar_padding( allow_None=False, bounds=None, constant=False, default=0.01, inclusive_bounds=(True, True), instantiate=False, pickle_default_value=True, precedence=None, readonly=False, softbounds=None, time_dependent=False, time_fn=<Time Time00001>, watchers={} ) - Padding between colorbar and other plots.
-
param Parameter
cbar_ticks( allow_None=True, constant=False, default=None, instantiate=False, pickle_default_value=True, precedence=None, readonly=False, watchers={} ) - Ticks along colorbar-axis specified as an integer, explicit list of tick locations, list of tuples containing the locations and labels or a matplotlib tick locator object. If set to None default matplotlib ticking behavior is applied.
-
param Number
cbar_width( allow_None=False, bounds=None, constant=False, default=0.05, inclusive_bounds=(True, True), instantiate=False, pickle_default_value=True, precedence=None, readonly=False, softbounds=None, time_dependent=False, time_fn=<Time Time00001>, watchers={} ) - Width of the colorbar as a fraction of the main plot
-
param Boolean
symmetric( allow_None=False, bounds=(0, 1), constant=False, default=False, instantiate=False, pickle_default_value=True, precedence=None, readonly=False, watchers={} ) - Whether to make the colormap symmetric around zero.
-
param Integer
azimuth( allow_None=False, bounds=(-180, 180), constant=False, default=-60, inclusive_bounds=(True, True), instantiate=False, pickle_default_value=True, precedence=None, readonly=False, softbounds=None, time_dependent=False, time_fn=<Time Time00001>, watchers={} ) - Azimuth angle in the x,y plane.
-
param Integer
elevation( allow_None=False, bounds=(0, 180), constant=False, default=30, inclusive_bounds=(True, True), instantiate=False, pickle_default_value=True, precedence=None, readonly=False, softbounds=None, time_dependent=False, time_fn=<Time Time00001>, watchers={} ) - Elevation angle in the z-axis.
-
param Integer
distance( allow_None=False, bounds=(7, 15), constant=False, default=10, inclusive_bounds=(True, True), instantiate=False, pickle_default_value=True, precedence=None, readonly=False, softbounds=None, time_dependent=False, time_fn=<Time Time00001>, watchers={} ) - Distance from the plotted object.
-
param Boolean
disable_axes( allow_None=False, bounds=(0, 1), constant=False, default=False, instantiate=False, pickle_default_value=True, precedence=None, readonly=False, watchers={} ) - Disable all axes.
-
anim( start=0 , stop=None , fps=30 ) ¶ -
Method to return a matplotlib animation. The start and stop frames may be specified as well as the fps.
-
cleanup( ) ¶ -
Cleans up references to the plot on the attached Stream subscribers.
-
compute_ranges( obj , key , ranges ) ¶ -
Given an object, a specific key, and the normalization options, this method will find the specified normalization options on the appropriate OptionTree, group the elements according to the selected normalization option (i.e. either per frame or over the whole animation) and finally compute the dimension ranges in each group. The new set of ranges is returned.
-
debug( *args , **kwargs ) ¶ -
Inspect .param.debug method for the full docstring
-
defaults( *args , **kwargs ) ¶ -
Inspect .param.defaults method for the full docstring
-
force_new_dynamic_value= functools.partial(<function Parameters.deprecate.<locals>.inner>, <class 'holoviews.plotting.mpl.chart3d.TriSurfacePlot'>) 
-
get_aspect( xspan , yspan ) ¶ -
Computes the aspect ratio of the plot
-
get_extents( element , ranges , range_type='combined' , xdim=None , ydim=None , zdim=None ) ¶ -
Gets the extents for the axes from the current Element. The globally computed ranges can optionally override the extents.
The extents are computed by combining the data ranges, extents and dimension ranges. Each of these can be obtained individually by setting the range_type to one of:
- ‘data’: Just the data ranges
- ‘extents’: Element.extents
- ‘soft’: Dimension.soft_range values
- ‘hard’: Dimension.range values
To obtain the combined range, which includes range padding the default may be used:
- ‘combined’: All the range types combined and padding applied
This allows Overlay plots to obtain each range and combine them appropriately for all the objects in the overlay.
-
get_padding( extents ) ¶ -
Computes padding along the axes taking into account the plot aspect.
-
get_param_values= functools.partial(<function Parameters.deprecate.<locals>.inner>, <class 'holoviews.plotting.mpl.chart3d.TriSurfacePlot'>) 
-
get_value_generator= functools.partial(<function Parameters.deprecate.<locals>.inner>, <class 'holoviews.plotting.mpl.chart3d.TriSurfacePlot'>) 
-
get_zorder( overlay , key , el ) ¶ -
Computes the z-order of element in the NdOverlay taking into account possible batching of elements.
-
init_artists( ax , plot_args , plot_kwargs ) ¶ -
Initializes the artist based on the plot method declared on the plot.
-
init_comm( ) ¶ -
Initializes comm and attaches streams.
-
inspect_value= functools.partial(<function Parameters.deprecate.<locals>.inner>, <class 'holoviews.plotting.mpl.chart3d.TriSurfacePlot'>) 
-
matches( spec ) ¶ -
Matches a specification against the current Plot.
-
message( *args , **kwargs ) ¶ -
Inspect .param.message method for the full docstring
-
params( *args , **kwargs ) ¶ -
Inspect .param.params method for the full docstring
-
pprint( imports=None , prefix=' ' , unknown_value='<?>' , qualify=False , separator='' ) ¶ -
(Experimental) Pretty printed representation that may be evaluated with eval. See pprint() function for more details.
-
print_param_defaults( *args , **kwargs ) ¶ -
Inspect .param.print_param_defaults method for the full docstring
-
print_param_values( *args , **kwargs ) ¶ -
Inspect .param.print_param_values method for the full docstring
-
push( ) ¶ -
Pushes updated plot data via the Comm.
-
refresh( **kwargs ) ¶ -
Refreshes the plot by rerendering it and then pushing the updated data if the plot has an associated Comm.
-
script_repr( imports=[] , prefix=' ' ) ¶ -
Variant of __repr__ designed for generating a runnable script.
-
set_default( *args , **kwargs ) ¶ -
Inspect .param.set_default method for the full docstring
-
set_dynamic_time_fn= functools.partial(<function Parameters.deprecate.<locals>.inner>, <class 'holoviews.plotting.mpl.chart3d.TriSurfacePlot'>) 
-
set_param= functools.partial(<function Parameters.deprecate.<locals>.inner>, <class 'holoviews.plotting.mpl.chart3d.TriSurfacePlot'>) 
-
state_pop( ) ¶ -
Restore the most recently saved state.
See state_push() for more details.
-
state_push( ) ¶ -
Save this instance’s state.
For Parameterized instances, this includes the state of dynamically generated values.
Subclasses that maintain short-term state should additionally save and restore that state using state_push() and state_pop().
Generally, this method is used by operations that need to test something without permanently altering the objects’ state.
-
teardown_handles( ) ¶ -
If no custom update_handles method is supplied this method is called to tear down any previous handles before replacing them.
-
traverse( fn=None , specs=None , full_breadth=True ) ¶ -
Traverses any nested DimensionedPlot returning a list of all plots that match the specs. The specs should be supplied as a list of either Plot types or callables, which should return a boolean given the plot class.
-
update_handles( key , axis , element , ranges , style ) ¶ -
Update the elements of the plot.
-
verbose( *args , **kwargs ) ¶ -
Inspect .param.verbose method for the full docstring
-
warning( *args , **kwargs ) ¶ -
Inspect .param.warning method for the full docstring
-
param Parameter
comms
Module
element
Module

-
class
holoviews.plotting.mpl.element.OverlayPlot( overlay , ranges=None , **params ) [source] ¶ -
Bases:
holoviews.plotting.mpl.element.LegendPlot,holoviews.plotting.plot.GenericOverlayPlotOverlayPlot supports compositors processing of Overlays across maps.
-
param Parameter
fontsize( allow_None=True, constant=False, default=None, instantiate=False, pickle_default_value=True, precedence=None, readonly=False, watchers={} ) - Specifies various font sizes of the displayed text. Finer control is available by supplying a dictionary where any unmentioned keys revert to the default sizes, e.g: {‘ticks’:20, ‘title’:15, ‘ylabel’:5, ‘xlabel’:5, ‘zlabel’:5, ‘legend’:8, ‘legend_title’:13} You can set the font size of ‘zlabel’, ‘ylabel’ and ‘xlabel’ together using the ‘labels’ key.
-
param Boolean
show_title( allow_None=False, bounds=(0, 1), constant=False, default=True, instantiate=False, pickle_default_value=True, precedence=None, readonly=False, watchers={} ) - Whether to display the plot title.
-
param String
title( allow_None=False, basestring=<class ‘str’>, constant=False, default={label} {group} {dimensions}, instantiate=False, pickle_default_value=True, precedence=None, readonly=False, regex=None, watchers={} ) - The formatting string for the title of this plot, allows defining a label group separator and dimension labels.
-
param String
title_format( allow_None=True, basestring=<class ‘str’>, constant=False, default=None, instantiate=False, pickle_default_value=True, precedence=None, readonly=False, regex=None, watchers={} ) - Alias for title.
-
param Boolean
normalize( allow_None=False, bounds=(0, 1), constant=False, default=True, instantiate=False, pickle_default_value=True, precedence=None, readonly=False, watchers={} ) - Whether to compute ranges across all Elements at this level of plotting. Allows selecting normalization at different levels for nested data containers.
-
param Parameter
projection( allow_None=True, constant=False, default=None, instantiate=False, pickle_default_value=True, precedence=None, readonly=False, watchers={} ) - The projection of the plot axis, default of None is equivalent to 2D plot, ‘3d’ and ‘polar’ are also supported by matplotlib by default. May also supply a custom projection that is either a matplotlib projection type or implements the _as_mpl_axes method.
-
param Number
fig_alpha( allow_None=False, bounds=(0, 1), constant=False, default=1.0, inclusive_bounds=(True, True), instantiate=False, pickle_default_value=True, precedence=None, readonly=False, softbounds=None, time_dependent=False, time_fn=<Time Time00001>, watchers={} ) - Alpha of the overall figure background.
-
param NumericTuple
fig_bounds( allow_None=False, constant=False, default=(0.15, 0.15, 0.85, 0.85), instantiate=False, length=4, pickle_default_value=True, precedence=None, readonly=False, watchers={} ) - The bounds of the overall figure as a 4-tuple of the form (left, bottom, right, top), defining the size of the border around the subplots.
-
param Parameter
fig_inches( allow_None=False, constant=False, default=4, instantiate=False, pickle_default_value=True, precedence=None, readonly=False, watchers={} ) - The overall matplotlib figure size in inches. May be set as an integer in which case it will be used to autocompute a size. Alternatively may be set with an explicit tuple or list, in which case it will be applied directly after being scaled by fig_size. If either the width or height is set to None, it will be computed automatically.
-
param Boolean
fig_latex( allow_None=False, bounds=(0, 1), constant=False, default=False, instantiate=False, pickle_default_value=True, precedence=None, readonly=False, watchers={} ) - Whether to use LaTeX text in the overall figure.
-
param Dict
fig_rcparams( allow_None=False, constant=False, default={}, instantiate=True, is_instance=True, pickle_default_value=True, precedence=None, readonly=False, watchers={} ) - matplotlib rc parameters to apply to the overall figure.
-
param Number
fig_size( allow_None=False, bounds=(1, None), constant=False, default=100.0, inclusive_bounds=(True, True), instantiate=False, pickle_default_value=True, precedence=None, readonly=False, softbounds=None, time_dependent=False, time_fn=<Time Time00001>, watchers={} ) - Size relative to the supplied overall fig_inches in percent.
-
param HookList
initial_hooks( allow_None=False, bounds=(0, None), constant=False, default=[], instantiate=True, pickle_default_value=True, precedence=None, readonly=False, watchers={} ) - Optional list of hooks called before plotting the data onto the axis (now marked for deprecation). The hook is passed the plot object and the displayed object; other plotting handles can be accessed via plot.handles.
-
param HookList
finalize_hooks( allow_None=False, bounds=(0, None), constant=False, default=[], instantiate=True, pickle_default_value=True, precedence=None, readonly=False, watchers={} ) - Deprecated; use hooks options instead.
-
param HookList
hooks( allow_None=False, bounds=(0, None), constant=False, default=[], instantiate=True, pickle_default_value=True, precedence=None, readonly=False, watchers={} ) - Optional list of hooks called when finalizing a plot. The hook is passed the plot object and the displayed element, and other plotting handles can be accessed via plot.handles.
-
param String
sublabel_format( allow_None=True, basestring=<class ‘str’>, constant=False, default=None, instantiate=False, pickle_default_value=True, precedence=None, readonly=False, regex=None, watchers={} ) - Allows labeling the subaxes in each plot with various formatters including {Alpha}, {alpha}, {numeric} and {roman}.
-
param NumericTuple
sublabel_position( allow_None=False, constant=False, default=(-0.35, 0.85), instantiate=False, length=2, pickle_default_value=True, precedence=None, readonly=False, watchers={} ) - Position relative to the plot for placing the optional subfigure label.
-
param Number
sublabel_size( allow_None=False, bounds=None, constant=False, default=18, inclusive_bounds=(True, True), instantiate=False, pickle_default_value=True, precedence=None, readonly=False, softbounds=None, time_dependent=False, time_fn=<Time Time00001>, watchers={} ) - Size of optional subfigure label.
-
param Boolean
show_frame( allow_None=False, bounds=(0, 1), constant=False, default=False, instantiate=False, pickle_default_value=True, precedence=None, readonly=False, watchers={} ) - Whether or not to show a complete frame around the plot.
-
param Boolean
apply_ranges( allow_None=False, bounds=(0, 1), constant=False, default=True, instantiate=False, pickle_default_value=True, precedence=None, readonly=False, watchers={} ) - Whether to compute the plot bounds from the data itself.
-
param Boolean
apply_extents( allow_None=False, bounds=(0, 1), constant=False, default=True, instantiate=False, pickle_default_value=True, precedence=None, readonly=False, watchers={} ) - Whether to apply extent overrides on the Elements
-
param ClassSelector
bgcolor( allow_None=True, constant=False, default=None, instantiate=True, is_instance=True, pickle_default_value=True, precedence=None, readonly=False, watchers={} ) - If set bgcolor overrides the background color of the axis.
-
param ClassSelector
default_span( allow_None=False, constant=False, default=2.0, instantiate=True, is_instance=True, pickle_default_value=True, precedence=None, readonly=False, watchers={} ) - Defines the span of an axis if the axis range is zero, i.e. if the lower and upper end of an axis are equal or no range is defined at all. For example if there is a single datapoint at 0 a default_span of 2.0 will result in axis ranges spanning from -1 to 1.
-
param Boolean
invert_axes( allow_None=False, bounds=(0, 1), constant=False, default=False, instantiate=False, pickle_default_value=True, precedence=None, readonly=False, watchers={} ) - Whether to invert the x- and y-axis
-
param Boolean
invert_xaxis( allow_None=False, bounds=(0, 1), constant=False, default=False, instantiate=False, pickle_default_value=True, precedence=None, readonly=False, watchers={} ) - Whether to invert the plot x-axis.
-
param Boolean
invert_yaxis( allow_None=False, bounds=(0, 1), constant=False, default=False, instantiate=False, pickle_default_value=True, precedence=None, readonly=False, watchers={} ) - Whether to invert the plot y-axis.
-
param Boolean
logx( allow_None=False, bounds=(0, 1), constant=False, default=False, instantiate=False, pickle_default_value=True, precedence=None, readonly=False, watchers={} ) - Whether the x-axis of the plot will be a log axis.
-
param Boolean
logy( allow_None=False, bounds=(0, 1), constant=False, default=False, instantiate=False, pickle_default_value=True, precedence=None, readonly=False, watchers={} ) - Whether the y-axis of the plot will be a log axis.
-
param ClassSelector
padding( allow_None=False, constant=False, default=0, instantiate=True, is_instance=True, pickle_default_value=True, precedence=None, readonly=False, watchers={} ) - Fraction by which to increase auto-ranged extents to make datapoints more visible around borders. To compute padding, the axis whose screen size is largest is chosen, and the range of that axis is increased by the specified fraction along each axis. Other axes are then padded ensuring that the amount of screen space devoted to padding is equal for all axes. If specified as a tuple, the int or float values in the tuple will be used for padding in each axis, in order (x,y or x,y,z). For example, for padding=0.2 on a 800x800-pixel plot, an x-axis with the range [0,10] will be padded by 20% to be [-1,11], while a y-axis with a range [0,1000] will be padded to be [-100,1100], which should make the padding be approximately the same number of pixels. But if the same plot is changed to have a height of only 200, the y-range will then be [-400,1400] so that the y-axis padding will still match that of the x-axis. It is also possible to declare non-equal padding value for the lower and upper bound of an axis by supplying nested tuples, e.g. padding=(0.1, (0, 0.1)) will pad the x-axis lower and upper bound as well as the y-axis upper bound by a fraction of 0.1 while the y-axis lower bound is not padded at all.
-
param Boolean
show_legend( allow_None=False, bounds=(0, 1), constant=False, default=True, instantiate=False, pickle_default_value=True, precedence=None, readonly=False, watchers={} ) - Whether to show legend for the plot.
-
param Boolean
show_grid( allow_None=False, bounds=(0, 1), constant=False, default=False, instantiate=False, pickle_default_value=True, precedence=None, readonly=False, watchers={} ) - Whether to show a Cartesian grid on the plot.
-
param ObjectSelector
xaxis( allow_None=None, check_on_set=True, compute_default_fn=None, constant=False, default=bottom, instantiate=False, names=None, objects=[‘top’, ‘bottom’, ‘bare’, ‘top-bare’, ‘bottom-bare’, None, True, False], pickle_default_value=True, precedence=None, readonly=False, watchers={} ) - Whether and where to display the xaxis. The “bare” options allow suppressing all axis labels, including ticks and xlabel. Valid options are ‘top’, ‘bottom’, ‘bare’, ‘top-bare’ and ‘bottom-bare’.
-
param ObjectSelector
yaxis( allow_None=None, check_on_set=True, compute_default_fn=None, constant=False, default=left, instantiate=False, names=None, objects=[‘left’, ‘right’, ‘bare’, ‘left-bare’, ‘right-bare’, None, True, False], pickle_default_value=True, precedence=None, readonly=False, watchers={} ) - Whether and where to display the yaxis. The “bare” options allow suppressing all axis labels, including ticks and ylabel. Valid options are ‘left’, ‘right’, ‘bare’, ‘left-bare’ and ‘right-bare’.
-
param String
xlabel( allow_None=True, basestring=<class ‘str’>, constant=False, default=None, instantiate=False, pickle_default_value=True, precedence=None, readonly=False, regex=None, watchers={} ) - An explicit override of the x-axis label, if set takes precedence over the dimension label.
-
param String
ylabel( allow_None=True, basestring=<class ‘str’>, constant=False, default=None, instantiate=False, pickle_default_value=True, precedence=None, readonly=False, regex=None, watchers={} ) - An explicit override of the y-axis label, if set takes precedence over the dimension label.
-
param NumericTuple
xlim( allow_None=False, constant=False, default=(nan, nan), instantiate=False, length=2, pickle_default_value=True, precedence=None, readonly=False, watchers={} ) - User-specified x-axis range limits for the plot, as a tuple (low,high). If specified, takes precedence over data and dimension ranges.
-
param NumericTuple
ylim( allow_None=False, constant=False, default=(nan, nan), instantiate=False, length=2, pickle_default_value=True, precedence=None, readonly=False, watchers={} ) - User-specified x-axis range limits for the plot, as a tuple (low,high). If specified, takes precedence over data and dimension ranges.
-
param NumericTuple
zlim( allow_None=False, constant=False, default=(nan, nan), instantiate=False, length=2, pickle_default_value=True, precedence=None, readonly=False, watchers={} ) - User-specified z-axis range limits for the plot, as a tuple (low,high). If specified, takes precedence over data and dimension ranges.
-
param Integer
xrotation( allow_None=True, bounds=(0, 360), constant=False, default=None, inclusive_bounds=(True, True), instantiate=False, pickle_default_value=True, precedence=None, readonly=False, softbounds=None, time_dependent=False, time_fn=<Time Time00001>, watchers={} ) - Rotation angle of the xticks.
-
param Integer
yrotation( allow_None=True, bounds=(0, 360), constant=False, default=None, inclusive_bounds=(True, True), instantiate=False, pickle_default_value=True, precedence=None, readonly=False, softbounds=None, time_dependent=False, time_fn=<Time Time00001>, watchers={} ) - Rotation angle of the yticks.
-
param Parameter
xticks( allow_None=True, constant=False, default=None, instantiate=False, pickle_default_value=True, precedence=None, readonly=False, watchers={} ) - Ticks along x-axis specified as an integer, explicit list of tick locations, or bokeh Ticker object. If set to None default bokeh ticking behavior is applied.
-
param Parameter
yticks( allow_None=True, constant=False, default=None, instantiate=False, pickle_default_value=True, precedence=None, readonly=False, watchers={} ) - Ticks along y-axis specified as an integer, explicit list of tick locations, or bokeh Ticker object. If set to None default bokeh ticking behavior is applied.
-
param Boolean
batched( allow_None=False, bounds=(0, 1), constant=False, default=True, instantiate=False, pickle_default_value=True, precedence=None, readonly=False, watchers={} ) - Whether to plot Elements NdOverlay in a batched plotting call if possible. Disables legends and zorder may not be preserved.
-
param Integer
legend_limit( allow_None=False, bounds=None, constant=False, default=25, inclusive_bounds=(True, True), instantiate=False, pickle_default_value=True, precedence=None, readonly=False, softbounds=None, time_dependent=False, time_fn=<Time Time00001>, watchers={} ) - Number of rendered glyphs before legends are disabled.
-
param Integer
style_grouping( allow_None=False, bounds=None, constant=False, default=2, inclusive_bounds=(True, True), instantiate=False, pickle_default_value=True, precedence=None, readonly=False, softbounds=None, time_dependent=False, time_fn=<Time Time00001>, watchers={} ) - The length of the type.group.label spec that will be used to group Elements into style groups. A style_grouping value of 1 will group just by type, a value of 2 will group by type and group, and a value of 3 will group by the full specification.
-
param Boolean
apply_ticks( allow_None=False, bounds=(0, 1), constant=False, default=True, instantiate=False, pickle_default_value=True, precedence=None, readonly=False, watchers={} ) - Whether to apply custom ticks.
-
param Parameter
aspect( allow_None=False, constant=False, default=square, instantiate=False, pickle_default_value=True, precedence=None, readonly=False, watchers={} ) - The aspect ratio mode of the plot. By default, a plot may select its own appropriate aspect ratio but sometimes it may be necessary to force a square aspect ratio (e.g. to display the plot as an element of a grid). The modes ‘auto’ and ‘equal’ correspond to the axis modes of the same name in matplotlib, a numeric value may also be passed.
-
param Boolean
invert_zaxis( allow_None=False, bounds=(0, 1), constant=False, default=False, instantiate=False, pickle_default_value=True, precedence=None, readonly=False, watchers={} ) - Whether to invert the plot z-axis.
-
param List
labelled( allow_None=False, bounds=(0, None), constant=False, default=[‘x’, ‘y’], instantiate=True, pickle_default_value=True, precedence=None, readonly=False, watchers={} ) - Whether to plot the ‘x’ and ‘y’ labels.
-
param Boolean
logz( allow_None=False, bounds=(0, 1), constant=False, default=False, instantiate=False, pickle_default_value=True, precedence=None, readonly=False, watchers={} ) - Whether to apply log scaling to the y-axis of the Chart.
-
param ClassSelector
xformatter( allow_None=True, constant=False, default=None, instantiate=True, is_instance=True, pickle_default_value=True, precedence=None, readonly=False, watchers={} ) - Formatter for ticks along the x-axis.
-
param ClassSelector
yformatter( allow_None=True, constant=False, default=None, instantiate=True, is_instance=True, pickle_default_value=True, precedence=None, readonly=False, watchers={} ) - Formatter for ticks along the y-axis.
-
param ClassSelector
zformatter( allow_None=True, constant=False, default=None, instantiate=True, is_instance=True, pickle_default_value=True, precedence=None, readonly=False, watchers={} ) - Formatter for ticks along the z-axis.
-
param Boolean
zaxis( allow_None=False, bounds=(0, 1), constant=False, default=True, instantiate=False, pickle_default_value=True, precedence=None, readonly=False, watchers={} ) - Whether to display the z-axis.
-
param String
zlabel( allow_None=True, basestring=<class ‘str’>, constant=False, default=None, instantiate=False, pickle_default_value=True, precedence=None, readonly=False, regex=None, watchers={} ) - An explicit override of the z-axis label, if set takes precedence over the dimension label.
-
param Integer
zrotation( allow_None=False, bounds=(0, 360), constant=False, default=0, inclusive_bounds=(True, True), instantiate=False, pickle_default_value=True, precedence=None, readonly=False, softbounds=None, time_dependent=False, time_fn=<Time Time00001>, watchers={} ) - Rotation angle of the zticks.
-
param Parameter
zticks( allow_None=True, constant=False, default=None, instantiate=False, pickle_default_value=True, precedence=None, readonly=False, watchers={} ) - Ticks along z-axis specified as an integer, explicit list of tick locations, list of tuples containing the locations and labels or a matplotlib tick locator object. If set to None default matplotlib ticking behavior is applied.
-
param Integer
legend_cols( allow_None=True, bounds=None, constant=False, default=None, inclusive_bounds=(True, True), instantiate=False, pickle_default_value=True, precedence=None, readonly=False, softbounds=None, time_dependent=False, time_fn=<Time Time00001>, watchers={} ) - Number of legend columns in the legend.
-
param ObjectSelector
legend_position( allow_None=None, check_on_set=True, compute_default_fn=None, constant=False, default=inner, instantiate=False, names=None, objects=[‘inner’, ‘right’, ‘bottom’, ‘top’, ‘left’, ‘best’, ‘top_right’, ‘top_left’, ‘bottom_left’, ‘bottom_right’], pickle_default_value=True, precedence=None, readonly=False, watchers={} ) - Allows selecting between a number of predefined legend position options. The predefined options may be customized in the legend_specs class attribute. By default, ‘inner’, ‘right’, ‘bottom’, ‘top’, ‘left’, ‘best’, ‘top_right’, ‘top_left’, ‘bottom_right’ and ‘bottom_left’ are supported.
-
anim( start=0 , stop=None , fps=30 ) ¶ -
Method to return a matplotlib animation. The start and stop frames may be specified as well as the fps.
-
cleanup( ) ¶ -
Cleans up references to the plot on the attached Stream subscribers.
-
compute_ranges( obj , key , ranges ) ¶ -
Given an object, a specific key, and the normalization options, this method will find the specified normalization options on the appropriate OptionTree, group the elements according to the selected normalization option (i.e. either per frame or over the whole animation) and finally compute the dimension ranges in each group. The new set of ranges is returned.
-
debug( *args , **kwargs ) ¶ -
Inspect .param.debug method for the full docstring
-
defaults( *args , **kwargs ) ¶ -
Inspect .param.defaults method for the full docstring
-
force_new_dynamic_value= functools.partial(<function Parameters.deprecate.<locals>.inner>, <class 'holoviews.plotting.mpl.element.OverlayPlot'>) 
-
get_aspect( xspan , yspan ) ¶ -
Computes the aspect ratio of the plot
-
get_padding( extents ) ¶ -
Computes padding along the axes taking into account the plot aspect.
-
get_param_values= functools.partial(<function Parameters.deprecate.<locals>.inner>, <class 'holoviews.plotting.mpl.element.OverlayPlot'>) 
-
get_value_generator= functools.partial(<function Parameters.deprecate.<locals>.inner>, <class 'holoviews.plotting.mpl.element.OverlayPlot'>) 
-
get_zorder( overlay , key , el ) ¶ -
Computes the z-order of element in the NdOverlay taking into account possible batching of elements.
-
init_artists( ax , plot_args , plot_kwargs ) ¶ -
Initializes the artist based on the plot method declared on the plot.
-
init_comm( ) ¶ -
Initializes comm and attaches streams.
-
inspect_value= functools.partial(<function Parameters.deprecate.<locals>.inner>, <class 'holoviews.plotting.mpl.element.OverlayPlot'>) 
-
matches( spec ) ¶ -
Matches a specification against the current Plot.
-
message( *args , **kwargs ) ¶ -
Inspect .param.message method for the full docstring
-
params( *args , **kwargs ) ¶ -
Inspect .param.params method for the full docstring
-
pprint( imports=None , prefix=' ' , unknown_value='<?>' , qualify=False , separator='' ) ¶ -
(Experimental) Pretty printed representation that may be evaluated with eval. See pprint() function for more details.
-
print_param_defaults( *args , **kwargs ) ¶ -
Inspect .param.print_param_defaults method for the full docstring
-
print_param_values( *args , **kwargs ) ¶ -
Inspect .param.print_param_values method for the full docstring
-
push( ) ¶ -
Pushes updated plot data via the Comm.
-
refresh( **kwargs ) ¶ -
Refreshes the plot by rerendering it and then pushing the updated data if the plot has an associated Comm.
-
script_repr( imports=[] , prefix=' ' ) ¶ -
Variant of __repr__ designed for generating a runnable script.
-
set_default( *args , **kwargs ) ¶ -
Inspect .param.set_default method for the full docstring
-
set_dynamic_time_fn= functools.partial(<function Parameters.deprecate.<locals>.inner>, <class 'holoviews.plotting.mpl.element.OverlayPlot'>) 
-
set_param= functools.partial(<function Parameters.deprecate.<locals>.inner>, <class 'holoviews.plotting.mpl.element.OverlayPlot'>) 
-
state_pop( ) ¶ -
Restore the most recently saved state.
See state_push() for more details.
-
state_push( ) ¶ -
Save this instance’s state.
For Parameterized instances, this includes the state of dynamically generated values.
Subclasses that maintain short-term state should additionally save and restore that state using state_push() and state_pop().
Generally, this method is used by operations that need to test something without permanently altering the objects’ state.
-
teardown_handles( ) ¶ -
If no custom update_handles method is supplied this method is called to tear down any previous handles before replacing them.
-
traverse( fn=None , specs=None , full_breadth=True ) ¶ -
Traverses any nested DimensionedPlot returning a list of all plots that match the specs. The specs should be supplied as a list of either Plot types or callables, which should return a boolean given the plot class.
-
update_handles( key , axis , element , ranges , style ) ¶ -
Update the elements of the plot.
-
verbose( *args , **kwargs ) ¶ -
Inspect .param.verbose method for the full docstring
-
warning( *args , **kwargs ) ¶ -
Inspect .param.warning method for the full docstring
-
param Parameter
pandas
Module
path
Module

-
class
holoviews.plotting.mpl.path.PolygonPlot( *args , **kwargs ) [source] ¶ -
Bases:
holoviews.plotting.mpl.path.ContourPlotPolygonPlot draws the polygon paths in the supplied Polygons object. If the Polygon has an associated value the color of Polygons will be drawn from the supplied cmap, otherwise the supplied facecolor will apply. Facecolor also determines the color for non-finite values.
-
param Parameter
fontsize( allow_None=True, constant=False, default=None, instantiate=False, pickle_default_value=True, precedence=None, readonly=False, watchers={} ) - Specifies various font sizes of the displayed text. Finer control is available by supplying a dictionary where any unmentioned keys revert to the default sizes, e.g: {‘ticks’:20, ‘title’:15, ‘ylabel’:5, ‘xlabel’:5, ‘zlabel’:5, ‘legend’:8, ‘legend_title’:13} You can set the font size of ‘zlabel’, ‘ylabel’ and ‘xlabel’ together using the ‘labels’ key.
-
param Boolean
show_title( allow_None=False, bounds=(0, 1), constant=False, default=True, instantiate=False, pickle_default_value=True, precedence=None, readonly=False, watchers={} ) - Whether to display the plot title.
-
param String
title( allow_None=False, basestring=<class ‘str’>, constant=False, default={label} {group} {dimensions}, instantiate=False, pickle_default_value=True, precedence=None, readonly=False, regex=None, watchers={} ) - The formatting string for the title of this plot, allows defining a label group separator and dimension labels.
-
param String
title_format( allow_None=True, basestring=<class ‘str’>, constant=False, default=None, instantiate=False, pickle_default_value=True, precedence=None, readonly=False, regex=None, watchers={} ) - Alias for title.
-
param Boolean
normalize( allow_None=False, bounds=(0, 1), constant=False, default=True, instantiate=False, pickle_default_value=True, precedence=None, readonly=False, watchers={} ) - Whether to compute ranges across all Elements at this level of plotting. Allows selecting normalization at different levels for nested data containers.
-
param Parameter
projection( allow_None=True, constant=False, default=None, instantiate=False, pickle_default_value=True, precedence=None, readonly=False, watchers={} ) - The projection of the plot axis, default of None is equivalent to 2D plot, ‘3d’ and ‘polar’ are also supported by matplotlib by default. May also supply a custom projection that is either a matplotlib projection type or implements the _as_mpl_axes method.
-
param Number
fig_alpha( allow_None=False, bounds=(0, 1), constant=False, default=1.0, inclusive_bounds=(True, True), instantiate=False, pickle_default_value=True, precedence=None, readonly=False, softbounds=None, time_dependent=False, time_fn=<Time Time00001>, watchers={} ) - Alpha of the overall figure background.
-
param NumericTuple
fig_bounds( allow_None=False, constant=False, default=(0.15, 0.15, 0.85, 0.85), instantiate=False, length=4, pickle_default_value=True, precedence=None, readonly=False, watchers={} ) - The bounds of the overall figure as a 4-tuple of the form (left, bottom, right, top), defining the size of the border around the subplots.
-
param Parameter
fig_inches( allow_None=False, constant=False, default=4, instantiate=False, pickle_default_value=True, precedence=None, readonly=False, watchers={} ) - The overall matplotlib figure size in inches. May be set as an integer in which case it will be used to autocompute a size. Alternatively may be set with an explicit tuple or list, in which case it will be applied directly after being scaled by fig_size. If either the width or height is set to None, it will be computed automatically.
-
param Boolean
fig_latex( allow_None=False, bounds=(0, 1), constant=False, default=False, instantiate=False, pickle_default_value=True, precedence=None, readonly=False, watchers={} ) - Whether to use LaTeX text in the overall figure.
-
param Dict
fig_rcparams( allow_None=False, constant=False, default={}, instantiate=True, is_instance=True, pickle_default_value=True, precedence=None, readonly=False, watchers={} ) - matplotlib rc parameters to apply to the overall figure.
-
param Number
fig_size( allow_None=False, bounds=(1, None), constant=False, default=100.0, inclusive_bounds=(True, True), instantiate=False, pickle_default_value=True, precedence=None, readonly=False, softbounds=None, time_dependent=False, time_fn=<Time Time00001>, watchers={} ) - Size relative to the supplied overall fig_inches in percent.
-
param HookList
initial_hooks( allow_None=False, bounds=(0, None), constant=False, default=[], instantiate=True, pickle_default_value=True, precedence=None, readonly=False, watchers={} ) - Optional list of hooks called before plotting the data onto the axis (now marked for deprecation). The hook is passed the plot object and the displayed object; other plotting handles can be accessed via plot.handles.
-
param HookList
finalize_hooks( allow_None=False, bounds=(0, None), constant=False, default=[], instantiate=True, pickle_default_value=True, precedence=None, readonly=False, watchers={} ) - Deprecated; use hooks options instead.
-
param HookList
hooks( allow_None=False, bounds=(0, None), constant=False, default=[], instantiate=True, pickle_default_value=True, precedence=None, readonly=False, watchers={} ) - Optional list of hooks called when finalizing a plot. The hook is passed the plot object and the displayed element, and other plotting handles can be accessed via plot.handles.
-
param String
sublabel_format( allow_None=True, basestring=<class ‘str’>, constant=False, default=None, instantiate=False, pickle_default_value=True, precedence=None, readonly=False, regex=None, watchers={} ) - Allows labeling the subaxes in each plot with various formatters including {Alpha}, {alpha}, {numeric} and {roman}.
-
param NumericTuple
sublabel_position( allow_None=False, constant=False, default=(-0.35, 0.85), instantiate=False, length=2, pickle_default_value=True, precedence=None, readonly=False, watchers={} ) - Position relative to the plot for placing the optional subfigure label.
-
param Number
sublabel_size( allow_None=False, bounds=None, constant=False, default=18, inclusive_bounds=(True, True), instantiate=False, pickle_default_value=True, precedence=None, readonly=False, softbounds=None, time_dependent=False, time_fn=<Time Time00001>, watchers={} ) - Size of optional subfigure label.
-
param Boolean
show_frame( allow_None=False, bounds=(0, 1), constant=False, default=False, instantiate=False, pickle_default_value=True, precedence=None, readonly=False, watchers={} ) - Whether or not to show a complete frame around the plot.
-
param Boolean
apply_ranges( allow_None=False, bounds=(0, 1), constant=False, default=True, instantiate=False, pickle_default_value=True, precedence=None, readonly=False, watchers={} ) - Whether to compute the plot bounds from the data itself.
-
param Boolean
apply_extents( allow_None=False, bounds=(0, 1), constant=False, default=True, instantiate=False, pickle_default_value=True, precedence=None, readonly=False, watchers={} ) - Whether to apply extent overrides on the Elements
-
param ClassSelector
bgcolor( allow_None=True, constant=False, default=None, instantiate=True, is_instance=True, pickle_default_value=True, precedence=None, readonly=False, watchers={} ) - If set bgcolor overrides the background color of the axis.
-
param ClassSelector
default_span( allow_None=False, constant=False, default=2.0, instantiate=True, is_instance=True, pickle_default_value=True, precedence=None, readonly=False, watchers={} ) - Defines the span of an axis if the axis range is zero, i.e. if the lower and upper end of an axis are equal or no range is defined at all. For example if there is a single datapoint at 0 a default_span of 2.0 will result in axis ranges spanning from -1 to 1.
-
param Boolean
invert_axes( allow_None=False, bounds=(0, 1), constant=False, default=False, instantiate=False, pickle_default_value=True, precedence=None, readonly=False, watchers={} ) - Whether to invert the x- and y-axis
-
param Boolean
invert_xaxis( allow_None=False, bounds=(0, 1), constant=False, default=False, instantiate=False, pickle_default_value=True, precedence=None, readonly=False, watchers={} ) - Whether to invert the plot x-axis.
-
param Boolean
invert_yaxis( allow_None=False, bounds=(0, 1), constant=False, default=False, instantiate=False, pickle_default_value=True, precedence=None, readonly=False, watchers={} ) - Whether to invert the plot y-axis.
-
param Boolean
logx( allow_None=False, bounds=(0, 1), constant=False, default=False, instantiate=False, pickle_default_value=True, precedence=None, readonly=False, watchers={} ) - Whether the x-axis of the plot will be a log axis.
-
param Boolean
logy( allow_None=False, bounds=(0, 1), constant=False, default=False, instantiate=False, pickle_default_value=True, precedence=None, readonly=False, watchers={} ) - Whether the y-axis of the plot will be a log axis.
-
param ClassSelector
padding( allow_None=False, constant=False, default=0, instantiate=True, is_instance=True, pickle_default_value=True, precedence=None, readonly=False, watchers={} ) - Fraction by which to increase auto-ranged extents to make datapoints more visible around borders. To compute padding, the axis whose screen size is largest is chosen, and the range of that axis is increased by the specified fraction along each axis. Other axes are then padded ensuring that the amount of screen space devoted to padding is equal for all axes. If specified as a tuple, the int or float values in the tuple will be used for padding in each axis, in order (x,y or x,y,z). For example, for padding=0.2 on a 800x800-pixel plot, an x-axis with the range [0,10] will be padded by 20% to be [-1,11], while a y-axis with a range [0,1000] will be padded to be [-100,1100], which should make the padding be approximately the same number of pixels. But if the same plot is changed to have a height of only 200, the y-range will then be [-400,1400] so that the y-axis padding will still match that of the x-axis. It is also possible to declare non-equal padding value for the lower and upper bound of an axis by supplying nested tuples, e.g. padding=(0.1, (0, 0.1)) will pad the x-axis lower and upper bound as well as the y-axis upper bound by a fraction of 0.1 while the y-axis lower bound is not padded at all.
-
param Boolean
show_legend( allow_None=False, bounds=(0, 1), constant=False, default=False, instantiate=False, pickle_default_value=True, precedence=None, readonly=False, watchers={} ) - Whether to show legend for the plot.
-
param Boolean
show_grid( allow_None=False, bounds=(0, 1), constant=False, default=False, instantiate=False, pickle_default_value=True, precedence=None, readonly=False, watchers={} ) - Whether to show a Cartesian grid on the plot.
-
param ObjectSelector
xaxis( allow_None=None, check_on_set=True, compute_default_fn=None, constant=False, default=bottom, instantiate=False, names=None, objects=[‘top’, ‘bottom’, ‘bare’, ‘top-bare’, ‘bottom-bare’, None, True, False], pickle_default_value=True, precedence=None, readonly=False, watchers={} ) - Whether and where to display the xaxis. The “bare” options allow suppressing all axis labels, including ticks and xlabel. Valid options are ‘top’, ‘bottom’, ‘bare’, ‘top-bare’ and ‘bottom-bare’.
-
param ObjectSelector
yaxis( allow_None=None, check_on_set=True, compute_default_fn=None, constant=False, default=left, instantiate=False, names=None, objects=[‘left’, ‘right’, ‘bare’, ‘left-bare’, ‘right-bare’, None, True, False], pickle_default_value=True, precedence=None, readonly=False, watchers={} ) - Whether and where to display the yaxis. The “bare” options allow suppressing all axis labels, including ticks and ylabel. Valid options are ‘left’, ‘right’, ‘bare’, ‘left-bare’ and ‘right-bare’.
-
param String
xlabel( allow_None=True, basestring=<class ‘str’>, constant=False, default=None, instantiate=False, pickle_default_value=True, precedence=None, readonly=False, regex=None, watchers={} ) - An explicit override of the x-axis label, if set takes precedence over the dimension label.
-
param String
ylabel( allow_None=True, basestring=<class ‘str’>, constant=False, default=None, instantiate=False, pickle_default_value=True, precedence=None, readonly=False, regex=None, watchers={} ) - An explicit override of the y-axis label, if set takes precedence over the dimension label.
-
param NumericTuple
xlim( allow_None=False, constant=False, default=(nan, nan), instantiate=False, length=2, pickle_default_value=True, precedence=None, readonly=False, watchers={} ) - User-specified x-axis range limits for the plot, as a tuple (low,high). If specified, takes precedence over data and dimension ranges.
-
param NumericTuple
ylim( allow_None=False, constant=False, default=(nan, nan), instantiate=False, length=2, pickle_default_value=True, precedence=None, readonly=False, watchers={} ) - User-specified x-axis range limits for the plot, as a tuple (low,high). If specified, takes precedence over data and dimension ranges.
-
param NumericTuple
zlim( allow_None=False, constant=False, default=(nan, nan), instantiate=False, length=2, pickle_default_value=True, precedence=None, readonly=False, watchers={} ) - User-specified z-axis range limits for the plot, as a tuple (low,high). If specified, takes precedence over data and dimension ranges.
-
param Integer
xrotation( allow_None=True, bounds=(0, 360), constant=False, default=None, inclusive_bounds=(True, True), instantiate=False, pickle_default_value=True, precedence=None, readonly=False, softbounds=None, time_dependent=False, time_fn=<Time Time00001>, watchers={} ) - Rotation angle of the xticks.
-
param Integer
yrotation( allow_None=True, bounds=(0, 360), constant=False, default=None, inclusive_bounds=(True, True), instantiate=False, pickle_default_value=True, precedence=None, readonly=False, softbounds=None, time_dependent=False, time_fn=<Time Time00001>, watchers={} ) - Rotation angle of the yticks.
-
param Parameter
xticks( allow_None=True, constant=False, default=None, instantiate=False, pickle_default_value=True, precedence=None, readonly=False, watchers={} ) - Ticks along x-axis specified as an integer, explicit list of tick locations, or bokeh Ticker object. If set to None default bokeh ticking behavior is applied.
-
param Parameter
yticks( allow_None=True, constant=False, default=None, instantiate=False, pickle_default_value=True, precedence=None, readonly=False, watchers={} ) - Ticks along y-axis specified as an integer, explicit list of tick locations, or bokeh Ticker object. If set to None default bokeh ticking behavior is applied.
-
param Boolean
apply_ticks( allow_None=False, bounds=(0, 1), constant=False, default=True, instantiate=False, pickle_default_value=True, precedence=None, readonly=False, watchers={} ) - Whether to apply custom ticks.
-
param Parameter
aspect( allow_None=False, constant=False, default=square, instantiate=False, pickle_default_value=True, precedence=None, readonly=False, watchers={} ) - PathPlots axes usually define single space so aspect of Paths follows aspect in data coordinates by default.
-
param Boolean
invert_zaxis( allow_None=False, bounds=(0, 1), constant=False, default=False, instantiate=False, pickle_default_value=True, precedence=None, readonly=False, watchers={} ) - Whether to invert the plot z-axis.
-
param List
labelled( allow_None=False, bounds=(0, None), constant=False, default=[‘x’, ‘y’], instantiate=True, pickle_default_value=True, precedence=None, readonly=False, watchers={} ) - Whether to plot the ‘x’ and ‘y’ labels.
-
param Boolean
logz( allow_None=False, bounds=(0, 1), constant=False, default=False, instantiate=False, pickle_default_value=True, precedence=None, readonly=False, watchers={} ) - Whether to apply log scaling to the y-axis of the Chart.
-
param ClassSelector
xformatter( allow_None=True, constant=False, default=None, instantiate=True, is_instance=True, pickle_default_value=True, precedence=None, readonly=False, watchers={} ) - Formatter for ticks along the x-axis.
-
param ClassSelector
yformatter( allow_None=True, constant=False, default=None, instantiate=True, is_instance=True, pickle_default_value=True, precedence=None, readonly=False, watchers={} ) - Formatter for ticks along the y-axis.
-
param ClassSelector
zformatter( allow_None=True, constant=False, default=None, instantiate=True, is_instance=True, pickle_default_value=True, precedence=None, readonly=False, watchers={} ) - Formatter for ticks along the z-axis.
-
param Boolean
zaxis( allow_None=False, bounds=(0, 1), constant=False, default=True, instantiate=False, pickle_default_value=True, precedence=None, readonly=False, watchers={} ) - Whether to display the z-axis.
-
param String
zlabel( allow_None=True, basestring=<class ‘str’>, constant=False, default=None, instantiate=False, pickle_default_value=True, precedence=None, readonly=False, regex=None, watchers={} ) - An explicit override of the z-axis label, if set takes precedence over the dimension label.
-
param Integer
zrotation( allow_None=False, bounds=(0, 360), constant=False, default=0, inclusive_bounds=(True, True), instantiate=False, pickle_default_value=True, precedence=None, readonly=False, softbounds=None, time_dependent=False, time_fn=<Time Time00001>, watchers={} ) - Rotation angle of the zticks.
-
param Parameter
zticks( allow_None=True, constant=False, default=None, instantiate=False, pickle_default_value=True, precedence=None, readonly=False, watchers={} ) - Ticks along z-axis specified as an integer, explicit list of tick locations, list of tuples containing the locations and labels or a matplotlib tick locator object. If set to None default matplotlib ticking behavior is applied.
-
param Boolean
colorbar( allow_None=False, bounds=(0, 1), constant=False, default=False, instantiate=False, pickle_default_value=True, precedence=None, readonly=False, watchers={} ) - Whether to draw a colorbar.
-
param ClassSelector
color_levels( allow_None=True, constant=False, default=None, instantiate=True, is_instance=True, pickle_default_value=True, precedence=None, readonly=False, watchers={} ) - Number of discrete colors to use when colormapping or a set of color intervals defining the range of values to map each color to.
-
param Dict
clipping_colors( allow_None=False, constant=False, default={}, instantiate=True, is_instance=True, pickle_default_value=True, precedence=None, readonly=False, watchers={} ) - Dictionary to specify colors for clipped values, allows setting color for NaN values and for values above and below the min and max value. The min, max or NaN color may specify an RGB(A) color as a color hex string of the form #FFFFFF or #FFFFFFFF or a length 3 or length 4 tuple specifying values in the range 0-1 or a named HTML color.
-
param Number
cbar_padding( allow_None=False, bounds=None, constant=False, default=0.01, inclusive_bounds=(True, True), instantiate=False, pickle_default_value=True, precedence=None, readonly=False, softbounds=None, time_dependent=False, time_fn=<Time Time00001>, watchers={} ) - Padding between colorbar and other plots.
-
param Parameter
cbar_ticks( allow_None=True, constant=False, default=None, instantiate=False, pickle_default_value=True, precedence=None, readonly=False, watchers={} ) - Ticks along colorbar-axis specified as an integer, explicit list of tick locations, list of tuples containing the locations and labels or a matplotlib tick locator object. If set to None default matplotlib ticking behavior is applied.
-
param Number
cbar_width( allow_None=False, bounds=None, constant=False, default=0.05, inclusive_bounds=(True, True), instantiate=False, pickle_default_value=True, precedence=None, readonly=False, softbounds=None, time_dependent=False, time_fn=<Time Time00001>, watchers={} ) - Width of the colorbar as a fraction of the main plot
-
param Boolean
symmetric( allow_None=False, bounds=(0, 1), constant=False, default=False, instantiate=False, pickle_default_value=True, precedence=None, readonly=False, watchers={} ) - Whether to make the colormap symmetric around zero.
-
param ClassSelector
color_index( allow_None=True, constant=False, default=0, instantiate=True, is_instance=True, pickle_default_value=True, precedence=None, readonly=False, watchers={} ) - Index of the dimension from which the color will the drawn
-
anim( start=0 , stop=None , fps=30 ) ¶ -
Method to return a matplotlib animation. The start and stop frames may be specified as well as the fps.
-
cleanup( ) ¶ -
Cleans up references to the plot on the attached Stream subscribers.
-
compute_ranges( obj , key , ranges ) ¶ -
Given an object, a specific key, and the normalization options, this method will find the specified normalization options on the appropriate OptionTree, group the elements according to the selected normalization option (i.e. either per frame or over the whole animation) and finally compute the dimension ranges in each group. The new set of ranges is returned.
-
debug( *args , **kwargs ) ¶ -
Inspect .param.debug method for the full docstring
-
defaults( *args , **kwargs ) ¶ -
Inspect .param.defaults method for the full docstring
-
force_new_dynamic_value= functools.partial(<function Parameters.deprecate.<locals>.inner>, <class 'holoviews.plotting.mpl.path.PolygonPlot'>) 
-
get_aspect( xspan , yspan ) ¶ -
Computes the aspect ratio of the plot
-
get_extents( element , ranges , range_type='combined' , xdim=None , ydim=None , zdim=None ) ¶ -
Gets the extents for the axes from the current Element. The globally computed ranges can optionally override the extents.
The extents are computed by combining the data ranges, extents and dimension ranges. Each of these can be obtained individually by setting the range_type to one of:
- ‘data’: Just the data ranges
- ‘extents’: Element.extents
- ‘soft’: Dimension.soft_range values
- ‘hard’: Dimension.range values
To obtain the combined range, which includes range padding the default may be used:
- ‘combined’: All the range types combined and padding applied
This allows Overlay plots to obtain each range and combine them appropriately for all the objects in the overlay.
-
get_padding( extents ) ¶ -
Computes padding along the axes taking into account the plot aspect.
-
get_param_values= functools.partial(<function Parameters.deprecate.<locals>.inner>, <class 'holoviews.plotting.mpl.path.PolygonPlot'>) 
-
get_value_generator= functools.partial(<function Parameters.deprecate.<locals>.inner>, <class 'holoviews.plotting.mpl.path.PolygonPlot'>) 
-
get_zorder( overlay , key , el ) ¶ -
Computes the z-order of element in the NdOverlay taking into account possible batching of elements.
-
init_comm( ) ¶ -
Initializes comm and attaches streams.
-
inspect_value= functools.partial(<function Parameters.deprecate.<locals>.inner>, <class 'holoviews.plotting.mpl.path.PolygonPlot'>) 
-
matches( spec ) ¶ -
Matches a specification against the current Plot.
-
message( *args , **kwargs ) ¶ -
Inspect .param.message method for the full docstring
-
params( *args , **kwargs ) ¶ -
Inspect .param.params method for the full docstring
-
pprint( imports=None , prefix=' ' , unknown_value='<?>' , qualify=False , separator='' ) ¶ -
(Experimental) Pretty printed representation that may be evaluated with eval. See pprint() function for more details.
-
print_param_defaults( *args , **kwargs ) ¶ -
Inspect .param.print_param_defaults method for the full docstring
-
print_param_values( *args , **kwargs ) ¶ -
Inspect .param.print_param_values method for the full docstring
-
push( ) ¶ -
Pushes updated plot data via the Comm.
-
refresh( **kwargs ) ¶ -
Refreshes the plot by rerendering it and then pushing the updated data if the plot has an associated Comm.
-
script_repr( imports=[] , prefix=' ' ) ¶ -
Variant of __repr__ designed for generating a runnable script.
-
set_default( *args , **kwargs ) ¶ -
Inspect .param.set_default method for the full docstring
-
set_dynamic_time_fn= functools.partial(<function Parameters.deprecate.<locals>.inner>, <class 'holoviews.plotting.mpl.path.PolygonPlot'>) 
-
set_param= functools.partial(<function Parameters.deprecate.<locals>.inner>, <class 'holoviews.plotting.mpl.path.PolygonPlot'>) 
-
state_pop( ) ¶ -
Restore the most recently saved state.
See state_push() for more details.
-
state_push( ) ¶ -
Save this instance’s state.
For Parameterized instances, this includes the state of dynamically generated values.
Subclasses that maintain short-term state should additionally save and restore that state using state_push() and state_pop().
Generally, this method is used by operations that need to test something without permanently altering the objects’ state.
-
teardown_handles( ) ¶ -
If no custom update_handles method is supplied this method is called to tear down any previous handles before replacing them.
-
traverse( fn=None , specs=None , full_breadth=True ) ¶ -
Traverses any nested DimensionedPlot returning a list of all plots that match the specs. The specs should be supplied as a list of either Plot types or callables, which should return a boolean given the plot class.
-
verbose( *args , **kwargs ) ¶ -
Inspect .param.verbose method for the full docstring
-
warning( *args , **kwargs ) ¶ -
Inspect .param.warning method for the full docstring
-
param Parameter
plot
Module

-
class
holoviews.plotting.mpl.plot.AdjointLayoutPlot( layout , layout_type , subaxes , subplots , **params ) [source] ¶ -
Bases:
holoviews.plotting.mpl.plot.MPLPlotLayoutPlot allows placing up to three Views in a number of predefined and fixed layouts, which are defined by the layout_dict class attribute. This allows placing subviews next to a main plot in either a ‘top’ or ‘right’ position.
Initially, a LayoutPlot computes an appropriate layout based for the number of Views in the AdjointLayout object it has been given, but when embedded in a NdLayout, it can recompute the layout to match the number of rows and columns as part of a larger grid.
-
param Parameter
fontsize( allow_None=True, constant=False, default=None, instantiate=False, pickle_default_value=True, precedence=None, readonly=False, watchers={} ) - Specifies various font sizes of the displayed text. Finer control is available by supplying a dictionary where any unmentioned keys revert to the default sizes, e.g: {‘ticks’:20, ‘title’:15, ‘ylabel’:5, ‘xlabel’:5, ‘zlabel’:5, ‘legend’:8, ‘legend_title’:13} You can set the font size of ‘zlabel’, ‘ylabel’ and ‘xlabel’ together using the ‘labels’ key.
-
param Boolean
show_title( allow_None=False, bounds=(0, 1), constant=False, default=True, instantiate=False, pickle_default_value=True, precedence=None, readonly=False, watchers={} ) - Whether to display the plot title.
-
param String
title( allow_None=False, basestring=<class ‘str’>, constant=False, default={label} {group} {dimensions}, instantiate=False, pickle_default_value=True, precedence=None, readonly=False, regex=None, watchers={} ) - The formatting string for the title of this plot, allows defining a label group separator and dimension labels.
-
param String
title_format( allow_None=True, basestring=<class ‘str’>, constant=False, default=None, instantiate=False, pickle_default_value=True, precedence=None, readonly=False, regex=None, watchers={} ) - Alias for title.
-
param Boolean
normalize( allow_None=False, bounds=(0, 1), constant=False, default=True, instantiate=False, pickle_default_value=True, precedence=None, readonly=False, watchers={} ) - Whether to compute ranges across all Elements at this level of plotting. Allows selecting normalization at different levels for nested data containers.
-
param Parameter
projection( allow_None=True, constant=False, default=None, instantiate=False, pickle_default_value=True, precedence=None, readonly=False, watchers={} ) - The projection of the plot axis, default of None is equivalent to 2D plot, ‘3d’ and ‘polar’ are also supported by matplotlib by default. May also supply a custom projection that is either a matplotlib projection type or implements the _as_mpl_axes method.
-
param Number
fig_alpha( allow_None=False, bounds=(0, 1), constant=False, default=1.0, inclusive_bounds=(True, True), instantiate=False, pickle_default_value=True, precedence=None, readonly=False, softbounds=None, time_dependent=False, time_fn=<Time Time00001>, watchers={} ) - Alpha of the overall figure background.
-
param NumericTuple
fig_bounds( allow_None=False, constant=False, default=(0.15, 0.15, 0.85, 0.85), instantiate=False, length=4, pickle_default_value=True, precedence=None, readonly=False, watchers={} ) - The bounds of the overall figure as a 4-tuple of the form (left, bottom, right, top), defining the size of the border around the subplots.
-
param Parameter
fig_inches( allow_None=False, constant=False, default=4, instantiate=False, pickle_default_value=True, precedence=None, readonly=False, watchers={} ) - The overall matplotlib figure size in inches. May be set as an integer in which case it will be used to autocompute a size. Alternatively may be set with an explicit tuple or list, in which case it will be applied directly after being scaled by fig_size. If either the width or height is set to None, it will be computed automatically.
-
param Boolean
fig_latex( allow_None=False, bounds=(0, 1), constant=False, default=False, instantiate=False, pickle_default_value=True, precedence=None, readonly=False, watchers={} ) - Whether to use LaTeX text in the overall figure.
-
param Dict
fig_rcparams( allow_None=False, constant=False, default={}, instantiate=True, is_instance=True, pickle_default_value=True, precedence=None, readonly=False, watchers={} ) - matplotlib rc parameters to apply to the overall figure.
-
param Number
fig_size( allow_None=False, bounds=(1, None), constant=False, default=100.0, inclusive_bounds=(True, True), instantiate=False, pickle_default_value=True, precedence=None, readonly=False, softbounds=None, time_dependent=False, time_fn=<Time Time00001>, watchers={} ) - Size relative to the supplied overall fig_inches in percent.
-
param HookList
initial_hooks( allow_None=False, bounds=(0, None), constant=False, default=[], instantiate=True, pickle_default_value=True, precedence=None, readonly=False, watchers={} ) - Optional list of hooks called before plotting the data onto the axis (now marked for deprecation). The hook is passed the plot object and the displayed object; other plotting handles can be accessed via plot.handles.
-
param HookList
finalize_hooks( allow_None=False, bounds=(0, None), constant=False, default=[], instantiate=True, pickle_default_value=True, precedence=None, readonly=False, watchers={} ) - Deprecated; use hooks options instead.
-
param HookList
hooks( allow_None=False, bounds=(0, None), constant=False, default=[], instantiate=True, pickle_default_value=True, precedence=None, readonly=False, watchers={} ) - Optional list of hooks called when finalizing a plot. The hook is passed the plot object and the displayed element, and other plotting handles can be accessed via plot.handles.
-
param String
sublabel_format( allow_None=True, basestring=<class ‘str’>, constant=False, default=None, instantiate=False, pickle_default_value=True, precedence=None, readonly=False, regex=None, watchers={} ) - Allows labeling the subaxes in each plot with various formatters including {Alpha}, {alpha}, {numeric} and {roman}.
-
param NumericTuple
sublabel_position( allow_None=False, constant=False, default=(-0.35, 0.85), instantiate=False, length=2, pickle_default_value=True, precedence=None, readonly=False, watchers={} ) - Position relative to the plot for placing the optional subfigure label.
-
param Number
sublabel_size( allow_None=False, bounds=None, constant=False, default=18, inclusive_bounds=(True, True), instantiate=False, pickle_default_value=True, precedence=None, readonly=False, softbounds=None, time_dependent=False, time_fn=<Time Time00001>, watchers={} ) - Size of optional subfigure label.
-
param Boolean
show_frame( allow_None=False, bounds=(0, 1), constant=False, default=False, instantiate=False, pickle_default_value=True, precedence=None, readonly=False, watchers={} ) - Whether or not to show a complete frame around the plot.
-
adjust_positions( redraw=True ) [source] ¶ -
Make adjustments to the positions of subplots (if available) relative to the main plot axes as required.
This method is called by LayoutPlot after an initial pass used to position all the Layouts together. This method allows LayoutPlots to make final adjustments to the axis positions.
-
anim( start=0 , stop=None , fps=30 ) ¶ -
Method to return a matplotlib animation. The start and stop frames may be specified as well as the fps.
-
cleanup( ) ¶ -
Cleans up references to the plot on the attached Stream subscribers.
-
compute_ranges( obj , key , ranges ) ¶ -
Given an object, a specific key, and the normalization options, this method will find the specified normalization options on the appropriate OptionTree, group the elements according to the selected normalization option (i.e. either per frame or over the whole animation) and finally compute the dimension ranges in each group. The new set of ranges is returned.
-
debug( *args , **kwargs ) ¶ -
Inspect .param.debug method for the full docstring
-
defaults( *args , **kwargs ) ¶ -
Inspect .param.defaults method for the full docstring
-
force_new_dynamic_value= functools.partial(<function Parameters.deprecate.<locals>.inner>, <class 'holoviews.plotting.mpl.plot.AdjointLayoutPlot'>) 
-
get_param_values= functools.partial(<function Parameters.deprecate.<locals>.inner>, <class 'holoviews.plotting.mpl.plot.AdjointLayoutPlot'>) 
-
get_value_generator= functools.partial(<function Parameters.deprecate.<locals>.inner>, <class 'holoviews.plotting.mpl.plot.AdjointLayoutPlot'>) 
-
init_comm( ) ¶ -
Initializes comm and attaches streams.
-
inspect_value= functools.partial(<function Parameters.deprecate.<locals>.inner>, <class 'holoviews.plotting.mpl.plot.AdjointLayoutPlot'>) 
-
matches( spec ) ¶ -
Matches a specification against the current Plot.
-
message( *args , **kwargs ) ¶ -
Inspect .param.message method for the full docstring
-
params( *args , **kwargs ) ¶ -
Inspect .param.params method for the full docstring
-
pprint( imports=None , prefix=' ' , unknown_value='<?>' , qualify=False , separator='' ) ¶ -
(Experimental) Pretty printed representation that may be evaluated with eval. See pprint() function for more details.
-
print_param_defaults( *args , **kwargs ) ¶ -
Inspect .param.print_param_defaults method for the full docstring
-
print_param_values( *args , **kwargs ) ¶ -
Inspect .param.print_param_values method for the full docstring
-
push( ) ¶ -
Pushes updated plot data via the Comm.
-
refresh( **kwargs ) ¶ -
Refreshes the plot by rerendering it and then pushing the updated data if the plot has an associated Comm.
-
script_repr( imports=[] , prefix=' ' ) ¶ -
Variant of __repr__ designed for generating a runnable script.
-
set_default( *args , **kwargs ) ¶ -
Inspect .param.set_default method for the full docstring
-
set_dynamic_time_fn= functools.partial(<function Parameters.deprecate.<locals>.inner>, <class 'holoviews.plotting.mpl.plot.AdjointLayoutPlot'>) 
-
set_param= functools.partial(<function Parameters.deprecate.<locals>.inner>, <class 'holoviews.plotting.mpl.plot.AdjointLayoutPlot'>) 
-
state_pop( ) ¶ -
Restore the most recently saved state.
See state_push() for more details.
-
state_push( ) ¶ -
Save this instance’s state.
For Parameterized instances, this includes the state of dynamically generated values.
Subclasses that maintain short-term state should additionally save and restore that state using state_push() and state_pop().
Generally, this method is used by operations that need to test something without permanently altering the objects’ state.
-
traverse( fn=None , specs=None , full_breadth=True ) ¶ -
Traverses any nested DimensionedPlot returning a list of all plots that match the specs. The specs should be supplied as a list of either Plot types or callables, which should return a boolean given the plot class.
-
verbose( *args , **kwargs ) ¶ -
Inspect .param.verbose method for the full docstring
-
warning( *args , **kwargs ) ¶ -
Inspect .param.warning method for the full docstring
-
param Parameter
-
class
holoviews.plotting.mpl.plot.CompositePlot( layout , keys=None , dimensions=None , **params ) [source] ¶ -
Bases:
holoviews.plotting.plot.GenericCompositePlot,holoviews.plotting.mpl.plot.MPLPlotCompositePlot provides a baseclass for plots coordinate multiple subplots to form a Layout.
-
param Parameter
fontsize( allow_None=True, constant=False, default=None, instantiate=False, pickle_default_value=True, precedence=None, readonly=False, watchers={} ) - Specifies various font sizes of the displayed text. Finer control is available by supplying a dictionary where any unmentioned keys revert to the default sizes, e.g: {‘ticks’:20, ‘title’:15, ‘ylabel’:5, ‘xlabel’:5, ‘zlabel’:5, ‘legend’:8, ‘legend_title’:13} You can set the font size of ‘zlabel’, ‘ylabel’ and ‘xlabel’ together using the ‘labels’ key.
-
param Boolean
show_title( allow_None=False, bounds=(0, 1), constant=False, default=True, instantiate=False, pickle_default_value=True, precedence=None, readonly=False, watchers={} ) - Whether to display the plot title.
-
param String
title( allow_None=False, basestring=<class ‘str’>, constant=False, default={label} {group} {dimensions}, instantiate=False, pickle_default_value=True, precedence=None, readonly=False, regex=None, watchers={} ) - The formatting string for the title of this plot, allows defining a label group separator and dimension labels.
-
param String
title_format( allow_None=True, basestring=<class ‘str’>, constant=False, default=None, instantiate=False, pickle_default_value=True, precedence=None, readonly=False, regex=None, watchers={} ) - Alias for title.
-
param Boolean
normalize( allow_None=False, bounds=(0, 1), constant=False, default=True, instantiate=False, pickle_default_value=True, precedence=None, readonly=False, watchers={} ) - Whether to compute ranges across all Elements at this level of plotting. Allows selecting normalization at different levels for nested data containers.
-
param Parameter
projection( allow_None=True, constant=False, default=None, instantiate=False, pickle_default_value=True, precedence=None, readonly=False, watchers={} ) - The projection of the plot axis, default of None is equivalent to 2D plot, ‘3d’ and ‘polar’ are also supported by matplotlib by default. May also supply a custom projection that is either a matplotlib projection type or implements the _as_mpl_axes method.
-
param Number
fig_alpha( allow_None=False, bounds=(0, 1), constant=False, default=1.0, inclusive_bounds=(True, True), instantiate=False, pickle_default_value=True, precedence=None, readonly=False, softbounds=None, time_dependent=False, time_fn=<Time Time00001>, watchers={} ) - Alpha of the overall figure background.
-
param NumericTuple
fig_bounds( allow_None=False, constant=False, default=(0.15, 0.15, 0.85, 0.85), instantiate=False, length=4, pickle_default_value=True, precedence=None, readonly=False, watchers={} ) - The bounds of the overall figure as a 4-tuple of the form (left, bottom, right, top), defining the size of the border around the subplots.
-
param Parameter
fig_inches( allow_None=False, constant=False, default=4, instantiate=False, pickle_default_value=True, precedence=None, readonly=False, watchers={} ) - The overall matplotlib figure size in inches. May be set as an integer in which case it will be used to autocompute a size. Alternatively may be set with an explicit tuple or list, in which case it will be applied directly after being scaled by fig_size. If either the width or height is set to None, it will be computed automatically.
-
param Boolean
fig_latex( allow_None=False, bounds=(0, 1), constant=False, default=False, instantiate=False, pickle_default_value=True, precedence=None, readonly=False, watchers={} ) - Whether to use LaTeX text in the overall figure.
-
param Dict
fig_rcparams( allow_None=False, constant=False, default={}, instantiate=True, is_instance=True, pickle_default_value=True, precedence=None, readonly=False, watchers={} ) - matplotlib rc parameters to apply to the overall figure.
-
param Number
fig_size( allow_None=False, bounds=(1, None), constant=False, default=100.0, inclusive_bounds=(True, True), instantiate=False, pickle_default_value=True, precedence=None, readonly=False, softbounds=None, time_dependent=False, time_fn=<Time Time00001>, watchers={} ) - Size relative to the supplied overall fig_inches in percent.
-
param HookList
initial_hooks( allow_None=False, bounds=(0, None), constant=False, default=[], instantiate=True, pickle_default_value=True, precedence=None, readonly=False, watchers={} ) - Optional list of hooks called before plotting the data onto the axis (now marked for deprecation). The hook is passed the plot object and the displayed object; other plotting handles can be accessed via plot.handles.
-
param HookList
finalize_hooks( allow_None=False, bounds=(0, None), constant=False, default=[], instantiate=True, pickle_default_value=True, precedence=None, readonly=False, watchers={} ) - Deprecated; use hooks options instead.
-
param HookList
hooks( allow_None=False, bounds=(0, None), constant=False, default=[], instantiate=True, pickle_default_value=True, precedence=None, readonly=False, watchers={} ) - Optional list of hooks called when finalizing a plot. The hook is passed the plot object and the displayed element, and other plotting handles can be accessed via plot.handles.
-
param String
sublabel_format( allow_None=True, basestring=<class ‘str’>, constant=False, default=None, instantiate=False, pickle_default_value=True, precedence=None, readonly=False, regex=None, watchers={} ) - Allows labeling the subaxes in each plot with various formatters including {Alpha}, {alpha}, {numeric} and {roman}.
-
param NumericTuple
sublabel_position( allow_None=False, constant=False, default=(-0.35, 0.85), instantiate=False, length=2, pickle_default_value=True, precedence=None, readonly=False, watchers={} ) - Position relative to the plot for placing the optional subfigure label.
-
param Number
sublabel_size( allow_None=False, bounds=None, constant=False, default=18, inclusive_bounds=(True, True), instantiate=False, pickle_default_value=True, precedence=None, readonly=False, softbounds=None, time_dependent=False, time_fn=<Time Time00001>, watchers={} ) - Size of optional subfigure label.
-
param Boolean
show_frame( allow_None=False, bounds=(0, 1), constant=False, default=False, instantiate=False, pickle_default_value=True, precedence=None, readonly=False, watchers={} ) - Whether or not to show a complete frame around the plot.
-
anim( start=0 , stop=None , fps=30 ) ¶ -
Method to return a matplotlib animation. The start and stop frames may be specified as well as the fps.
-
cleanup( ) ¶ -
Cleans up references to the plot on the attached Stream subscribers.
-
compute_ranges( obj , key , ranges ) ¶ -
Given an object, a specific key, and the normalization options, this method will find the specified normalization options on the appropriate OptionTree, group the elements according to the selected normalization option (i.e. either per frame or over the whole animation) and finally compute the dimension ranges in each group. The new set of ranges is returned.
-
debug( *args , **kwargs ) ¶ -
Inspect .param.debug method for the full docstring
-
defaults( *args , **kwargs ) ¶ -
Inspect .param.defaults method for the full docstring
-
force_new_dynamic_value= functools.partial(<function Parameters.deprecate.<locals>.inner>, <class 'holoviews.plotting.mpl.plot.CompositePlot'>) 
-
get_param_values= functools.partial(<function Parameters.deprecate.<locals>.inner>, <class 'holoviews.plotting.mpl.plot.CompositePlot'>) 
-
get_value_generator= functools.partial(<function Parameters.deprecate.<locals>.inner>, <class 'holoviews.plotting.mpl.plot.CompositePlot'>) 
-
init_comm( ) ¶ -
Initializes comm and attaches streams.
-
initialize_plot( ranges=None ) ¶ -
Initialize the matplotlib figure.
-
inspect_value= functools.partial(<function Parameters.deprecate.<locals>.inner>, <class 'holoviews.plotting.mpl.plot.CompositePlot'>) 
-
matches( spec ) ¶ -
Matches a specification against the current Plot.
-
message( *args , **kwargs ) ¶ -
Inspect .param.message method for the full docstring
-
params( *args , **kwargs ) ¶ -
Inspect .param.params method for the full docstring
-
pprint( imports=None , prefix=' ' , unknown_value='<?>' , qualify=False , separator='' ) ¶ -
(Experimental) Pretty printed representation that may be evaluated with eval. See pprint() function for more details.
-
print_param_defaults( *args , **kwargs ) ¶ -
Inspect .param.print_param_defaults method for the full docstring
-
print_param_values( *args , **kwargs ) ¶ -
Inspect .param.print_param_values method for the full docstring
-
push( ) ¶ -
Pushes updated plot data via the Comm.
-
refresh( **kwargs ) ¶ -
Refreshes the plot by rerendering it and then pushing the updated data if the plot has an associated Comm.
-
script_repr( imports=[] , prefix=' ' ) ¶ -
Variant of __repr__ designed for generating a runnable script.
-
set_default( *args , **kwargs ) ¶ -
Inspect .param.set_default method for the full docstring
-
set_dynamic_time_fn= functools.partial(<function Parameters.deprecate.<locals>.inner>, <class 'holoviews.plotting.mpl.plot.CompositePlot'>) 
-
set_param= functools.partial(<function Parameters.deprecate.<locals>.inner>, <class 'holoviews.plotting.mpl.plot.CompositePlot'>) 
-
state_pop( ) ¶ -
Restore the most recently saved state.
See state_push() for more details.
-
state_push( ) ¶ -
Save this instance’s state.
For Parameterized instances, this includes the state of dynamically generated values.
Subclasses that maintain short-term state should additionally save and restore that state using state_push() and state_pop().
Generally, this method is used by operations that need to test something without permanently altering the objects’ state.
-
traverse( fn=None , specs=None , full_breadth=True ) ¶ -
Traverses any nested DimensionedPlot returning a list of all plots that match the specs. The specs should be supplied as a list of either Plot types or callables, which should return a boolean given the plot class.
-
verbose( *args , **kwargs ) ¶ -
Inspect .param.verbose method for the full docstring
-
warning( *args , **kwargs ) ¶ -
Inspect .param.warning method for the full docstring
-
param Parameter
-
class
holoviews.plotting.mpl.plot.GridPlot( layout , axis=None , create_axes=True , ranges=None , layout_num=1 , keys=None , **params ) [source] ¶ -
Bases:
holoviews.plotting.mpl.plot.CompositePlotPlot a group of elements in a grid layout based on a GridSpace element object.
-
param Parameter
fontsize( allow_None=True, constant=False, default=None, instantiate=False, pickle_default_value=True, precedence=None, readonly=False, watchers={} ) - Specifies various font sizes of the displayed text. Finer control is available by supplying a dictionary where any unmentioned keys revert to the default sizes, e.g: {‘ticks’:20, ‘title’:15, ‘ylabel’:5, ‘xlabel’:5, ‘zlabel’:5, ‘legend’:8, ‘legend_title’:13} You can set the font size of ‘zlabel’, ‘ylabel’ and ‘xlabel’ together using the ‘labels’ key.
-
param Boolean
show_title( allow_None=False, bounds=(0, 1), constant=False, default=True, instantiate=False, pickle_default_value=True, precedence=None, readonly=False, watchers={} ) - Whether to display the plot title.
-
param String
title( allow_None=False, basestring=<class ‘str’>, constant=False, default={label} {group} {dimensions}, instantiate=False, pickle_default_value=True, precedence=None, readonly=False, regex=None, watchers={} ) - The formatting string for the title of this plot, allows defining a label group separator and dimension labels.
-
param String
title_format( allow_None=True, basestring=<class ‘str’>, constant=False, default=None, instantiate=False, pickle_default_value=True, precedence=None, readonly=False, regex=None, watchers={} ) - Alias for title.
-
param Boolean
normalize( allow_None=False, bounds=(0, 1), constant=False, default=True, instantiate=False, pickle_default_value=True, precedence=None, readonly=False, watchers={} ) - Whether to compute ranges across all Elements at this level of plotting. Allows selecting normalization at different levels for nested data containers.
-
param Parameter
projection( allow_None=True, constant=False, default=None, instantiate=False, pickle_default_value=True, precedence=None, readonly=False, watchers={} ) - The projection of the plot axis, default of None is equivalent to 2D plot, ‘3d’ and ‘polar’ are also supported by matplotlib by default. May also supply a custom projection that is either a matplotlib projection type or implements the _as_mpl_axes method.
-
param Number
fig_alpha( allow_None=False, bounds=(0, 1), constant=False, default=1.0, inclusive_bounds=(True, True), instantiate=False, pickle_default_value=True, precedence=None, readonly=False, softbounds=None, time_dependent=False, time_fn=<Time Time00001>, watchers={} ) - Alpha of the overall figure background.
-
param NumericTuple
fig_bounds( allow_None=False, constant=False, default=(0.15, 0.15, 0.85, 0.85), instantiate=False, length=4, pickle_default_value=True, precedence=None, readonly=False, watchers={} ) - The bounds of the overall figure as a 4-tuple of the form (left, bottom, right, top), defining the size of the border around the subplots.
-
param Parameter
fig_inches( allow_None=False, constant=False, default=4, instantiate=False, pickle_default_value=True, precedence=None, readonly=False, watchers={} ) - The overall matplotlib figure size in inches. May be set as an integer in which case it will be used to autocompute a size. Alternatively may be set with an explicit tuple or list, in which case it will be applied directly after being scaled by fig_size. If either the width or height is set to None, it will be computed automatically.
-
param Boolean
fig_latex( allow_None=False, bounds=(0, 1), constant=False, default=False, instantiate=False, pickle_default_value=True, precedence=None, readonly=False, watchers={} ) - Whether to use LaTeX text in the overall figure.
-
param Dict
fig_rcparams( allow_None=False, constant=False, default={}, instantiate=True, is_instance=True, pickle_default_value=True, precedence=None, readonly=False, watchers={} ) - matplotlib rc parameters to apply to the overall figure.
-
param Number
fig_size( allow_None=False, bounds=(1, None), constant=False, default=100.0, inclusive_bounds=(True, True), instantiate=False, pickle_default_value=True, precedence=None, readonly=False, softbounds=None, time_dependent=False, time_fn=<Time Time00001>, watchers={} ) - Size relative to the supplied overall fig_inches in percent.
-
param HookList
initial_hooks( allow_None=False, bounds=(0, None), constant=False, default=[], instantiate=True, pickle_default_value=True, precedence=None, readonly=False, watchers={} ) - Optional list of hooks called before plotting the data onto the axis (now marked for deprecation). The hook is passed the plot object and the displayed object; other plotting handles can be accessed via plot.handles.
-
param HookList
finalize_hooks( allow_None=False, bounds=(0, None), constant=False, default=[], instantiate=True, pickle_default_value=True, precedence=None, readonly=False, watchers={} ) - Deprecated; use hooks options instead.
-
param HookList
hooks( allow_None=False, bounds=(0, None), constant=False, default=[], instantiate=True, pickle_default_value=True, precedence=None, readonly=False, watchers={} ) - Optional list of hooks called when finalizing a plot. The hook is passed the plot object and the displayed element, and other plotting handles can be accessed via plot.handles.
-
param String
sublabel_format( allow_None=True, basestring=<class ‘str’>, constant=False, default=None, instantiate=False, pickle_default_value=True, precedence=None, readonly=False, regex=None, watchers={} ) - Allows labeling the subaxes in each plot with various formatters including {Alpha}, {alpha}, {numeric} and {roman}.
-
param NumericTuple
sublabel_position( allow_None=False, constant=False, default=(-0.35, 0.85), instantiate=False, length=2, pickle_default_value=True, precedence=None, readonly=False, watchers={} ) - Position relative to the plot for placing the optional subfigure label.
-
param Number
sublabel_size( allow_None=False, bounds=None, constant=False, default=18, inclusive_bounds=(True, True), instantiate=False, pickle_default_value=True, precedence=None, readonly=False, softbounds=None, time_dependent=False, time_fn=<Time Time00001>, watchers={} ) - Size of optional subfigure label.
-
param Boolean
show_frame( allow_None=False, bounds=(0, 1), constant=False, default=False, instantiate=False, pickle_default_value=True, precedence=None, readonly=False, watchers={} ) - Whether or not to show a complete frame around the plot.
-
param Parameter
aspect( allow_None=False, constant=False, default=equal, instantiate=False, pickle_default_value=True, precedence=None, readonly=False, watchers={} ) - Aspect ratios on GridPlot should be automatically determined.
-
param Number
padding( allow_None=False, bounds=None, constant=False, default=0.1, inclusive_bounds=(True, True), instantiate=False, pickle_default_value=True, precedence=None, readonly=False, softbounds=None, time_dependent=False, time_fn=<Time Time00001>, watchers={} ) - The amount of padding as a fraction of the total Grid size
-
param Boolean
shared_xaxis( allow_None=False, bounds=(0, 1), constant=False, default=False, instantiate=False, pickle_default_value=True, precedence=None, readonly=False, watchers={} ) - If enabled the x-axes of the GridSpace will be drawn from the objects inside the Grid rather than the GridSpace dimensions.
-
param Boolean
shared_yaxis( allow_None=False, bounds=(0, 1), constant=False, default=False, instantiate=False, pickle_default_value=True, precedence=None, readonly=False, watchers={} ) - If enabled the x-axes of the GridSpace will be drawn from the objects inside the Grid rather than the GridSpace dimensions.
-
param Boolean
show_legend( allow_None=False, bounds=(0, 1), constant=False, default=False, instantiate=False, pickle_default_value=True, precedence=None, readonly=False, watchers={} ) - Legends add to much clutter in a grid and are disabled by default.
-
param ObjectSelector
xaxis( allow_None=None, check_on_set=True, compute_default_fn=None, constant=False, default=bottom, instantiate=False, names=None, objects=[‘bottom’, ‘top’, None], pickle_default_value=True, precedence=None, readonly=False, watchers={} ) - Whether and where to display the xaxis, supported options are ‘bottom’, ‘top’ and None.
-
param ObjectSelector
yaxis( allow_None=None, check_on_set=True, compute_default_fn=None, constant=False, default=left, instantiate=False, names=None, objects=[‘left’, ‘right’, None], pickle_default_value=True, precedence=None, readonly=False, watchers={} ) - Whether and where to display the yaxis, supported options are ‘left’, ‘right’ and None.
-
param Integer
xrotation( allow_None=False, bounds=(0, 360), constant=False, default=0, inclusive_bounds=(True, True), instantiate=False, pickle_default_value=True, precedence=None, readonly=False, softbounds=None, time_dependent=False, time_fn=<Time Time00001>, watchers={} ) - Rotation angle of the xticks.
-
param Integer
yrotation( allow_None=False, bounds=(0, 360), constant=False, default=0, inclusive_bounds=(True, True), instantiate=False, pickle_default_value=True, precedence=None, readonly=False, softbounds=None, time_dependent=False, time_fn=<Time Time00001>, watchers={} ) - Rotation angle of the yticks.
-
anim( start=0 , stop=None , fps=30 ) ¶ -
Method to return a matplotlib animation. The start and stop frames may be specified as well as the fps.
-
cleanup( ) ¶ -
Cleans up references to the plot on the attached Stream subscribers.
-
compute_ranges( obj , key , ranges ) ¶ -
Given an object, a specific key, and the normalization options, this method will find the specified normalization options on the appropriate OptionTree, group the elements according to the selected normalization option (i.e. either per frame or over the whole animation) and finally compute the dimension ranges in each group. The new set of ranges is returned.
-
debug( *args , **kwargs ) ¶ -
Inspect .param.debug method for the full docstring
-
defaults( *args , **kwargs ) ¶ -
Inspect .param.defaults method for the full docstring
-
force_new_dynamic_value= functools.partial(<function Parameters.deprecate.<locals>.inner>, <class 'holoviews.plotting.mpl.plot.GridPlot'>) 
-
get_param_values= functools.partial(<function Parameters.deprecate.<locals>.inner>, <class 'holoviews.plotting.mpl.plot.GridPlot'>) 
-
get_value_generator= functools.partial(<function Parameters.deprecate.<locals>.inner>, <class 'holoviews.plotting.mpl.plot.GridPlot'>) 
-
init_comm( ) ¶ -
Initializes comm and attaches streams.
-
inspect_value= functools.partial(<function Parameters.deprecate.<locals>.inner>, <class 'holoviews.plotting.mpl.plot.GridPlot'>) 
-
matches( spec ) ¶ -
Matches a specification against the current Plot.
-
message( *args , **kwargs ) ¶ -
Inspect .param.message method for the full docstring
-
params( *args , **kwargs ) ¶ -
Inspect .param.params method for the full docstring
-
pprint( imports=None , prefix=' ' , unknown_value='<?>' , qualify=False , separator='' ) ¶ -
(Experimental) Pretty printed representation that may be evaluated with eval. See pprint() function for more details.
-
print_param_defaults( *args , **kwargs ) ¶ -
Inspect .param.print_param_defaults method for the full docstring
-
print_param_values( *args , **kwargs ) ¶ -
Inspect .param.print_param_values method for the full docstring
-
push( ) ¶ -
Pushes updated plot data via the Comm.
-
refresh( **kwargs ) ¶ -
Refreshes the plot by rerendering it and then pushing the updated data if the plot has an associated Comm.
-
script_repr( imports=[] , prefix=' ' ) ¶ -
Variant of __repr__ designed for generating a runnable script.
-
set_default( *args , **kwargs ) ¶ -
Inspect .param.set_default method for the full docstring
-
set_dynamic_time_fn= functools.partial(<function Parameters.deprecate.<locals>.inner>, <class 'holoviews.plotting.mpl.plot.GridPlot'>) 
-
set_param= functools.partial(<function Parameters.deprecate.<locals>.inner>, <class 'holoviews.plotting.mpl.plot.GridPlot'>) 
-
state_pop( ) ¶ -
Restore the most recently saved state.
See state_push() for more details.
-
state_push( ) ¶ -
Save this instance’s state.
For Parameterized instances, this includes the state of dynamically generated values.
Subclasses that maintain short-term state should additionally save and restore that state using state_push() and state_pop().
Generally, this method is used by operations that need to test something without permanently altering the objects’ state.
-
traverse( fn=None , specs=None , full_breadth=True ) ¶ -
Traverses any nested DimensionedPlot returning a list of all plots that match the specs. The specs should be supplied as a list of either Plot types or callables, which should return a boolean given the plot class.
-
verbose( *args , **kwargs ) ¶ -
Inspect .param.verbose method for the full docstring
-
warning( *args , **kwargs ) ¶ -
Inspect .param.warning method for the full docstring
-
param Parameter
-
class
holoviews.plotting.mpl.plot.LayoutPlot( layout , keys=None , **params ) [source] ¶ -
Bases:
holoviews.plotting.plot.GenericLayoutPlot,holoviews.plotting.mpl.plot.CompositePlotA LayoutPlot accepts either a Layout or a NdLayout and displays the elements in a cartesian grid in scanline order.
-
param Parameter
fontsize( allow_None=True, constant=False, default={‘title’: 16}, instantiate=False, pickle_default_value=True, precedence=None, readonly=False, watchers={} ) - Specifies various font sizes of the displayed text. Finer control is available by supplying a dictionary where any unmentioned keys revert to the default sizes, e.g: {‘ticks’:20, ‘title’:15, ‘ylabel’:5, ‘xlabel’:5, ‘zlabel’:5, ‘legend’:8, ‘legend_title’:13} You can set the font size of ‘zlabel’, ‘ylabel’ and ‘xlabel’ together using the ‘labels’ key.
-
param Boolean
show_title( allow_None=False, bounds=(0, 1), constant=False, default=True, instantiate=False, pickle_default_value=True, precedence=None, readonly=False, watchers={} ) - Whether to display the plot title.
-
param String
title( allow_None=False, basestring=<class ‘str’>, constant=False, default={label} {group} {dimensions}, instantiate=False, pickle_default_value=True, precedence=None, readonly=False, regex=None, watchers={} ) - The formatting string for the title of this plot, allows defining a label group separator and dimension labels.
-
param String
title_format( allow_None=True, basestring=<class ‘str’>, constant=False, default=None, instantiate=False, pickle_default_value=True, precedence=None, readonly=False, regex=None, watchers={} ) - Alias for title.
-
param Boolean
normalize( allow_None=False, bounds=(0, 1), constant=False, default=True, instantiate=False, pickle_default_value=True, precedence=None, readonly=False, watchers={} ) - Whether to compute ranges across all Elements at this level of plotting. Allows selecting normalization at different levels for nested data containers.
-
param Parameter
projection( allow_None=True, constant=False, default=None, instantiate=False, pickle_default_value=True, precedence=None, readonly=False, watchers={} ) - The projection of the plot axis, default of None is equivalent to 2D plot, ‘3d’ and ‘polar’ are also supported by matplotlib by default. May also supply a custom projection that is either a matplotlib projection type or implements the _as_mpl_axes method.
-
param Number
fig_alpha( allow_None=False, bounds=(0, 1), constant=False, default=1.0, inclusive_bounds=(True, True), instantiate=False, pickle_default_value=True, precedence=None, readonly=False, softbounds=None, time_dependent=False, time_fn=<Time Time00001>, watchers={} ) - Alpha of the overall figure background.
-
param NumericTuple
fig_bounds( allow_None=False, constant=False, default=(0.05, 0.05, 0.95, 0.95), instantiate=False, length=4, pickle_default_value=True, precedence=None, readonly=False, watchers={} ) - The bounds of the figure as a 4-tuple of the form (left, bottom, right, top), defining the size of the border around the subplots.
-
param Parameter
fig_inches( allow_None=False, constant=False, default=4, instantiate=False, pickle_default_value=True, precedence=None, readonly=False, watchers={} ) - The overall matplotlib figure size in inches. May be set as an integer in which case it will be used to autocompute a size. Alternatively may be set with an explicit tuple or list, in which case it will be applied directly after being scaled by fig_size. If either the width or height is set to None, it will be computed automatically.
-
param Boolean
fig_latex( allow_None=False, bounds=(0, 1), constant=False, default=False, instantiate=False, pickle_default_value=True, precedence=None, readonly=False, watchers={} ) - Whether to use LaTeX text in the overall figure.
-
param Dict
fig_rcparams( allow_None=False, constant=False, default={}, instantiate=True, is_instance=True, pickle_default_value=True, precedence=None, readonly=False, watchers={} ) - matplotlib rc parameters to apply to the overall figure.
-
param Number
fig_size( allow_None=False, bounds=(1, None), constant=False, default=100.0, inclusive_bounds=(True, True), instantiate=False, pickle_default_value=True, precedence=None, readonly=False, softbounds=None, time_dependent=False, time_fn=<Time Time00001>, watchers={} ) - Size relative to the supplied overall fig_inches in percent.
-
param HookList
initial_hooks( allow_None=False, bounds=(0, None), constant=False, default=[], instantiate=True, pickle_default_value=True, precedence=None, readonly=False, watchers={} ) - Optional list of hooks called before plotting the data onto the axis (now marked for deprecation). The hook is passed the plot object and the displayed object; other plotting handles can be accessed via plot.handles.
-
param HookList
finalize_hooks( allow_None=False, bounds=(0, None), constant=False, default=[], instantiate=True, pickle_default_value=True, precedence=None, readonly=False, watchers={} ) - Deprecated; use hooks options instead.
-
param HookList
hooks( allow_None=False, bounds=(0, None), constant=False, default=[], instantiate=True, pickle_default_value=True, precedence=None, readonly=False, watchers={} ) - Optional list of hooks called when finalizing a plot. The hook is passed the plot object and the displayed element, and other plotting handles can be accessed via plot.handles.
-
param String
sublabel_format( allow_None=True, basestring=<class ‘str’>, constant=False, default=None, instantiate=False, pickle_default_value=True, precedence=None, readonly=False, regex=None, watchers={} ) - Allows labeling the subaxes in each plot with various formatters including {Alpha}, {alpha}, {numeric} and {roman}.
-
param NumericTuple
sublabel_position( allow_None=False, constant=False, default=(-0.35, 0.85), instantiate=False, length=2, pickle_default_value=True, precedence=None, readonly=False, watchers={} ) - Position relative to the plot for placing the optional subfigure label.
-
param Number
sublabel_size( allow_None=False, bounds=None, constant=False, default=18, inclusive_bounds=(True, True), instantiate=False, pickle_default_value=True, precedence=None, readonly=False, softbounds=None, time_dependent=False, time_fn=<Time Time00001>, watchers={} ) - Size of optional subfigure label.
-
param Boolean
show_frame( allow_None=False, bounds=(0, 1), constant=False, default=False, instantiate=False, pickle_default_value=True, precedence=None, readonly=False, watchers={} ) - Whether or not to show a complete frame around the plot.
-
param Boolean
transpose( allow_None=False, bounds=(0, 1), constant=False, default=False, instantiate=False, pickle_default_value=True, precedence=None, readonly=False, watchers={} ) - Whether to transpose the layout when plotting. Switches from row-based left-to-right and top-to-bottom scanline order to column-based top-to-bottom and left-to-right order.
-
param ObjectSelector
absolute_scaling( allow_None=None, check_on_set=False, compute_default_fn=None, constant=False, default=False, instantiate=False, names=None, objects=[], pickle_default_value=True, precedence=None, readonly=False, watchers={} ) - If aspect_weight is enabled absolute_scaling determines whether axes are scaled relative to the widest plot or whether the aspect scales the axes in absolute terms.
-
param Number
aspect_weight( allow_None=False, bounds=None, constant=False, default=0, inclusive_bounds=(True, True), instantiate=False, pickle_default_value=True, precedence=None, readonly=False, softbounds=None, time_dependent=False, time_fn=<Time Time00001>, watchers={} ) - Weighting of the individual aspects when computing the Layout grid aspects and overall figure size.
-
param Boolean
tight( allow_None=False, bounds=(0, 1), constant=False, default=False, instantiate=False, pickle_default_value=True, precedence=None, readonly=False, watchers={} ) - Tightly fit the axes in the layout within the fig_bounds and tight_padding.
-
param Parameter
tight_padding( allow_None=False, constant=False, default=3, instantiate=False, pickle_default_value=True, precedence=None, readonly=False, watchers={} ) - Integer or tuple specifying the padding in inches in a tight layout.
-
param Number
hspace( allow_None=False, bounds=None, constant=False, default=0.5, inclusive_bounds=(True, True), instantiate=False, pickle_default_value=True, precedence=None, readonly=False, softbounds=None, time_dependent=False, time_fn=<Time Time00001>, watchers={} ) - Specifies the space between horizontally adjacent elements in the grid. Default value is set conservatively to avoid overlap of subplots.
-
param Number
vspace( allow_None=False, bounds=None, constant=False, default=0.3, inclusive_bounds=(True, True), instantiate=False, pickle_default_value=True, precedence=None, readonly=False, softbounds=None, time_dependent=False, time_fn=<Time Time00001>, watchers={} ) - Specifies the space between vertically adjacent elements in the grid. Default value is set conservatively to avoid overlap of subplots.
-
anim( start=0 , stop=None , fps=30 ) ¶ -
Method to return a matplotlib animation. The start and stop frames may be specified as well as the fps.
-
cleanup( ) ¶ -
Cleans up references to the plot on the attached Stream subscribers.
-
compute_ranges( obj , key , ranges ) ¶ -
Given an object, a specific key, and the normalization options, this method will find the specified normalization options on the appropriate OptionTree, group the elements according to the selected normalization option (i.e. either per frame or over the whole animation) and finally compute the dimension ranges in each group. The new set of ranges is returned.
-
debug( *args , **kwargs ) ¶ -
Inspect .param.debug method for the full docstring
-
defaults( *args , **kwargs ) ¶ -
Inspect .param.defaults method for the full docstring
-
force_new_dynamic_value= functools.partial(<function Parameters.deprecate.<locals>.inner>, <class 'holoviews.plotting.mpl.plot.LayoutPlot'>) 
-
get_param_values= functools.partial(<function Parameters.deprecate.<locals>.inner>, <class 'holoviews.plotting.mpl.plot.LayoutPlot'>) 
-
get_value_generator= functools.partial(<function Parameters.deprecate.<locals>.inner>, <class 'holoviews.plotting.mpl.plot.LayoutPlot'>) 
-
grid_situate( current_idx , layout_type , subgrid_width ) [source] ¶ -
Situate the current AdjointLayoutPlot in a LayoutPlot. The LayoutPlot specifies a layout_type into which the AdjointLayoutPlot must be embedded. This enclosing layout is guaranteed to have enough cells to display all the views.
Based on this enforced layout format, a starting index supplied by LayoutPlot (indexing into a large gridspec arrangement) is updated to the appropriate embedded value. It will also return a list of gridspec indices associated with the all the required layout axes.
-
init_comm( ) ¶ -
Initializes comm and attaches streams.
-
inspect_value= functools.partial(<function Parameters.deprecate.<locals>.inner>, <class 'holoviews.plotting.mpl.plot.LayoutPlot'>) 
-
matches( spec ) ¶ -
Matches a specification against the current Plot.
-
message( *args , **kwargs ) ¶ -
Inspect .param.message method for the full docstring
-
params( *args , **kwargs ) ¶ -
Inspect .param.params method for the full docstring
-
pprint( imports=None , prefix=' ' , unknown_value='<?>' , qualify=False , separator='' ) ¶ -
(Experimental) Pretty printed representation that may be evaluated with eval. See pprint() function for more details.
-
print_param_defaults( *args , **kwargs ) ¶ -
Inspect .param.print_param_defaults method for the full docstring
-
print_param_values( *args , **kwargs ) ¶ -
Inspect .param.print_param_values method for the full docstring
-
push( ) ¶ -
Pushes updated plot data via the Comm.
-
refresh( **kwargs ) ¶ -
Refreshes the plot by rerendering it and then pushing the updated data if the plot has an associated Comm.
-
script_repr( imports=[] , prefix=' ' ) ¶ -
Variant of __repr__ designed for generating a runnable script.
-
set_default( *args , **kwargs ) ¶ -
Inspect .param.set_default method for the full docstring
-
set_dynamic_time_fn= functools.partial(<function Parameters.deprecate.<locals>.inner>, <class 'holoviews.plotting.mpl.plot.LayoutPlot'>) 
-
set_param= functools.partial(<function Parameters.deprecate.<locals>.inner>, <class 'holoviews.plotting.mpl.plot.LayoutPlot'>) 
-
state_pop( ) ¶ -
Restore the most recently saved state.
See state_push() for more details.
-
state_push( ) ¶ -
Save this instance’s state.
For Parameterized instances, this includes the state of dynamically generated values.
Subclasses that maintain short-term state should additionally save and restore that state using state_push() and state_pop().
Generally, this method is used by operations that need to test something without permanently altering the objects’ state.
-
traverse( fn=None , specs=None , full_breadth=True ) ¶ -
Traverses any nested DimensionedPlot returning a list of all plots that match the specs. The specs should be supplied as a list of either Plot types or callables, which should return a boolean given the plot class.
-
verbose( *args , **kwargs ) ¶ -
Inspect .param.verbose method for the full docstring
-
warning( *args , **kwargs ) ¶ -
Inspect .param.warning method for the full docstring
-
param Parameter
-
class
holoviews.plotting.mpl.plot.MPLPlot( fig=None , axis=None , **params ) [source] ¶ -
Bases:
holoviews.plotting.plot.DimensionedPlotAn MPLPlot object draws a matplotlib figure object when called or indexed but can also return a matplotlib animation object as appropriate. MPLPlots take element objects such as Image, Contours or Points as inputs and plots them in the appropriate format using matplotlib. As HoloMaps are supported, all plots support animation via the anim() method.
-
param Parameter
fontsize( allow_None=True, constant=False, default=None, instantiate=False, pickle_default_value=True, precedence=None, readonly=False, watchers={} ) - Specifies various font sizes of the displayed text. Finer control is available by supplying a dictionary where any unmentioned keys revert to the default sizes, e.g: {‘ticks’:20, ‘title’:15, ‘ylabel’:5, ‘xlabel’:5, ‘zlabel’:5, ‘legend’:8, ‘legend_title’:13} You can set the font size of ‘zlabel’, ‘ylabel’ and ‘xlabel’ together using the ‘labels’ key.
-
param Boolean
show_title( allow_None=False, bounds=(0, 1), constant=False, default=True, instantiate=False, pickle_default_value=True, precedence=None, readonly=False, watchers={} ) - Whether to display the plot title.
-
param String
title( allow_None=False, basestring=<class ‘str’>, constant=False, default={label} {group} {dimensions}, instantiate=False, pickle_default_value=True, precedence=None, readonly=False, regex=None, watchers={} ) - The formatting string for the title of this plot, allows defining a label group separator and dimension labels.
-
param String
title_format( allow_None=True, basestring=<class ‘str’>, constant=False, default=None, instantiate=False, pickle_default_value=True, precedence=None, readonly=False, regex=None, watchers={} ) - Alias for title.
-
param Boolean
normalize( allow_None=False, bounds=(0, 1), constant=False, default=True, instantiate=False, pickle_default_value=True, precedence=None, readonly=False, watchers={} ) - Whether to compute ranges across all Elements at this level of plotting. Allows selecting normalization at different levels for nested data containers.
-
param Parameter
projection( allow_None=True, constant=False, default=None, instantiate=False, pickle_default_value=True, precedence=None, readonly=False, watchers={} ) - The projection of the plot axis, default of None is equivalent to 2D plot, ‘3d’ and ‘polar’ are also supported by matplotlib by default. May also supply a custom projection that is either a matplotlib projection type or implements the _as_mpl_axes method.
-
param Number
fig_alpha( allow_None=False, bounds=(0, 1), constant=False, default=1.0, inclusive_bounds=(True, True), instantiate=False, pickle_default_value=True, precedence=None, readonly=False, softbounds=None, time_dependent=False, time_fn=<Time Time00001>, watchers={} ) - Alpha of the overall figure background.
-
param NumericTuple
fig_bounds( allow_None=False, constant=False, default=(0.15, 0.15, 0.85, 0.85), instantiate=False, length=4, pickle_default_value=True, precedence=None, readonly=False, watchers={} ) - The bounds of the overall figure as a 4-tuple of the form (left, bottom, right, top), defining the size of the border around the subplots.
-
param Parameter
fig_inches( allow_None=False, constant=False, default=4, instantiate=False, pickle_default_value=True, precedence=None, readonly=False, watchers={} ) - The overall matplotlib figure size in inches. May be set as an integer in which case it will be used to autocompute a size. Alternatively may be set with an explicit tuple or list, in which case it will be applied directly after being scaled by fig_size. If either the width or height is set to None, it will be computed automatically.
-
param Boolean
fig_latex( allow_None=False, bounds=(0, 1), constant=False, default=False, instantiate=False, pickle_default_value=True, precedence=None, readonly=False, watchers={} ) - Whether to use LaTeX text in the overall figure.
-
param Dict
fig_rcparams( allow_None=False, constant=False, default={}, instantiate=True, is_instance=True, pickle_default_value=True, precedence=None, readonly=False, watchers={} ) - matplotlib rc parameters to apply to the overall figure.
-
param Number
fig_size( allow_None=False, bounds=(1, None), constant=False, default=100.0, inclusive_bounds=(True, True), instantiate=False, pickle_default_value=True, precedence=None, readonly=False, softbounds=None, time_dependent=False, time_fn=<Time Time00001>, watchers={} ) - Size relative to the supplied overall fig_inches in percent.
-
param HookList
initial_hooks( allow_None=False, bounds=(0, None), constant=False, default=[], instantiate=True, pickle_default_value=True, precedence=None, readonly=False, watchers={} ) - Optional list of hooks called before plotting the data onto the axis (now marked for deprecation). The hook is passed the plot object and the displayed object; other plotting handles can be accessed via plot.handles.
-
param HookList
finalize_hooks( allow_None=False, bounds=(0, None), constant=False, default=[], instantiate=True, pickle_default_value=True, precedence=None, readonly=False, watchers={} ) - Deprecated; use hooks options instead.
-
param HookList
hooks( allow_None=False, bounds=(0, None), constant=False, default=[], instantiate=True, pickle_default_value=True, precedence=None, readonly=False, watchers={} ) - Optional list of hooks called when finalizing a plot. The hook is passed the plot object and the displayed element, and other plotting handles can be accessed via plot.handles.
-
param String
sublabel_format( allow_None=True, basestring=<class ‘str’>, constant=False, default=None, instantiate=False, pickle_default_value=True, precedence=None, readonly=False, regex=None, watchers={} ) - Allows labeling the subaxes in each plot with various formatters including {Alpha}, {alpha}, {numeric} and {roman}.
-
param NumericTuple
sublabel_position( allow_None=False, constant=False, default=(-0.35, 0.85), instantiate=False, length=2, pickle_default_value=True, precedence=None, readonly=False, watchers={} ) - Position relative to the plot for placing the optional subfigure label.
-
param Number
sublabel_size( allow_None=False, bounds=None, constant=False, default=18, inclusive_bounds=(True, True), instantiate=False, pickle_default_value=True, precedence=None, readonly=False, softbounds=None, time_dependent=False, time_fn=<Time Time00001>, watchers={} ) - Size of optional subfigure label.
-
param Boolean
show_frame( allow_None=False, bounds=(0, 1), constant=False, default=False, instantiate=False, pickle_default_value=True, precedence=None, readonly=False, watchers={} ) - Whether or not to show a complete frame around the plot.
-
anim( start=0 , stop=None , fps=30 ) [source] ¶ -
Method to return a matplotlib animation. The start and stop frames may be specified as well as the fps.
-
cleanup( ) ¶ -
Cleans up references to the plot on the attached Stream subscribers.
-
compute_ranges( obj , key , ranges ) ¶ -
Given an object, a specific key, and the normalization options, this method will find the specified normalization options on the appropriate OptionTree, group the elements according to the selected normalization option (i.e. either per frame or over the whole animation) and finally compute the dimension ranges in each group. The new set of ranges is returned.
-
debug( *args , **kwargs ) ¶ -
Inspect .param.debug method for the full docstring
-
defaults( *args , **kwargs ) ¶ -
Inspect .param.defaults method for the full docstring
-
force_new_dynamic_value= functools.partial(<function Parameters.deprecate.<locals>.inner>, <class 'holoviews.plotting.mpl.plot.MPLPlot'>) 
-
get_param_values= functools.partial(<function Parameters.deprecate.<locals>.inner>, <class 'holoviews.plotting.mpl.plot.MPLPlot'>) 
-
get_value_generator= functools.partial(<function Parameters.deprecate.<locals>.inner>, <class 'holoviews.plotting.mpl.plot.MPLPlot'>) 
-
init_comm( ) ¶ -
Initializes comm and attaches streams.
-
initialize_plot( ranges=None ) ¶ -
Initialize the matplotlib figure.
-
inspect_value= functools.partial(<function Parameters.deprecate.<locals>.inner>, <class 'holoviews.plotting.mpl.plot.MPLPlot'>) 
-
matches( spec ) ¶ -
Matches a specification against the current Plot.
-
message( *args , **kwargs ) ¶ -
Inspect .param.message method for the full docstring
-
params( *args , **kwargs ) ¶ -
Inspect .param.params method for the full docstring
-
pprint( imports=None , prefix=' ' , unknown_value='<?>' , qualify=False , separator='' ) ¶ -
(Experimental) Pretty printed representation that may be evaluated with eval. See pprint() function for more details.
-
print_param_defaults( *args , **kwargs ) ¶ -
Inspect .param.print_param_defaults method for the full docstring
-
print_param_values( *args , **kwargs ) ¶ -
Inspect .param.print_param_values method for the full docstring
-
push( ) ¶ -
Pushes updated plot data via the Comm.
-
refresh( **kwargs ) ¶ -
Refreshes the plot by rerendering it and then pushing the updated data if the plot has an associated Comm.
-
script_repr( imports=[] , prefix=' ' ) ¶ -
Variant of __repr__ designed for generating a runnable script.
-
set_default( *args , **kwargs ) ¶ -
Inspect .param.set_default method for the full docstring
-
set_dynamic_time_fn= functools.partial(<function Parameters.deprecate.<locals>.inner>, <class 'holoviews.plotting.mpl.plot.MPLPlot'>) 
-
set_param= functools.partial(<function Parameters.deprecate.<locals>.inner>, <class 'holoviews.plotting.mpl.plot.MPLPlot'>) 
-
state_pop( ) ¶ -
Restore the most recently saved state.
See state_push() for more details.
-
state_push( ) ¶ -
Save this instance’s state.
For Parameterized instances, this includes the state of dynamically generated values.
Subclasses that maintain short-term state should additionally save and restore that state using state_push() and state_pop().
Generally, this method is used by operations that need to test something without permanently altering the objects’ state.
-
traverse( fn=None , specs=None , full_breadth=True ) ¶ -
Traverses any nested DimensionedPlot returning a list of all plots that match the specs. The specs should be supplied as a list of either Plot types or callables, which should return a boolean given the plot class.
-
verbose( *args , **kwargs ) ¶ -
Inspect .param.verbose method for the full docstring
-
warning( *args , **kwargs ) ¶ -
Inspect .param.warning method for the full docstring
-
param Parameter
raster
Module

-
class
holoviews.plotting.mpl.raster.RasterGridPlot( layout , keys=None , dimensions=None , create_axes=False , ranges=None , layout_num=1 , **params ) [source] ¶ -
Bases:
holoviews.plotting.mpl.plot.GridPlot,holoviews.plotting.mpl.element.OverlayPlotRasterGridPlot evenly spaces out plots of individual projections on a grid, even when they differ in size. Since this class uses a single axis to generate all the individual plots it is much faster than the equivalent using subplots.
-
param Parameter
fontsize( allow_None=True, constant=False, default=None, instantiate=False, pickle_default_value=True, precedence=None, readonly=False, watchers={} ) - Specifies various font sizes of the displayed text. Finer control is available by supplying a dictionary where any unmentioned keys revert to the default sizes, e.g: {‘ticks’:20, ‘title’:15, ‘ylabel’:5, ‘xlabel’:5, ‘zlabel’:5, ‘legend’:8, ‘legend_title’:13} You can set the font size of ‘zlabel’, ‘ylabel’ and ‘xlabel’ together using the ‘labels’ key.
-
param Boolean
show_title( allow_None=False, bounds=(0, 1), constant=False, default=True, instantiate=False, pickle_default_value=True, precedence=None, readonly=False, watchers={} ) - Whether to display the plot title.
-
param String
title( allow_None=False, basestring=<class ‘str’>, constant=False, default={label} {group} {dimensions}, instantiate=False, pickle_default_value=True, precedence=None, readonly=False, regex=None, watchers={} ) - The formatting string for the title of this plot, allows defining a label group separator and dimension labels.
-
param String
title_format( allow_None=True, basestring=<class ‘str’>, constant=False, default=None, instantiate=False, pickle_default_value=True, precedence=None, readonly=False, regex=None, watchers={} ) - Alias for title.
-
param Boolean
normalize( allow_None=False, bounds=(0, 1), constant=False, default=True, instantiate=False, pickle_default_value=True, precedence=None, readonly=False, watchers={} ) - Whether to compute ranges across all Elements at this level of plotting. Allows selecting normalization at different levels for nested data containers.
-
param Parameter
projection( allow_None=True, constant=False, default=None, instantiate=False, pickle_default_value=True, precedence=None, readonly=False, watchers={} ) - The projection of the plot axis, default of None is equivalent to 2D plot, ‘3d’ and ‘polar’ are also supported by matplotlib by default. May also supply a custom projection that is either a matplotlib projection type or implements the _as_mpl_axes method.
-
param Number
fig_alpha( allow_None=False, bounds=(0, 1), constant=False, default=1.0, inclusive_bounds=(True, True), instantiate=False, pickle_default_value=True, precedence=None, readonly=False, softbounds=None, time_dependent=False, time_fn=<Time Time00001>, watchers={} ) - Alpha of the overall figure background.
-
param NumericTuple
fig_bounds( allow_None=False, constant=False, default=(0.15, 0.15, 0.85, 0.85), instantiate=False, length=4, pickle_default_value=True, precedence=None, readonly=False, watchers={} ) - The bounds of the overall figure as a 4-tuple of the form (left, bottom, right, top), defining the size of the border around the subplots.
-
param Parameter
fig_inches( allow_None=False, constant=False, default=4, instantiate=False, pickle_default_value=True, precedence=None, readonly=False, watchers={} ) - The overall matplotlib figure size in inches. May be set as an integer in which case it will be used to autocompute a size. Alternatively may be set with an explicit tuple or list, in which case it will be applied directly after being scaled by fig_size. If either the width or height is set to None, it will be computed automatically.
-
param Boolean
fig_latex( allow_None=False, bounds=(0, 1), constant=False, default=False, instantiate=False, pickle_default_value=True, precedence=None, readonly=False, watchers={} ) - Whether to use LaTeX text in the overall figure.
-
param Dict
fig_rcparams( allow_None=False, constant=False, default={}, instantiate=True, is_instance=True, pickle_default_value=True, precedence=None, readonly=False, watchers={} ) - matplotlib rc parameters to apply to the overall figure.
-
param Number
fig_size( allow_None=False, bounds=(1, None), constant=False, default=100.0, inclusive_bounds=(True, True), instantiate=False, pickle_default_value=True, precedence=None, readonly=False, softbounds=None, time_dependent=False, time_fn=<Time Time00001>, watchers={} ) - Size relative to the supplied overall fig_inches in percent.
-
param HookList
initial_hooks( allow_None=False, bounds=(0, None), constant=False, default=[], instantiate=True, pickle_default_value=True, precedence=None, readonly=False, watchers={} ) - Optional list of hooks called before plotting the data onto the axis (now marked for deprecation). The hook is passed the plot object and the displayed object; other plotting handles can be accessed via plot.handles.
-
param HookList
finalize_hooks( allow_None=False, bounds=(0, None), constant=False, default=[], instantiate=True, pickle_default_value=True, precedence=None, readonly=False, watchers={} ) - Deprecated; use hooks options instead.
-
param HookList
hooks( allow_None=False, bounds=(0, None), constant=False, default=[], instantiate=True, pickle_default_value=True, precedence=None, readonly=False, watchers={} ) - Optional list of hooks called when finalizing a plot. The hook is passed the plot object and the displayed element, and other plotting handles can be accessed via plot.handles.
-
param String
sublabel_format( allow_None=True, basestring=<class ‘str’>, constant=False, default=None, instantiate=False, pickle_default_value=True, precedence=None, readonly=False, regex=None, watchers={} ) - Allows labeling the subaxes in each plot with various formatters including {Alpha}, {alpha}, {numeric} and {roman}.
-
param NumericTuple
sublabel_position( allow_None=False, constant=False, default=(-0.35, 0.85), instantiate=False, length=2, pickle_default_value=True, precedence=None, readonly=False, watchers={} ) - Position relative to the plot for placing the optional subfigure label.
-
param Number
sublabel_size( allow_None=False, bounds=None, constant=False, default=18, inclusive_bounds=(True, True), instantiate=False, pickle_default_value=True, precedence=None, readonly=False, softbounds=None, time_dependent=False, time_fn=<Time Time00001>, watchers={} ) - Size of optional subfigure label.
-
param Boolean
show_frame( allow_None=False, bounds=(0, 1), constant=False, default=False, instantiate=False, pickle_default_value=True, precedence=None, readonly=False, watchers={} ) - Whether or not to show a complete frame around the plot.
-
param Parameter
apply_ranges( allow_None=True, constant=False, default=True, instantiate=False, pickle_default_value=True, precedence=-1, readonly=False, watchers={} ) - Whether to compute the plot bounds from the data itself.
-
param Parameter
apply_extents( allow_None=True, constant=False, default=True, instantiate=False, pickle_default_value=True, precedence=-1, readonly=False, watchers={} ) - Whether to apply extent overrides on the Elements
-
param Parameter
bgcolor( allow_None=True, constant=False, default=None, instantiate=True, pickle_default_value=True, precedence=-1, readonly=False, watchers={} ) - If set bgcolor overrides the background color of the axis.
-
param Parameter
default_span( allow_None=True, constant=False, default=2.0, instantiate=True, pickle_default_value=True, precedence=-1, readonly=False, watchers={} ) - Defines the span of an axis if the axis range is zero, i.e. if the lower and upper end of an axis are equal or no range is defined at all. For example if there is a single datapoint at 0 a default_span of 2.0 will result in axis ranges spanning from -1 to 1.
-
param Parameter
invert_axes( allow_None=True, constant=False, default=False, instantiate=False, pickle_default_value=True, precedence=-1, readonly=False, watchers={} ) - Whether to invert the x- and y-axis
-
param Parameter
invert_xaxis( allow_None=True, constant=False, default=False, instantiate=False, pickle_default_value=True, precedence=-1, readonly=False, watchers={} ) - Whether to invert the plot x-axis.
-
param Parameter
invert_yaxis( allow_None=True, constant=False, default=False, instantiate=False, pickle_default_value=True, precedence=-1, readonly=False, watchers={} ) - Whether to invert the plot y-axis.
-
param Parameter
logx( allow_None=True, constant=False, default=False, instantiate=False, pickle_default_value=True, precedence=-1, readonly=False, watchers={} ) - Whether the x-axis of the plot will be a log axis.
-
param Parameter
logy( allow_None=True, constant=False, default=False, instantiate=False, pickle_default_value=True, precedence=-1, readonly=False, watchers={} ) - Whether the y-axis of the plot will be a log axis.
-
param Number
padding( allow_None=False, bounds=None, constant=False, default=0.1, inclusive_bounds=(True, True), instantiate=True, pickle_default_value=True, precedence=None, readonly=False, softbounds=None, time_dependent=False, time_fn=<Time Time00001>, watchers={} ) - The amount of padding as a fraction of the total Grid size
-
param Boolean
show_legend( allow_None=False, bounds=(0, 1), constant=False, default=False, instantiate=False, pickle_default_value=True, precedence=None, readonly=False, watchers={} ) - Legends add to much clutter in a grid and are disabled by default.
-
param Parameter
show_grid( allow_None=True, constant=False, default=False, instantiate=False, pickle_default_value=True, precedence=-1, readonly=False, watchers={} ) - Whether to show a Cartesian grid on the plot.
-
param ObjectSelector
xaxis( allow_None=None, check_on_set=True, compute_default_fn=None, constant=False, default=bottom, instantiate=False, names=None, objects=[‘bottom’, ‘top’, None], pickle_default_value=True, precedence=None, readonly=False, watchers={} ) - Whether and where to display the xaxis, supported options are ‘bottom’, ‘top’ and None.
-
param ObjectSelector
yaxis( allow_None=None, check_on_set=True, compute_default_fn=None, constant=False, default=left, instantiate=False, names=None, objects=[‘left’, ‘right’, None], pickle_default_value=True, precedence=None, readonly=False, watchers={} ) - Whether and where to display the yaxis, supported options are ‘left’, ‘right’ and None.
-
param Parameter
xlabel( allow_None=True, constant=False, default=None, instantiate=False, pickle_default_value=True, precedence=-1, readonly=False, watchers={} ) - An explicit override of the x-axis label, if set takes precedence over the dimension label.
-
param Parameter
ylabel( allow_None=True, constant=False, default=None, instantiate=False, pickle_default_value=True, precedence=-1, readonly=False, watchers={} ) - An explicit override of the y-axis label, if set takes precedence over the dimension label.
-
param Parameter
xlim( allow_None=True, constant=False, default=(nan, nan), instantiate=False, pickle_default_value=True, precedence=-1, readonly=False, watchers={} ) - User-specified x-axis range limits for the plot, as a tuple (low,high). If specified, takes precedence over data and dimension ranges.
-
param Parameter
ylim( allow_None=True, constant=False, default=(nan, nan), instantiate=False, pickle_default_value=True, precedence=-1, readonly=False, watchers={} ) - User-specified x-axis range limits for the plot, as a tuple (low,high). If specified, takes precedence over data and dimension ranges.
-
param Parameter
zlim( allow_None=True, constant=False, default=(nan, nan), instantiate=False, pickle_default_value=True, precedence=-1, readonly=False, watchers={} ) - User-specified z-axis range limits for the plot, as a tuple (low,high). If specified, takes precedence over data and dimension ranges.
-
param Integer
xrotation( allow_None=False, bounds=(0, 360), constant=False, default=0, inclusive_bounds=(True, True), instantiate=False, pickle_default_value=True, precedence=None, readonly=False, softbounds=None, time_dependent=False, time_fn=<Time Time00001>, watchers={} ) - Rotation angle of the xticks.
-
param Integer
yrotation( allow_None=False, bounds=(0, 360), constant=False, default=0, inclusive_bounds=(True, True), instantiate=False, pickle_default_value=True, precedence=None, readonly=False, softbounds=None, time_dependent=False, time_fn=<Time Time00001>, watchers={} ) - Rotation angle of the yticks.
-
param Parameter
xticks( allow_None=True, constant=False, default=None, instantiate=False, pickle_default_value=True, precedence=-1, readonly=False, watchers={} ) - Ticks along x-axis specified as an integer, explicit list of tick locations, or bokeh Ticker object. If set to None default bokeh ticking behavior is applied.
-
param Parameter
yticks( allow_None=True, constant=False, default=None, instantiate=False, pickle_default_value=True, precedence=-1, readonly=False, watchers={} ) - Ticks along y-axis specified as an integer, explicit list of tick locations, or bokeh Ticker object. If set to None default bokeh ticking behavior is applied.
-
param Parameter
batched( allow_None=True, constant=False, default=True, instantiate=False, pickle_default_value=True, precedence=-1, readonly=False, watchers={} ) - Whether to plot Elements NdOverlay in a batched plotting call if possible. Disables legends and zorder may not be preserved.
-
param Parameter
legend_limit( allow_None=True, constant=False, default=25, instantiate=False, pickle_default_value=True, precedence=-1, readonly=False, watchers={} ) - Number of rendered glyphs before legends are disabled.
-
param Parameter
style_grouping( allow_None=True, constant=False, default=2, instantiate=False, pickle_default_value=True, precedence=-1, readonly=False, watchers={} ) - The length of the type.group.label spec that will be used to group Elements into style groups. A style_grouping value of 1 will group just by type, a value of 2 will group by type and group, and a value of 3 will group by the full specification.
-
param Parameter
apply_ticks( allow_None=True, constant=False, default=True, instantiate=False, pickle_default_value=True, precedence=-1, readonly=False, watchers={} ) - Whether to apply custom ticks.
-
param Parameter
aspect( allow_None=False, constant=False, default=equal, instantiate=False, pickle_default_value=True, precedence=None, readonly=False, watchers={} ) - Aspect ratios on GridPlot should be automatically determined.
-
param Parameter
invert_zaxis( allow_None=True, constant=False, default=False, instantiate=False, pickle_default_value=True, precedence=-1, readonly=False, watchers={} ) - Whether to invert the plot z-axis.
-
param Parameter
labelled( allow_None=True, constant=False, default=[‘x’, ‘y’], instantiate=True, pickle_default_value=True, precedence=-1, readonly=False, watchers={} ) - Whether to plot the ‘x’ and ‘y’ labels.
-
param Parameter
logz( allow_None=True, constant=False, default=False, instantiate=False, pickle_default_value=True, precedence=-1, readonly=False, watchers={} ) - Whether to apply log scaling to the y-axis of the Chart.
-
param Parameter
xformatter( allow_None=True, constant=False, default=None, instantiate=True, pickle_default_value=True, precedence=-1, readonly=False, watchers={} ) - Formatter for ticks along the x-axis.
-
param Parameter
yformatter( allow_None=True, constant=False, default=None, instantiate=True, pickle_default_value=True, precedence=-1, readonly=False, watchers={} ) - Formatter for ticks along the y-axis.
-
param Parameter
zformatter( allow_None=True, constant=False, default=None, instantiate=True, pickle_default_value=True, precedence=-1, readonly=False, watchers={} ) - Formatter for ticks along the z-axis.
-
param Parameter
zaxis( allow_None=True, constant=False, default=True, instantiate=False, pickle_default_value=True, precedence=-1, readonly=False, watchers={} ) - Whether to display the z-axis.
-
param Parameter
zlabel( allow_None=True, constant=False, default=None, instantiate=False, pickle_default_value=True, precedence=-1, readonly=False, watchers={} ) - An explicit override of the z-axis label, if set takes precedence over the dimension label.
-
param Parameter
zrotation( allow_None=True, constant=False, default=0, instantiate=False, pickle_default_value=True, precedence=-1, readonly=False, watchers={} ) - Rotation angle of the zticks.
-
param Parameter
zticks( allow_None=True, constant=False, default=None, instantiate=False, pickle_default_value=True, precedence=-1, readonly=False, watchers={} ) - Ticks along z-axis specified as an integer, explicit list of tick locations, list of tuples containing the locations and labels or a matplotlib tick locator object. If set to None default matplotlib ticking behavior is applied.
-
param Parameter
legend_cols( allow_None=True, constant=False, default=None, instantiate=False, pickle_default_value=True, precedence=-1, readonly=False, watchers={} ) - Number of legend columns in the legend.
-
param Parameter
legend_position( allow_None=True, constant=False, default=inner, instantiate=False, pickle_default_value=True, precedence=-1, readonly=False, watchers={} ) - Allows selecting between a number of predefined legend position options. The predefined options may be customized in the legend_specs class attribute. By default, ‘inner’, ‘right’, ‘bottom’, ‘top’, ‘left’, ‘best’, ‘top_right’, ‘top_left’, ‘bottom_right’ and ‘bottom_left’ are supported.
-
param Boolean
shared_xaxis( allow_None=False, bounds=(0, 1), constant=False, default=False, instantiate=False, pickle_default_value=True, precedence=None, readonly=False, watchers={} ) - If enabled the x-axes of the GridSpace will be drawn from the objects inside the Grid rather than the GridSpace dimensions.
-
param Boolean
shared_yaxis( allow_None=False, bounds=(0, 1), constant=False, default=False, instantiate=False, pickle_default_value=True, precedence=None, readonly=False, watchers={} ) - If enabled the x-axes of the GridSpace will be drawn from the objects inside the Grid rather than the GridSpace dimensions.
-
anim( start=0 , stop=None , fps=30 ) ¶ -
Method to return a matplotlib animation. The start and stop frames may be specified as well as the fps.
-
cleanup( ) ¶ -
Cleans up references to the plot on the attached Stream subscribers.
-
compute_ranges( obj , key , ranges ) ¶ -
Given an object, a specific key, and the normalization options, this method will find the specified normalization options on the appropriate OptionTree, group the elements according to the selected normalization option (i.e. either per frame or over the whole animation) and finally compute the dimension ranges in each group. The new set of ranges is returned.
-
debug( *args , **kwargs ) ¶ -
Inspect .param.debug method for the full docstring
-
defaults( *args , **kwargs ) ¶ -
Inspect .param.defaults method for the full docstring
-
force_new_dynamic_value= functools.partial(<function Parameters.deprecate.<locals>.inner>, <class 'holoviews.plotting.mpl.raster.RasterGridPlot'>) 
-
get_aspect( xspan , yspan ) ¶ -
Computes the aspect ratio of the plot
-
get_padding( extents ) ¶ -
Computes padding along the axes taking into account the plot aspect.
-
get_param_values= functools.partial(<function Parameters.deprecate.<locals>.inner>, <class 'holoviews.plotting.mpl.raster.RasterGridPlot'>) 
-
get_value_generator= functools.partial(<function Parameters.deprecate.<locals>.inner>, <class 'holoviews.plotting.mpl.raster.RasterGridPlot'>) 
-
get_zorder( overlay , key , el ) ¶ -
Computes the z-order of element in the NdOverlay taking into account possible batching of elements.
-
init_artists( ax , plot_args , plot_kwargs ) ¶ -
Initializes the artist based on the plot method declared on the plot.
-
init_comm( ) ¶ -
Initializes comm and attaches streams.
-
inspect_value= functools.partial(<function Parameters.deprecate.<locals>.inner>, <class 'holoviews.plotting.mpl.raster.RasterGridPlot'>) 
-
matches( spec ) ¶ -
Matches a specification against the current Plot.
-
message( *args , **kwargs ) ¶ -
Inspect .param.message method for the full docstring
-
params( *args , **kwargs ) ¶ -
Inspect .param.params method for the full docstring
-
pprint( imports=None , prefix=' ' , unknown_value='<?>' , qualify=False , separator='' ) ¶ -
(Experimental) Pretty printed representation that may be evaluated with eval. See pprint() function for more details.
-
print_param_defaults( *args , **kwargs ) ¶ -
Inspect .param.print_param_defaults method for the full docstring
-
print_param_values( *args , **kwargs ) ¶ -
Inspect .param.print_param_values method for the full docstring
-
push( ) ¶ -
Pushes updated plot data via the Comm.
-
refresh( **kwargs ) ¶ -
Refreshes the plot by rerendering it and then pushing the updated data if the plot has an associated Comm.
-
script_repr( imports=[] , prefix=' ' ) ¶ -
Variant of __repr__ designed for generating a runnable script.
-
set_default( *args , **kwargs ) ¶ -
Inspect .param.set_default method for the full docstring
-
set_dynamic_time_fn= functools.partial(<function Parameters.deprecate.<locals>.inner>, <class 'holoviews.plotting.mpl.raster.RasterGridPlot'>) 
-
set_param= functools.partial(<function Parameters.deprecate.<locals>.inner>, <class 'holoviews.plotting.mpl.raster.RasterGridPlot'>) 
-
state_pop( ) ¶ -
Restore the most recently saved state.
See state_push() for more details.
-
state_push( ) ¶ -
Save this instance’s state.
For Parameterized instances, this includes the state of dynamically generated values.
Subclasses that maintain short-term state should additionally save and restore that state using state_push() and state_pop().
Generally, this method is used by operations that need to test something without permanently altering the objects’ state.
-
teardown_handles( ) ¶ -
If no custom update_handles method is supplied this method is called to tear down any previous handles before replacing them.
-
traverse( fn=None , specs=None , full_breadth=True ) ¶ -
Traverses any nested DimensionedPlot returning a list of all plots that match the specs. The specs should be supplied as a list of either Plot types or callables, which should return a boolean given the plot class.
-
update_handles( key , axis , element , ranges , style ) ¶ -
Update the elements of the plot.
-
verbose( *args , **kwargs ) ¶ -
Inspect .param.verbose method for the full docstring
-
warning( *args , **kwargs ) ¶ -
Inspect .param.warning method for the full docstring
-
param Parameter
renderer
Module

-
class
holoviews.plotting.mpl.renderer.MPLRenderer( **params ) [source] ¶ -
Bases:
holoviews.plotting.renderer.RendererExporter used to render data from matplotlib, either to a stream or directly to file.
The __call__ method renders an HoloViews component to raw data of a specified matplotlib format. The save method is the corresponding method for saving a HoloViews objects to disk.
The save_fig and save_anim methods are used to save matplotlib figure and animation objects. These match the two primary return types of plotting class implemented with matplotlib.
-
param Callable
key_fn( allow_None=True, constant=True, default=None, instantiate=True, pickle_default_value=True, precedence=None, readonly=False, watchers={} ) - Renderers do not support the saving of object key metadata
-
param Callable
info_fn( allow_None=True, constant=True, instantiate=True, pickle_default_value=True, precedence=None, readonly=False, watchers={} ) - Renderers do not support the saving of object info metadata
-
param String
backend( allow_None=False, basestring=<class ‘str’>, constant=False, default=matplotlib, instantiate=False, pickle_default_value=True, precedence=None, readonly=False, regex=None, watchers={} ) - The backend name.
-
param Integer
dpi( allow_None=False, bounds=None, constant=False, default=72, inclusive_bounds=(True, True), instantiate=False, pickle_default_value=True, precedence=None, readonly=False, softbounds=None, time_dependent=False, time_fn=<Time Time00001>, watchers={} ) - The render resolution in dpi (dots per inch)
-
param ObjectSelector
fig( allow_None=None, check_on_set=True, compute_default_fn=None, constant=False, default=auto, instantiate=False, names=None, objects=[‘png’, ‘svg’, ‘pdf’, ‘html’, None, ‘auto’], pickle_default_value=True, precedence=None, readonly=False, watchers={} ) - Output render format for static figures. If None, no figure rendering will occur.
-
param Number
fps( allow_None=False, bounds=None, constant=False, default=20, inclusive_bounds=(True, True), instantiate=False, pickle_default_value=True, precedence=None, readonly=False, softbounds=None, time_dependent=False, time_fn=<Time Time00001>, watchers={} ) - Rendered fps (frames per second) for animated formats.
-
param ObjectSelector
holomap( allow_None=None, check_on_set=True, compute_default_fn=None, constant=False, default=auto, instantiate=False, names=None, objects=[‘widgets’, ‘scrubber’, ‘webm’, ‘mp4’, ‘gif’, None, ‘auto’], pickle_default_value=True, precedence=None, readonly=False, watchers={} ) - Output render multi-frame (typically animated) format. If None, no multi-frame rendering will occur.
-
param ObjectSelector
mode( allow_None=None, check_on_set=True, compute_default_fn=None, constant=False, default=default, instantiate=False, names=None, objects=[‘default’], pickle_default_value=True, precedence=None, readonly=False, watchers={} ) - The available rendering modes. As a minimum, the ‘default’ mode must be supported.
-
param Integer
size( allow_None=False, bounds=None, constant=False, default=100, inclusive_bounds=(True, True), instantiate=False, pickle_default_value=True, precedence=None, readonly=False, softbounds=None, time_dependent=False, time_fn=<Time Time00001>, watchers={} ) - The rendered size as a percentage size
-
param ObjectSelector
widget_mode( allow_None=None, check_on_set=True, compute_default_fn=None, constant=False, default=embed, instantiate=False, names=None, objects=[‘embed’, ‘live’], pickle_default_value=True, precedence=None, readonly=False, watchers={} ) - The widget mode determining whether frames are embedded or generated ‘live’ when interacting with the widget.
-
param Dict
css( allow_None=False, constant=False, default={}, instantiate=True, is_instance=True, pickle_default_value=True, precedence=None, readonly=False, watchers={} ) - Dictionary of CSS attributes and values to apply to HTML output
-
param Dict
post_render_hooks( allow_None=False, constant=False, default={‘svg’: [], ‘png’: []}, instantiate=True, is_instance=True, pickle_default_value=True, precedence=None, readonly=False, watchers={} ) - Optional dictionary of hooks that are applied to the rendered data (according to the output format) before it is returned. Each hook is passed the rendered data and the object that is being rendered. These hooks allow post-processing of rendered data before output is saved to file or displayed.
-
param Boolean
interactive( allow_None=False, bounds=(0, 1), constant=False, default=False, instantiate=False, pickle_default_value=True, precedence=None, readonly=False, watchers={} ) - Whether to enable interactive plotting allowing interactive plotting with explicitly calling show.
-
comm_manager¶ -
alias of
pyviz_comms.CommManager
-
components( obj , fmt=None , comm=True , **kwargs ) ¶ -
Returns data and metadata dictionaries containing HTML and JS components to include render in app, notebook, or standalone document. Depending on the backend the fmt defines the format embedded in the HTML, e.g. png or svg. If comm is enabled the JS code will set up a Websocket comm channel using the currently defined CommManager.
-
debug( *args , **kwargs ) ¶ -
Inspect .param.debug method for the full docstring
-
defaults( *args , **kwargs ) ¶ -
Inspect .param.defaults method for the full docstring
-
encode( entry ) ¶ -
Classmethod that applies conditional encoding based on mime-type. Given an entry as returned by __call__ return the data in the appropriate encoding.
-
export_widgets= functools.partial(<function Renderer.export_widgets>, <class 'holoviews.plotting.mpl.renderer.MPLRenderer'>) 
-
force_new_dynamic_value= functools.partial(<function Parameters.deprecate.<locals>.inner>, <class 'holoviews.plotting.mpl.renderer.MPLRenderer'>) 
-
get_param_values= functools.partial(<function Parameters.deprecate.<locals>.inner>, <class 'holoviews.plotting.mpl.renderer.MPLRenderer'>) 
-
get_plot= functools.partial(<function Renderer.get_plot>, <class 'holoviews.plotting.mpl.renderer.MPLRenderer'>) 
-
get_value_generator= functools.partial(<function Parameters.deprecate.<locals>.inner>, <class 'holoviews.plotting.mpl.renderer.MPLRenderer'>) 
-
html( obj , fmt=None , css=None , **kwargs ) ¶ -
Renders plot or data structure and wraps the output in HTML. The comm argument defines whether the HTML output includes code to initialize a Comm, if the plot supplies one.
-
html_assets( core=True , extras=True , backends=None , script=False ) ¶ -
Returns JS and CSS and for embedding of widgets.
-
inspect_value= functools.partial(<function Parameters.deprecate.<locals>.inner>, <class 'holoviews.plotting.mpl.renderer.MPLRenderer'>) 
-
instance= functools.partial(<function ParameterizedFunction.instance>, <class 'holoviews.plotting.mpl.renderer.MPLRenderer'>) 
-
message( *args , **kwargs ) ¶ -
Inspect .param.message method for the full docstring
-
params( *args , **kwargs ) ¶ -
Inspect .param.params method for the full docstring
-
classmethod
plot_options( obj , percent_size ) [source] ¶ -
Given a holoviews object and a percentage size, apply heuristics to compute a suitable figure size. For instance, scaling layouts and grids linearly can result in unwieldy figure sizes when there are a large number of elements. As ad hoc heuristics are used, this functionality is kept separate from the plotting classes themselves.
Used by the IPython Notebook display hooks and the save utility. Note that this can be overridden explicitly per object using the fig_size and size plot options.
-
plotting_class( obj ) ¶ -
Given an object or Element class, return the suitable plotting class needed to render it with the current renderer.
-
pprint( imports=None , prefix='\n ' , unknown_value='<?>' , qualify=False , separator='' ) ¶ -
Same as Parameterized.pprint, except that X.classname(Y is replaced with X.classname.instance(Y
-
print_param_defaults( *args , **kwargs ) ¶ -
Inspect .param.print_param_defaults method for the full docstring
-
print_param_values( *args , **kwargs ) ¶ -
Inspect .param.print_param_values method for the full docstring
-
save= functools.partial(<function Renderer.save>, <class 'holoviews.plotting.mpl.renderer.MPLRenderer'>) 
-
script_repr( imports=[] , prefix=' ' ) ¶ -
Same as Parameterized.script_repr, except that X.classname(Y is replaced with X.classname.instance(Y
-
set_default( *args , **kwargs ) ¶ -
Inspect .param.set_default method for the full docstring
-
set_dynamic_time_fn= functools.partial(<function Parameters.deprecate.<locals>.inner>, <class 'holoviews.plotting.mpl.renderer.MPLRenderer'>) 
-
set_param= functools.partial(<function Parameters.deprecate.<locals>.inner>, <class 'holoviews.plotting.mpl.renderer.MPLRenderer'>) 
-
state_pop( ) ¶ -
Restore the most recently saved state.
See state_push() for more details.
-
state_push( ) ¶ -
Save this instance’s state.
For Parameterized instances, this includes the state of dynamically generated values.
Subclasses that maintain short-term state should additionally save and restore that state using state_push() and state_pop().
Generally, this method is used by operations that need to test something without permanently altering the objects’ state.
-
static_html( obj , fmt=None , template=None ) ¶ -
Generates a static HTML with the rendered object in the supplied format. Allows supplying a template formatting string with fields to interpolate ‘js’, ‘css’ and the main ‘html’.
-
validate( options ) ¶ -
Validate an options dictionary for the renderer.
-
verbose( *args , **kwargs ) ¶ -
Inspect .param.verbose method for the full docstring
-
warning( *args , **kwargs ) ¶ -
Inspect .param.warning method for the full docstring
-
param Callable
seaborn
Module
tabular
Module

-
class
holoviews.plotting.mpl.tabular.TablePlot( table , **params ) [source] ¶ -
Bases:
holoviews.plotting.mpl.element.ElementPlotA TablePlot can plot both TableViews and ViewMaps which display as either a single static table or as an animated table respectively.
-
param Parameter
fontsize( allow_None=True, constant=False, default=None, instantiate=False, pickle_default_value=True, precedence=None, readonly=False, watchers={} ) - Specifies various font sizes of the displayed text. Finer control is available by supplying a dictionary where any unmentioned keys revert to the default sizes, e.g: {‘ticks’:20, ‘title’:15, ‘ylabel’:5, ‘xlabel’:5, ‘zlabel’:5, ‘legend’:8, ‘legend_title’:13} You can set the font size of ‘zlabel’, ‘ylabel’ and ‘xlabel’ together using the ‘labels’ key.
-
param Boolean
show_title( allow_None=False, bounds=(0, 1), constant=False, default=True, instantiate=False, pickle_default_value=True, precedence=None, readonly=False, watchers={} ) - Whether to display the plot title.
-
param String
title( allow_None=False, basestring=<class ‘str’>, constant=False, default={label} {group} {dimensions}, instantiate=False, pickle_default_value=True, precedence=None, readonly=False, regex=None, watchers={} ) - The formatting string for the title of this plot, allows defining a label group separator and dimension labels.
-
param String
title_format( allow_None=True, basestring=<class ‘str’>, constant=False, default=None, instantiate=False, pickle_default_value=True, precedence=None, readonly=False, regex=None, watchers={} ) - Alias for title.
-
param Boolean
normalize( allow_None=False, bounds=(0, 1), constant=False, default=True, instantiate=False, pickle_default_value=True, precedence=None, readonly=False, watchers={} ) - Whether to compute ranges across all Elements at this level of plotting. Allows selecting normalization at different levels for nested data containers.
-
param Parameter
projection( allow_None=True, constant=False, default=None, instantiate=False, pickle_default_value=True, precedence=None, readonly=False, watchers={} ) - The projection of the plot axis, default of None is equivalent to 2D plot, ‘3d’ and ‘polar’ are also supported by matplotlib by default. May also supply a custom projection that is either a matplotlib projection type or implements the _as_mpl_axes method.
-
param Number
fig_alpha( allow_None=False, bounds=(0, 1), constant=False, default=1.0, inclusive_bounds=(True, True), instantiate=False, pickle_default_value=True, precedence=None, readonly=False, softbounds=None, time_dependent=False, time_fn=<Time Time00001>, watchers={} ) - Alpha of the overall figure background.
-
param NumericTuple
fig_bounds( allow_None=False, constant=False, default=(0.15, 0.15, 0.85, 0.85), instantiate=False, length=4, pickle_default_value=True, precedence=None, readonly=False, watchers={} ) - The bounds of the overall figure as a 4-tuple of the form (left, bottom, right, top), defining the size of the border around the subplots.
-
param Parameter
fig_inches( allow_None=False, constant=False, default=4, instantiate=False, pickle_default_value=True, precedence=None, readonly=False, watchers={} ) - The overall matplotlib figure size in inches. May be set as an integer in which case it will be used to autocompute a size. Alternatively may be set with an explicit tuple or list, in which case it will be applied directly after being scaled by fig_size. If either the width or height is set to None, it will be computed automatically.
-
param Boolean
fig_latex( allow_None=False, bounds=(0, 1), constant=False, default=False, instantiate=False, pickle_default_value=True, precedence=None, readonly=False, watchers={} ) - Whether to use LaTeX text in the overall figure.
-
param Dict
fig_rcparams( allow_None=False, constant=False, default={}, instantiate=True, is_instance=True, pickle_default_value=True, precedence=None, readonly=False, watchers={} ) - matplotlib rc parameters to apply to the overall figure.
-
param Number
fig_size( allow_None=False, bounds=(1, None), constant=False, default=100.0, inclusive_bounds=(True, True), instantiate=False, pickle_default_value=True, precedence=None, readonly=False, softbounds=None, time_dependent=False, time_fn=<Time Time00001>, watchers={} ) - Size relative to the supplied overall fig_inches in percent.
-
param HookList
initial_hooks( allow_None=False, bounds=(0, None), constant=False, default=[], instantiate=True, pickle_default_value=True, precedence=None, readonly=False, watchers={} ) - Optional list of hooks called before plotting the data onto the axis (now marked for deprecation). The hook is passed the plot object and the displayed object; other plotting handles can be accessed via plot.handles.
-
param HookList
finalize_hooks( allow_None=False, bounds=(0, None), constant=False, default=[], instantiate=True, pickle_default_value=True, precedence=None, readonly=False, watchers={} ) - Deprecated; use hooks options instead.
-
param HookList
hooks( allow_None=False, bounds=(0, None), constant=False, default=[], instantiate=True, pickle_default_value=True, precedence=None, readonly=False, watchers={} ) - Optional list of hooks called when finalizing a plot. The hook is passed the plot object and the displayed element, and other plotting handles can be accessed via plot.handles.
-
param String
sublabel_format( allow_None=True, basestring=<class ‘str’>, constant=False, default=None, instantiate=False, pickle_default_value=True, precedence=None, readonly=False, regex=None, watchers={} ) - Allows labeling the subaxes in each plot with various formatters including {Alpha}, {alpha}, {numeric} and {roman}.
-
param NumericTuple
sublabel_position( allow_None=False, constant=False, default=(-0.35, 0.85), instantiate=False, length=2, pickle_default_value=True, precedence=None, readonly=False, watchers={} ) - Position relative to the plot for placing the optional subfigure label.
-
param Number
sublabel_size( allow_None=False, bounds=None, constant=False, default=18, inclusive_bounds=(True, True), instantiate=False, pickle_default_value=True, precedence=None, readonly=False, softbounds=None, time_dependent=False, time_fn=<Time Time00001>, watchers={} ) - Size of optional subfigure label.
-
param Boolean
show_frame( allow_None=False, bounds=(0, 1), constant=False, default=False, instantiate=False, pickle_default_value=True, precedence=None, readonly=False, watchers={} ) - Whether or not to show a complete frame around the plot.
-
param Boolean
apply_ranges( allow_None=False, bounds=(0, 1), constant=False, default=True, instantiate=False, pickle_default_value=True, precedence=None, readonly=False, watchers={} ) - Whether to compute the plot bounds from the data itself.
-
param Boolean
apply_extents( allow_None=False, bounds=(0, 1), constant=False, default=True, instantiate=False, pickle_default_value=True, precedence=None, readonly=False, watchers={} ) - Whether to apply extent overrides on the Elements
-
param ClassSelector
bgcolor( allow_None=True, constant=False, default=None, instantiate=True, is_instance=True, pickle_default_value=True, precedence=None, readonly=False, watchers={} ) - If set bgcolor overrides the background color of the axis.
-
param ClassSelector
default_span( allow_None=False, constant=False, default=2.0, instantiate=True, is_instance=True, pickle_default_value=True, precedence=None, readonly=False, watchers={} ) - Defines the span of an axis if the axis range is zero, i.e. if the lower and upper end of an axis are equal or no range is defined at all. For example if there is a single datapoint at 0 a default_span of 2.0 will result in axis ranges spanning from -1 to 1.
-
param Boolean
invert_axes( allow_None=False, bounds=(0, 1), constant=False, default=False, instantiate=False, pickle_default_value=True, precedence=None, readonly=False, watchers={} ) - Whether to invert the x- and y-axis
-
param Boolean
invert_xaxis( allow_None=False, bounds=(0, 1), constant=False, default=False, instantiate=False, pickle_default_value=True, precedence=None, readonly=False, watchers={} ) - Whether to invert the plot x-axis.
-
param Boolean
invert_yaxis( allow_None=False, bounds=(0, 1), constant=False, default=False, instantiate=False, pickle_default_value=True, precedence=None, readonly=False, watchers={} ) - Whether to invert the plot y-axis.
-
param Boolean
logx( allow_None=False, bounds=(0, 1), constant=False, default=False, instantiate=False, pickle_default_value=True, precedence=None, readonly=False, watchers={} ) - Whether the x-axis of the plot will be a log axis.
-
param Boolean
logy( allow_None=False, bounds=(0, 1), constant=False, default=False, instantiate=False, pickle_default_value=True, precedence=None, readonly=False, watchers={} ) - Whether the y-axis of the plot will be a log axis.
-
param ClassSelector
padding( allow_None=False, constant=False, default=0, instantiate=True, is_instance=True, pickle_default_value=True, precedence=None, readonly=False, watchers={} ) - Fraction by which to increase auto-ranged extents to make datapoints more visible around borders. To compute padding, the axis whose screen size is largest is chosen, and the range of that axis is increased by the specified fraction along each axis. Other axes are then padded ensuring that the amount of screen space devoted to padding is equal for all axes. If specified as a tuple, the int or float values in the tuple will be used for padding in each axis, in order (x,y or x,y,z). For example, for padding=0.2 on a 800x800-pixel plot, an x-axis with the range [0,10] will be padded by 20% to be [-1,11], while a y-axis with a range [0,1000] will be padded to be [-100,1100], which should make the padding be approximately the same number of pixels. But if the same plot is changed to have a height of only 200, the y-range will then be [-400,1400] so that the y-axis padding will still match that of the x-axis. It is also possible to declare non-equal padding value for the lower and upper bound of an axis by supplying nested tuples, e.g. padding=(0.1, (0, 0.1)) will pad the x-axis lower and upper bound as well as the y-axis upper bound by a fraction of 0.1 while the y-axis lower bound is not padded at all.
-
param Boolean
show_legend( allow_None=False, bounds=(0, 1), constant=False, default=True, instantiate=False, pickle_default_value=True, precedence=None, readonly=False, watchers={} ) - Whether to show legend for the plot.
-
param Boolean
show_grid( allow_None=False, bounds=(0, 1), constant=False, default=False, instantiate=False, pickle_default_value=True, precedence=None, readonly=False, watchers={} ) - Whether to show a Cartesian grid on the plot.
-
param ObjectSelector
xaxis( allow_None=None, check_on_set=True, compute_default_fn=None, constant=False, default=bottom, instantiate=False, names=None, objects=[‘top’, ‘bottom’, ‘bare’, ‘top-bare’, ‘bottom-bare’, None, True, False], pickle_default_value=True, precedence=None, readonly=False, watchers={} ) - Whether and where to display the xaxis. The “bare” options allow suppressing all axis labels, including ticks and xlabel. Valid options are ‘top’, ‘bottom’, ‘bare’, ‘top-bare’ and ‘bottom-bare’.
-
param ObjectSelector
yaxis( allow_None=None, check_on_set=True, compute_default_fn=None, constant=False, default=left, instantiate=False, names=None, objects=[‘left’, ‘right’, ‘bare’, ‘left-bare’, ‘right-bare’, None, True, False], pickle_default_value=True, precedence=None, readonly=False, watchers={} ) - Whether and where to display the yaxis. The “bare” options allow suppressing all axis labels, including ticks and ylabel. Valid options are ‘left’, ‘right’, ‘bare’, ‘left-bare’ and ‘right-bare’.
-
param String
xlabel( allow_None=True, basestring=<class ‘str’>, constant=False, default=None, instantiate=False, pickle_default_value=True, precedence=None, readonly=False, regex=None, watchers={} ) - An explicit override of the x-axis label, if set takes precedence over the dimension label.
-
param String
ylabel( allow_None=True, basestring=<class ‘str’>, constant=False, default=None, instantiate=False, pickle_default_value=True, precedence=None, readonly=False, regex=None, watchers={} ) - An explicit override of the y-axis label, if set takes precedence over the dimension label.
-
param NumericTuple
xlim( allow_None=False, constant=False, default=(nan, nan), instantiate=False, length=2, pickle_default_value=True, precedence=None, readonly=False, watchers={} ) - User-specified x-axis range limits for the plot, as a tuple (low,high). If specified, takes precedence over data and dimension ranges.
-
param NumericTuple
ylim( allow_None=False, constant=False, default=(nan, nan), instantiate=False, length=2, pickle_default_value=True, precedence=None, readonly=False, watchers={} ) - User-specified x-axis range limits for the plot, as a tuple (low,high). If specified, takes precedence over data and dimension ranges.
-
param NumericTuple
zlim( allow_None=False, constant=False, default=(nan, nan), instantiate=False, length=2, pickle_default_value=True, precedence=None, readonly=False, watchers={} ) - User-specified z-axis range limits for the plot, as a tuple (low,high). If specified, takes precedence over data and dimension ranges.
-
param Integer
xrotation( allow_None=True, bounds=(0, 360), constant=False, default=None, inclusive_bounds=(True, True), instantiate=False, pickle_default_value=True, precedence=None, readonly=False, softbounds=None, time_dependent=False, time_fn=<Time Time00001>, watchers={} ) - Rotation angle of the xticks.
-
param Integer
yrotation( allow_None=True, bounds=(0, 360), constant=False, default=None, inclusive_bounds=(True, True), instantiate=False, pickle_default_value=True, precedence=None, readonly=False, softbounds=None, time_dependent=False, time_fn=<Time Time00001>, watchers={} ) - Rotation angle of the yticks.
-
param Parameter
xticks( allow_None=True, constant=False, default=None, instantiate=False, pickle_default_value=True, precedence=None, readonly=False, watchers={} ) - Ticks along x-axis specified as an integer, explicit list of tick locations, or bokeh Ticker object. If set to None default bokeh ticking behavior is applied.
-
param Parameter
yticks( allow_None=True, constant=False, default=None, instantiate=False, pickle_default_value=True, precedence=None, readonly=False, watchers={} ) - Ticks along y-axis specified as an integer, explicit list of tick locations, or bokeh Ticker object. If set to None default bokeh ticking behavior is applied.
-
param Boolean
apply_ticks( allow_None=False, bounds=(0, 1), constant=False, default=True, instantiate=False, pickle_default_value=True, precedence=None, readonly=False, watchers={} ) - Whether to apply custom ticks.
-
param Parameter
aspect( allow_None=False, constant=False, default=square, instantiate=False, pickle_default_value=True, precedence=None, readonly=False, watchers={} ) - The aspect ratio mode of the plot. By default, a plot may select its own appropriate aspect ratio but sometimes it may be necessary to force a square aspect ratio (e.g. to display the plot as an element of a grid). The modes ‘auto’ and ‘equal’ correspond to the axis modes of the same name in matplotlib, a numeric value may also be passed.
-
param Boolean
invert_zaxis( allow_None=False, bounds=(0, 1), constant=False, default=False, instantiate=False, pickle_default_value=True, precedence=None, readonly=False, watchers={} ) - Whether to invert the plot z-axis.
-
param List
labelled( allow_None=False, bounds=(0, None), constant=False, default=[‘x’, ‘y’], instantiate=True, pickle_default_value=True, precedence=None, readonly=False, watchers={} ) - Whether to plot the ‘x’ and ‘y’ labels.
-
param Boolean
logz( allow_None=False, bounds=(0, 1), constant=False, default=False, instantiate=False, pickle_default_value=True, precedence=None, readonly=False, watchers={} ) - Whether to apply log scaling to the y-axis of the Chart.
-
param ClassSelector
xformatter( allow_None=True, constant=False, default=None, instantiate=True, is_instance=True, pickle_default_value=True, precedence=None, readonly=False, watchers={} ) - Formatter for ticks along the x-axis.
-
param ClassSelector
yformatter( allow_None=True, constant=False, default=None, instantiate=True, is_instance=True, pickle_default_value=True, precedence=None, readonly=False, watchers={} ) - Formatter for ticks along the y-axis.
-
param ClassSelector
zformatter( allow_None=True, constant=False, default=None, instantiate=True, is_instance=True, pickle_default_value=True, precedence=None, readonly=False, watchers={} ) - Formatter for ticks along the z-axis.
-
param Boolean
zaxis( allow_None=False, bounds=(0, 1), constant=False, default=True, instantiate=False, pickle_default_value=True, precedence=None, readonly=False, watchers={} ) - Whether to display the z-axis.
-
param String
zlabel( allow_None=True, basestring=<class ‘str’>, constant=False, default=None, instantiate=False, pickle_default_value=True, precedence=None, readonly=False, regex=None, watchers={} ) - An explicit override of the z-axis label, if set takes precedence over the dimension label.
-
param Integer
zrotation( allow_None=False, bounds=(0, 360), constant=False, default=0, inclusive_bounds=(True, True), instantiate=False, pickle_default_value=True, precedence=None, readonly=False, softbounds=None, time_dependent=False, time_fn=<Time Time00001>, watchers={} ) - Rotation angle of the zticks.
-
param Parameter
zticks( allow_None=True, constant=False, default=None, instantiate=False, pickle_default_value=True, precedence=None, readonly=False, watchers={} ) - Ticks along z-axis specified as an integer, explicit list of tick locations, list of tuples containing the locations and labels or a matplotlib tick locator object. If set to None default matplotlib ticking behavior is applied.
-
param Number
border( allow_None=False, bounds=(0.0, 0.5), constant=False, default=0.05, inclusive_bounds=(True, True), instantiate=False, pickle_default_value=True, precedence=None, readonly=False, softbounds=None, time_dependent=False, time_fn=<Time Time00001>, watchers={} ) - The fraction of the plot that should be empty around the edges.
-
param Integer
float_precision( allow_None=False, bounds=None, constant=False, default=3, inclusive_bounds=(True, True), instantiate=False, pickle_default_value=True, precedence=None, readonly=False, softbounds=None, time_dependent=False, time_fn=<Time Time00001>, watchers={} ) - The floating point precision to use when printing float numeric data types.
-
param Integer
max_value_len( allow_None=False, bounds=None, constant=False, default=20, inclusive_bounds=(True, True), instantiate=False, pickle_default_value=True, precedence=None, readonly=False, softbounds=None, time_dependent=False, time_fn=<Time Time00001>, watchers={} ) - The maximum allowable string length of a value shown in any table cell. Any strings longer than this length will be truncated.
-
param Integer
max_font_size( allow_None=False, bounds=None, constant=False, default=12, inclusive_bounds=(True, True), instantiate=False, pickle_default_value=True, precedence=None, readonly=False, softbounds=None, time_dependent=False, time_fn=<Time Time00001>, watchers={} ) - The largest allowable font size for the text in each table cell.
-
param Integer
max_rows( allow_None=False, bounds=None, constant=False, default=15, inclusive_bounds=(True, True), instantiate=False, pickle_default_value=True, precedence=None, readonly=False, softbounds=None, time_dependent=False, time_fn=<Time Time00001>, watchers={} ) - The maximum number of Table rows before the table is summarized.
-
param Dict
font_types( allow_None=False, constant=False, default={‘heading’: <matplotlib.font_manager.FontProperties object at 0x1c311d9588>}, instantiate=True, is_instance=True, pickle_default_value=True, precedence=None, readonly=False, watchers={} ) - The font style used for heading labels used for emphasis.
-
anim( start=0 , stop=None , fps=30 ) ¶ -
Method to return a matplotlib animation. The start and stop frames may be specified as well as the fps.
-
cleanup( ) ¶ -
Cleans up references to the plot on the attached Stream subscribers.
-
compute_ranges( obj , key , ranges ) ¶ -
Given an object, a specific key, and the normalization options, this method will find the specified normalization options on the appropriate OptionTree, group the elements according to the selected normalization option (i.e. either per frame or over the whole animation) and finally compute the dimension ranges in each group. The new set of ranges is returned.
-
debug( *args , **kwargs ) ¶ -
Inspect .param.debug method for the full docstring
-
defaults( *args , **kwargs ) ¶ -
Inspect .param.defaults method for the full docstring
-
force_new_dynamic_value= functools.partial(<function Parameters.deprecate.<locals>.inner>, <class 'holoviews.plotting.mpl.tabular.TablePlot'>) 
-
get_aspect( xspan , yspan ) ¶ -
Computes the aspect ratio of the plot
-
get_extents( element , ranges , range_type='combined' , xdim=None , ydim=None , zdim=None ) ¶ -
Gets the extents for the axes from the current Element. The globally computed ranges can optionally override the extents.
The extents are computed by combining the data ranges, extents and dimension ranges. Each of these can be obtained individually by setting the range_type to one of:
- ‘data’: Just the data ranges
- ‘extents’: Element.extents
- ‘soft’: Dimension.soft_range values
- ‘hard’: Dimension.range values
To obtain the combined range, which includes range padding the default may be used:
- ‘combined’: All the range types combined and padding applied
This allows Overlay plots to obtain each range and combine them appropriately for all the objects in the overlay.
-
get_padding( extents ) ¶ -
Computes padding along the axes taking into account the plot aspect.
-
get_param_values= functools.partial(<function Parameters.deprecate.<locals>.inner>, <class 'holoviews.plotting.mpl.tabular.TablePlot'>) 
-
get_value_generator= functools.partial(<function Parameters.deprecate.<locals>.inner>, <class 'holoviews.plotting.mpl.tabular.TablePlot'>) 
-
get_zorder( overlay , key , el ) ¶ -
Computes the z-order of element in the NdOverlay taking into account possible batching of elements.
-
init_artists( ax , plot_args , plot_kwargs ) ¶ -
Initializes the artist based on the plot method declared on the plot.
-
init_comm( ) ¶ -
Initializes comm and attaches streams.
-
inspect_value= functools.partial(<function Parameters.deprecate.<locals>.inner>, <class 'holoviews.plotting.mpl.tabular.TablePlot'>) 
-
matches( spec ) ¶ -
Matches a specification against the current Plot.
-
message( *args , **kwargs ) ¶ -
Inspect .param.message method for the full docstring
-
params( *args , **kwargs ) ¶ -
Inspect .param.params method for the full docstring
-
pprint( imports=None , prefix=' ' , unknown_value='<?>' , qualify=False , separator='' ) ¶ -
(Experimental) Pretty printed representation that may be evaluated with eval. See pprint() function for more details.
-
print_param_defaults( *args , **kwargs ) ¶ -
Inspect .param.print_param_defaults method for the full docstring
-
print_param_values( *args , **kwargs ) ¶ -
Inspect .param.print_param_values method for the full docstring
-
push( ) ¶ -
Pushes updated plot data via the Comm.
-
refresh( **kwargs ) ¶ -
Refreshes the plot by rerendering it and then pushing the updated data if the plot has an associated Comm.
-
script_repr( imports=[] , prefix=' ' ) ¶ -
Variant of __repr__ designed for generating a runnable script.
-
set_default( *args , **kwargs ) ¶ -
Inspect .param.set_default method for the full docstring
-
set_dynamic_time_fn= functools.partial(<function Parameters.deprecate.<locals>.inner>, <class 'holoviews.plotting.mpl.tabular.TablePlot'>) 
-
set_param= functools.partial(<function Parameters.deprecate.<locals>.inner>, <class 'holoviews.plotting.mpl.tabular.TablePlot'>) 
-
state_pop( ) ¶ -
Restore the most recently saved state.
See state_push() for more details.
-
state_push( ) ¶ -
Save this instance’s state.
For Parameterized instances, this includes the state of dynamically generated values.
Subclasses that maintain short-term state should additionally save and restore that state using state_push() and state_pop().
Generally, this method is used by operations that need to test something without permanently altering the objects’ state.
-
teardown_handles( ) ¶ -
If no custom update_handles method is supplied this method is called to tear down any previous handles before replacing them.
-
traverse( fn=None , specs=None , full_breadth=True ) ¶ -
Traverses any nested DimensionedPlot returning a list of all plots that match the specs. The specs should be supplied as a list of either Plot types or callables, which should return a boolean given the plot class.
-
verbose( *args , **kwargs ) ¶ -
Inspect .param.verbose method for the full docstring
-
warning( *args , **kwargs ) ¶ -
Inspect .param.warning method for the full docstring
-
param Parameter
util
Module

-
class
holoviews.plotting.mpl.util.CFTimeConverter[source] ¶ -
Bases:
nc_time_axis.NetCDFTimeConverterDefines conversions for cftime types by extending nc_time_axis.
-
axisinfo( unit , axis ) ¶ -
Returns the
AxisInfofor unit .unit is a tzinfo instance or None. The axis argument is required but not used.
-
default_units( sample_point , axis ) ¶ -
Computes some units for the given data point.
-
is_numlike( x ) ¶ -
The Matplotlib datalim, autoscaling, locators etc work with scalars which are the units converted to floats given the current unit. The converter may be passed these floats, or arrays of them, even when units are set.
-
-
holoviews.plotting.mpl.util.axis_overlap( ax1 , ax2 ) [source] ¶ -
Tests whether two axes overlap vertically
-
holoviews.plotting.mpl.util.filter_styles( style , group , other_groups , blacklist=[] ) [source] ¶ -
Filters styles which are specific to a particular artist, e.g. for a GraphPlot this will filter options specific to the nodes and edges.
- style: dict
- Dictionary of styles and values
- group: str
- Group within the styles to filter for
- other_groups: list
- Other groups to filter out
- blacklist: list (optional)
- List of options to filter out
- filtered: dict
- Filtered dictionary of styles
-
holoviews.plotting.mpl.util.fix_aspect( fig , nrows , ncols , title=None , extra_artists=[] , vspace=0.2 , hspace=0.2 ) [source] ¶ -
Calculate heights and widths of axes and adjust the size of the figure to match the aspect.
-
holoviews.plotting.mpl.util.get_raster_array( image ) [source] ¶ -
Return the array data from any Raster or Image type
-
holoviews.plotting.mpl.util.get_tight_bbox( fig , bbox_extra_artists=[] , pad=None ) [source] ¶ -
Compute a tight bounding box around all the artists in the figure.
-
holoviews.plotting.mpl.util.is_color( color ) [source] ¶ -
Checks if supplied object is a valid color spec.
-
holoviews.plotting.mpl.util.polygons_to_path_patches( element ) [source] ¶ -
Converts Polygons into list of lists of matplotlib.patches.PathPatch objects including any specified holes. Each list represents one (multi-)polygon.
-
holoviews.plotting.mpl.util.resolve_rows( rows ) [source] ¶ -
Recursively iterate over lists of axes merging them by their vertical overlap leaving a list of rows.
-
holoviews.plotting.mpl.util.ring_coding( array ) [source] ¶ -
Produces matplotlib Path codes for exterior and interior rings of a polygon geometry.
-
holoviews.plotting.mpl.util.validate( style , value , vectorized=True ) [source] ¶ -
Validates a style and associated value.
- style: str
- The style to validate (e.g. ‘color’, ‘size’ or ‘marker’)
- value:
- The style value to validate
- vectorized: bool
- Whether validator should allow vectorized setting
- valid: boolean or None
- If validation is supported returns boolean, otherwise None