holoviews.bokeh Package 
bokeh
Package
annotation
Module
-
class
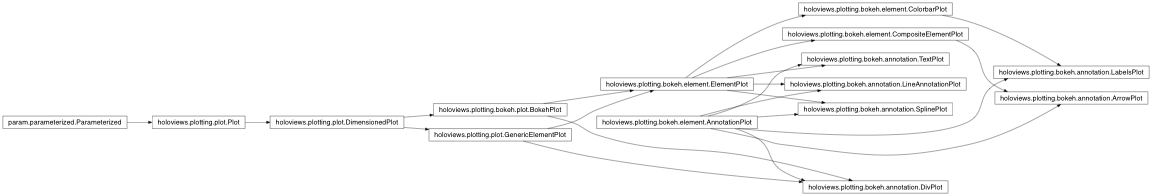
holoviews.plotting.bokeh.annotation.SplinePlot( element , plot=None , **params ) [source] ¶ -
Bases:
holoviews.plotting.bokeh.element.ElementPlot,holoviews.plotting.bokeh.element.AnnotationPlotDraw the supplied Spline annotation (see Spline docstring). Does not support matplotlib Path codes.
-
param Parameter
fontsize( allow_None=True, constant=False, default={‘title’: ‘12pt’}, instantiate=False, pickle_default_value=True, precedence=None, readonly=False, watchers={} ) - Specifies various fontsizes of the displayed text. Finer control is available by supplying a dictionary where any unmentioned keys reverts to the default sizes, e.g: {‘ticks’: ‘20pt’, ‘title’: ‘15pt’, ‘ylabel’: ‘5px’, ‘xlabel’: ‘5px’}
-
param Boolean
show_title( allow_None=False, bounds=(0, 1), constant=False, default=True, instantiate=False, pickle_default_value=True, precedence=None, readonly=False, watchers={} ) - Whether to display the plot title.
-
param String
title( allow_None=False, basestring=<class ‘str’>, constant=False, default={label} {group} {dimensions}, instantiate=False, pickle_default_value=True, precedence=None, readonly=False, regex=None, watchers={} ) - The formatting string for the title of this plot, allows defining a label group separator and dimension labels.
-
param String
title_format( allow_None=True, basestring=<class ‘str’>, constant=False, default=None, instantiate=False, pickle_default_value=True, precedence=None, readonly=False, regex=None, watchers={} ) - Alias for title.
-
param Boolean
normalize( allow_None=False, bounds=(0, 1), constant=False, default=True, instantiate=False, pickle_default_value=True, precedence=None, readonly=False, watchers={} ) - Whether to compute ranges across all Elements at this level of plotting. Allows selecting normalization at different levels for nested data containers.
-
param Parameter
projection( allow_None=True, constant=False, default=None, instantiate=False, pickle_default_value=True, precedence=None, readonly=False, watchers={} ) - Allows supplying a custom projection to transform the axis coordinates during display. Example projections include ‘3d’ and ‘polar’ projections supported by some backends. Depending on the backend custom, projection objects may be supplied.
-
param Boolean
apply_ranges( allow_None=False, bounds=(0, 1), constant=False, default=True, instantiate=False, pickle_default_value=True, precedence=None, readonly=False, watchers={} ) - Whether to compute the plot bounds from the data itself.
-
param Boolean
apply_extents( allow_None=False, bounds=(0, 1), constant=False, default=True, instantiate=False, pickle_default_value=True, precedence=None, readonly=False, watchers={} ) - Whether to apply extent overrides on the Elements
-
param ClassSelector
bgcolor( allow_None=True, constant=False, default=None, instantiate=True, is_instance=True, pickle_default_value=True, precedence=None, readonly=False, watchers={} ) - If set bgcolor overrides the background color of the axis.
-
param ClassSelector
default_span( allow_None=False, constant=False, default=2.0, instantiate=True, is_instance=True, pickle_default_value=True, precedence=None, readonly=False, watchers={} ) - Defines the span of an axis if the axis range is zero, i.e. if the lower and upper end of an axis are equal or no range is defined at all. For example if there is a single datapoint at 0 a default_span of 2.0 will result in axis ranges spanning from -1 to 1.
-
param Boolean
invert_axes( allow_None=False, bounds=(0, 1), constant=False, default=False, instantiate=False, pickle_default_value=True, precedence=None, readonly=False, watchers={} ) - Whether to invert the x- and y-axis
-
param Boolean
invert_xaxis( allow_None=False, bounds=(0, 1), constant=False, default=False, instantiate=False, pickle_default_value=True, precedence=None, readonly=False, watchers={} ) - Whether to invert the plot x-axis.
-
param Boolean
invert_yaxis( allow_None=False, bounds=(0, 1), constant=False, default=False, instantiate=False, pickle_default_value=True, precedence=None, readonly=False, watchers={} ) - Whether to invert the plot y-axis.
-
param Boolean
logx( allow_None=False, bounds=(0, 1), constant=False, default=False, instantiate=False, pickle_default_value=True, precedence=None, readonly=False, watchers={} ) - Whether the x-axis of the plot will be a log axis.
-
param Boolean
logy( allow_None=False, bounds=(0, 1), constant=False, default=False, instantiate=False, pickle_default_value=True, precedence=None, readonly=False, watchers={} ) - Whether the y-axis of the plot will be a log axis.
-
param ClassSelector
padding( allow_None=False, constant=False, default=0, instantiate=True, is_instance=True, pickle_default_value=True, precedence=None, readonly=False, watchers={} ) - Fraction by which to increase auto-ranged extents to make datapoints more visible around borders. To compute padding, the axis whose screen size is largest is chosen, and the range of that axis is increased by the specified fraction along each axis. Other axes are then padded ensuring that the amount of screen space devoted to padding is equal for all axes. If specified as a tuple, the int or float values in the tuple will be used for padding in each axis, in order (x,y or x,y,z). For example, for padding=0.2 on a 800x800-pixel plot, an x-axis with the range [0,10] will be padded by 20% to be [-1,11], while a y-axis with a range [0,1000] will be padded to be [-100,1100], which should make the padding be approximately the same number of pixels. But if the same plot is changed to have a height of only 200, the y-range will then be [-400,1400] so that the y-axis padding will still match that of the x-axis. It is also possible to declare non-equal padding value for the lower and upper bound of an axis by supplying nested tuples, e.g. padding=(0.1, (0, 0.1)) will pad the x-axis lower and upper bound as well as the y-axis upper bound by a fraction of 0.1 while the y-axis lower bound is not padded at all.
-
param Boolean
show_legend( allow_None=False, bounds=(0, 1), constant=False, default=True, instantiate=False, pickle_default_value=True, precedence=None, readonly=False, watchers={} ) - Whether to show legend for the plot.
-
param Boolean
show_grid( allow_None=False, bounds=(0, 1), constant=False, default=False, instantiate=False, pickle_default_value=True, precedence=None, readonly=False, watchers={} ) - Whether to show a Cartesian grid on the plot.
-
param ObjectSelector
xaxis( allow_None=None, check_on_set=True, compute_default_fn=None, constant=False, default=bottom, instantiate=False, names=None, objects=[‘top’, ‘bottom’, ‘bare’, ‘top-bare’, ‘bottom-bare’, None, True, False], pickle_default_value=True, precedence=None, readonly=False, watchers={} ) - Whether and where to display the xaxis. The “bare” options allow suppressing all axis labels, including ticks and xlabel. Valid options are ‘top’, ‘bottom’, ‘bare’, ‘top-bare’ and ‘bottom-bare’.
-
param ObjectSelector
yaxis( allow_None=None, check_on_set=True, compute_default_fn=None, constant=False, default=left, instantiate=False, names=None, objects=[‘left’, ‘right’, ‘bare’, ‘left-bare’, ‘right-bare’, None, True, False], pickle_default_value=True, precedence=None, readonly=False, watchers={} ) - Whether and where to display the yaxis. The “bare” options allow suppressing all axis labels, including ticks and ylabel. Valid options are ‘left’, ‘right’, ‘bare’, ‘left-bare’ and ‘right-bare’.
-
param String
xlabel( allow_None=True, basestring=<class ‘str’>, constant=False, default=None, instantiate=False, pickle_default_value=True, precedence=None, readonly=False, regex=None, watchers={} ) - An explicit override of the x-axis label, if set takes precedence over the dimension label.
-
param String
ylabel( allow_None=True, basestring=<class ‘str’>, constant=False, default=None, instantiate=False, pickle_default_value=True, precedence=None, readonly=False, regex=None, watchers={} ) - An explicit override of the y-axis label, if set takes precedence over the dimension label.
-
param NumericTuple
xlim( allow_None=False, constant=False, default=(nan, nan), instantiate=False, length=2, pickle_default_value=True, precedence=None, readonly=False, watchers={} ) - User-specified x-axis range limits for the plot, as a tuple (low,high). If specified, takes precedence over data and dimension ranges.
-
param NumericTuple
ylim( allow_None=False, constant=False, default=(nan, nan), instantiate=False, length=2, pickle_default_value=True, precedence=None, readonly=False, watchers={} ) - User-specified x-axis range limits for the plot, as a tuple (low,high). If specified, takes precedence over data and dimension ranges.
-
param NumericTuple
zlim( allow_None=False, constant=False, default=(nan, nan), instantiate=False, length=2, pickle_default_value=True, precedence=None, readonly=False, watchers={} ) - User-specified z-axis range limits for the plot, as a tuple (low,high). If specified, takes precedence over data and dimension ranges.
-
param Integer
xrotation( allow_None=True, bounds=(0, 360), constant=False, default=None, inclusive_bounds=(True, True), instantiate=False, pickle_default_value=True, precedence=None, readonly=False, softbounds=None, time_dependent=False, time_fn=<Time Time00001>, watchers={} ) - Rotation angle of the xticks.
-
param Integer
yrotation( allow_None=True, bounds=(0, 360), constant=False, default=None, inclusive_bounds=(True, True), instantiate=False, pickle_default_value=True, precedence=None, readonly=False, softbounds=None, time_dependent=False, time_fn=<Time Time00001>, watchers={} ) - Rotation angle of the yticks.
-
param Parameter
xticks( allow_None=True, constant=False, default=None, instantiate=False, pickle_default_value=True, precedence=None, readonly=False, watchers={} ) - Ticks along x-axis specified as an integer, explicit list of tick locations, or bokeh Ticker object. If set to None default bokeh ticking behavior is applied.
-
param Parameter
yticks( allow_None=True, constant=False, default=None, instantiate=False, pickle_default_value=True, precedence=None, readonly=False, watchers={} ) - Ticks along y-axis specified as an integer, explicit list of tick locations, or bokeh Ticker object. If set to None default bokeh ticking behavior is applied.
-
param Integer
width( allow_None=False, bounds=None, constant=False, default=300, inclusive_bounds=(True, True), instantiate=False, pickle_default_value=True, precedence=None, readonly=False, softbounds=None, time_dependent=False, time_fn=<Time Time00001>, watchers={} ) - Width of the plot in pixels
-
param Integer
height( allow_None=False, bounds=None, constant=False, default=300, inclusive_bounds=(True, True), instantiate=False, pickle_default_value=True, precedence=None, readonly=False, softbounds=None, time_dependent=False, time_fn=<Time Time00001>, watchers={} ) - Height of the plot in pixels
-
param ObjectSelector
sizing_mode( allow_None=None, check_on_set=True, compute_default_fn=None, constant=False, default=fixed, instantiate=False, names=None, objects=[‘fixed’, ‘stretch_both’, ‘scale_width’, ‘scale_height’, ‘scale_both’], pickle_default_value=True, precedence=None, readonly=False, watchers={} ) - How the item being displayed should size itself. “stretch_both” plots will resize to occupy all available space, even if this changes the aspect ratio of the element. “fixed” plots are not responsive and will retain their original width and height regardless of any subsequent browser window resize events. “scale_width” elements will responsively resize to fit to the width available, while maintaining the original aspect ratio. “scale_height” elements will responsively resize to fit to the height available, while maintaining the original aspect ratio. “scale_both” elements will responsively resize to for both the width and height available, while maintaining the original aspect ratio.
-
param Boolean
shared_datasource( allow_None=False, bounds=(0, 1), constant=False, default=True, instantiate=False, pickle_default_value=True, precedence=None, readonly=False, watchers={} ) - Whether Elements drawing the data from the same object should share their Bokeh data source allowing for linked brushing and other linked behaviors.
-
param ObjectSelector
toolbar( allow_None=None, check_on_set=True, compute_default_fn=None, constant=False, default=right, instantiate=False, names=None, objects=[‘above’, ‘below’, ‘left’, ‘right’, ‘disable’, None], pickle_default_value=True, precedence=None, readonly=False, watchers={} ) - The toolbar location, must be one of ‘above’, ‘below’, ‘left’, ‘right’, None.
-
param List
active_tools( allow_None=False, bounds=(0, None), constant=False, default=[], instantiate=True, pickle_default_value=True, precedence=None, readonly=False, watchers={} ) - Allows specifying which tools are active by default. Note that only one tool per gesture type can be active, e.g. both ‘pan’ and ‘box_zoom’ are drag tools, so if both are listed only the last one will be active.
-
param Number
border( allow_None=False, bounds=None, constant=False, default=10, inclusive_bounds=(True, True), instantiate=False, pickle_default_value=True, precedence=None, readonly=False, softbounds=None, time_dependent=False, time_fn=<Time Time00001>, watchers={} ) - Minimum border around plot.
-
param HookList
finalize_hooks( allow_None=False, bounds=(0, None), constant=False, default=[], instantiate=True, pickle_default_value=True, precedence=None, readonly=False, watchers={} ) - Deprecated; use hooks options instead.
-
param HookList
hooks( allow_None=False, bounds=(0, None), constant=False, default=[], instantiate=True, pickle_default_value=True, precedence=None, readonly=False, watchers={} ) - Optional list of hooks called when finalizing a plot. The hook is passed the plot object and the displayed element, and other plotting handles can be accessed via plot.handles.
-
param Dict
gridstyle( allow_None=False, constant=False, default={}, instantiate=True, is_instance=True, pickle_default_value=True, precedence=None, readonly=False, watchers={} ) - Allows customizing the grid style, e.g. grid_line_color defines the line color for both grids while xgrid_line_color exclusively customizes the x-axis grid lines.
-
param List
labelled( allow_None=False, bounds=(0, None), constant=False, default=[‘x’, ‘y’], instantiate=True, pickle_default_value=True, precedence=None, readonly=False, watchers={} ) - Whether to plot the ‘x’ and ‘y’ labels.
-
param Dict
lod( allow_None=False, constant=False, default={‘factor’: 10, ‘interval’: 300, ‘threshold’: 2000, ‘timeout’: 500}, instantiate=True, is_instance=True, pickle_default_value=True, precedence=None, readonly=False, watchers={} ) - Bokeh plots offer “Level of Detail” (LOD) capability to accommodate large (but not huge) amounts of data. The available options are: * factor - Decimation factor to use when applying decimation. * interval - Interval (in ms) downsampling will be enabled after an interactive event. * threshold - Number of samples before downsampling is enabled. * timeout - Timeout (in ms) for checking whether interactive tool events are still occurring.
-
param Boolean
show_frame( allow_None=False, bounds=(0, 1), constant=False, default=True, instantiate=False, pickle_default_value=True, precedence=None, readonly=False, watchers={} ) - Whether or not to show a complete frame around the plot.
-
param Boolean
shared_axes( allow_None=False, bounds=(0, 1), constant=False, default=True, instantiate=False, pickle_default_value=True, precedence=None, readonly=False, watchers={} ) - Whether to invert the share axes across plots for linked panning and zooming.
-
param List
default_tools( allow_None=False, bounds=(0, None), constant=False, default=[‘save’, ‘pan’, ‘wheel_zoom’, ‘box_zoom’, ‘reset’], instantiate=True, pickle_default_value=True, precedence=None, readonly=False, watchers={} ) - A list of plugin tools to use on the plot.
-
param List
tools( allow_None=False, bounds=(0, None), constant=False, default=[], instantiate=True, pickle_default_value=True, precedence=None, readonly=False, watchers={} ) - A list of plugin tools to use on the plot.
-
param ClassSelector
xformatter( allow_None=True, constant=False, default=None, instantiate=True, is_instance=True, pickle_default_value=True, precedence=None, readonly=False, watchers={} ) - Formatter for ticks along the x-axis.
-
param ClassSelector
yformatter( allow_None=True, constant=False, default=None, instantiate=True, is_instance=True, pickle_default_value=True, precedence=None, readonly=False, watchers={} ) - Formatter for ticks along the x-axis.
-
cleanup( ) ¶ -
Cleans up references to the plot after the plot has been deleted. Traverses through all plots cleaning up Callbacks and Stream subscribers.
-
compute_ranges( obj , key , ranges ) ¶ -
Given an object, a specific key, and the normalization options, this method will find the specified normalization options on the appropriate OptionTree, group the elements according to the selected normalization option (i.e. either per frame or over the whole animation) and finally compute the dimension ranges in each group. The new set of ranges is returned.
-
current_handles¶ -
Should return a list of plot objects that have changed and should be updated.
-
debug( *args , **kwargs ) ¶ -
Inspect .param.debug method for the full docstring
-
defaults( *args , **kwargs ) ¶ -
Inspect .param.defaults method for the full docstring
-
force_new_dynamic_value= functools.partial(<function Parameters.deprecate.<locals>.inner>, <class 'holoviews.plotting.bokeh.annotation.SplinePlot'>) 
-
framewise¶ -
Property to determine whether the current frame should have framewise normalization enabled. Required for bokeh plotting classes to determine whether to send updated ranges for each frame.
-
get_aspect( xspan , yspan ) ¶ -
Computes the aspect ratio of the plot
-
get_extents( element , ranges , range_type='combined' , xdim=None , ydim=None , zdim=None ) ¶ -
Gets the extents for the axes from the current Element. The globally computed ranges can optionally override the extents.
The extents are computed by combining the data ranges, extents and dimension ranges. Each of these can be obtained individually by setting the range_type to one of:
- ‘data’: Just the data ranges
- ‘extents’: Element.extents
- ‘soft’: Dimension.soft_range values
- ‘hard’: Dimension.range values
To obtain the combined range, which includes range padding the default may be used:
- ‘combined’: All the range types combined and padding applied
This allows Overlay plots to obtain each range and combine them appropriately for all the objects in the overlay.
-
get_padding( extents ) ¶ -
Computes padding along the axes taking into account the plot aspect.
-
get_param_values= functools.partial(<function Parameters.deprecate.<locals>.inner>, <class 'holoviews.plotting.bokeh.annotation.SplinePlot'>) 
-
get_value_generator= functools.partial(<function Parameters.deprecate.<locals>.inner>, <class 'holoviews.plotting.bokeh.annotation.SplinePlot'>) 
-
get_zorder( overlay , key , el ) ¶ -
Computes the z-order of element in the NdOverlay taking into account possible batching of elements.
-
init_comm( ) ¶ -
Initializes comm and attaches streams.
-
initialize_plot( ranges=None , plot=None , plots=None , source=None ) ¶ -
Initializes a new plot object with the last available frame.
-
inspect_value= functools.partial(<function Parameters.deprecate.<locals>.inner>, <class 'holoviews.plotting.bokeh.annotation.SplinePlot'>) 
-
link_sources¶ -
Returns potential Link or Stream sources.
-
matches( spec ) ¶ -
Matches a specification against the current Plot.
-
message( *args , **kwargs ) ¶ -
Inspect .param.message method for the full docstring
-
model_changed( model ) ¶ -
Determines if the bokeh model was just changed on the frontend. Useful to suppress boomeranging events, e.g. when the frontend just sent an update to the x_range this should not trigger an update on the backend.
-
params( *args , **kwargs ) ¶ -
Inspect .param.params method for the full docstring
-
pprint( imports=None , prefix=' ' , unknown_value='<?>' , qualify=False , separator='' ) ¶ -
(Experimental) Pretty printed representation that may be evaluated with eval. See pprint() function for more details.
-
print_param_defaults( *args , **kwargs ) ¶ -
Inspect .param.print_param_defaults method for the full docstring
-
print_param_values( *args , **kwargs ) ¶ -
Inspect .param.print_param_values method for the full docstring
-
push( ) ¶ -
Pushes updated plot data via the Comm.
-
refresh( **kwargs ) ¶ -
Refreshes the plot by rerendering it and then pushing the updated data if the plot has an associated Comm.
-
script_repr( imports=[] , prefix=' ' ) ¶ -
Variant of __repr__ designed for generating a runnable script.
-
set_default( *args , **kwargs ) ¶ -
Inspect .param.set_default method for the full docstring
-
set_dynamic_time_fn= functools.partial(<function Parameters.deprecate.<locals>.inner>, <class 'holoviews.plotting.bokeh.annotation.SplinePlot'>) 
-
set_param= functools.partial(<function Parameters.deprecate.<locals>.inner>, <class 'holoviews.plotting.bokeh.annotation.SplinePlot'>) 
-
set_root( root ) ¶ -
Sets the root model on all subplots.
-
state¶ -
The plotting state that gets updated via the update method and used by the renderer to generate output.
-
state_pop( ) ¶ -
Restore the most recently saved state.
See state_push() for more details.
-
state_push( ) ¶ -
Save this instance’s state.
For Parameterized instances, this includes the state of dynamically generated values.
Subclasses that maintain short-term state should additionally save and restore that state using state_push() and state_pop().
Generally, this method is used by operations that need to test something without permanently altering the objects’ state.
-
sync_sources( ) ¶ -
Syncs data sources between Elements, which draw data from the same object.
-
traverse( fn=None , specs=None , full_breadth=True ) ¶ -
Traverses any nested DimensionedPlot returning a list of all plots that match the specs. The specs should be supplied as a list of either Plot types or callables, which should return a boolean given the plot class.
-
update_frame( key , ranges=None , plot=None , element=None ) ¶ -
Updates an existing plot with data corresponding to the key.
-
verbose( *args , **kwargs ) ¶ -
Inspect .param.verbose method for the full docstring
-
warning( *args , **kwargs ) ¶ -
Inspect .param.warning method for the full docstring
-
param Parameter
bkcharts
Module
callbacks
Module
-
class
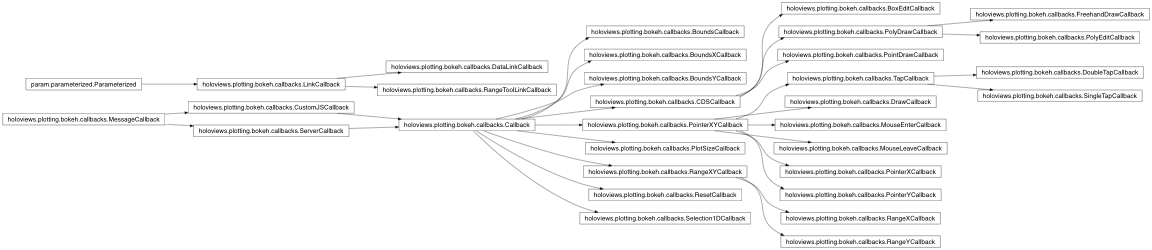
holoviews.plotting.bokeh.callbacks.BoundsCallback( plot , streams , source , **params ) [source] ¶ -
Bases:
holoviews.plotting.bokeh.callbacks.CallbackReturns the bounds of a box_select tool.
-
attributes_js( attributes ) ¶ -
Generates JS code to look up attributes on JS objects from an attributes specification dictionary. If the specification references a plotting particular plotting handle it will also generate JS code to get the ID of the object.
Simple example (when referencing cb_data or cb_obj):
Input : {‘x’: ‘cb_data.geometry.x’}
Output : data[‘x’] = cb_data[‘geometry’][‘x’]
Example referencing plot handle:
Input : {‘x0’: ‘x_range.attributes.start’}
- Output : if ((x_range !== undefined)) {
-
data[‘x0’] = {id: x_range[‘id’], value: x_range[‘attributes’][‘start’]}
}
-
get_customjs( references , plot_id=None ) ¶ -
Creates a CustomJS callback that will send the requested attributes back to python.
-
on_change( attr , old , new ) ¶ -
Process change events adding timeout to process multiple concerted value change at once rather than firing off multiple plot updates.
-
on_event( event ) ¶ -
Process bokeh UIEvents adding timeout to process multiple concerted value change at once rather than firing off multiple plot updates.
-
process_on_event( ) ¶ -
Trigger callback change event and triggering corresponding streams.
-
resolve_attr_spec( spec , cb_obj , model=None ) ¶ -
Resolves a Callback attribute specification looking the corresponding attribute up on the cb_obj, which should be a bokeh model. If not model is supplied cb_obj is assumed to be the same as the model.
-
set_customjs_callback( js_callback , handle ) ¶ -
Generates a CustomJS callback by generating the required JS code and gathering all plotting handles and installs it on the requested callback handle.
-
set_server_callback( handle ) ¶ -
Set up on_change events for bokeh server interactions.
-
-
class
holoviews.plotting.bokeh.callbacks.BoundsXCallback( plot , streams , source , **params ) [source] ¶ -
Bases:
holoviews.plotting.bokeh.callbacks.CallbackReturns the bounds of a xbox_select tool.
-
attributes_js( attributes ) ¶ -
Generates JS code to look up attributes on JS objects from an attributes specification dictionary. If the specification references a plotting particular plotting handle it will also generate JS code to get the ID of the object.
Simple example (when referencing cb_data or cb_obj):
Input : {‘x’: ‘cb_data.geometry.x’}
Output : data[‘x’] = cb_data[‘geometry’][‘x’]
Example referencing plot handle:
Input : {‘x0’: ‘x_range.attributes.start’}
- Output : if ((x_range !== undefined)) {
-
data[‘x0’] = {id: x_range[‘id’], value: x_range[‘attributes’][‘start’]}
}
-
get_customjs( references , plot_id=None ) ¶ -
Creates a CustomJS callback that will send the requested attributes back to python.
-
on_change( attr , old , new ) ¶ -
Process change events adding timeout to process multiple concerted value change at once rather than firing off multiple plot updates.
-
on_event( event ) ¶ -
Process bokeh UIEvents adding timeout to process multiple concerted value change at once rather than firing off multiple plot updates.
-
process_on_event( ) ¶ -
Trigger callback change event and triggering corresponding streams.
-
resolve_attr_spec( spec , cb_obj , model=None ) ¶ -
Resolves a Callback attribute specification looking the corresponding attribute up on the cb_obj, which should be a bokeh model. If not model is supplied cb_obj is assumed to be the same as the model.
-
set_customjs_callback( js_callback , handle ) ¶ -
Generates a CustomJS callback by generating the required JS code and gathering all plotting handles and installs it on the requested callback handle.
-
set_server_callback( handle ) ¶ -
Set up on_change events for bokeh server interactions.
-
-
class
holoviews.plotting.bokeh.callbacks.BoundsYCallback( plot , streams , source , **params ) [source] ¶ -
Bases:
holoviews.plotting.bokeh.callbacks.CallbackReturns the bounds of a ybox_select tool.
-
attributes_js( attributes ) ¶ -
Generates JS code to look up attributes on JS objects from an attributes specification dictionary. If the specification references a plotting particular plotting handle it will also generate JS code to get the ID of the object.
Simple example (when referencing cb_data or cb_obj):
Input : {‘x’: ‘cb_data.geometry.x’}
Output : data[‘x’] = cb_data[‘geometry’][‘x’]
Example referencing plot handle:
Input : {‘x0’: ‘x_range.attributes.start’}
- Output : if ((x_range !== undefined)) {
-
data[‘x0’] = {id: x_range[‘id’], value: x_range[‘attributes’][‘start’]}
}
-
get_customjs( references , plot_id=None ) ¶ -
Creates a CustomJS callback that will send the requested attributes back to python.
-
on_change( attr , old , new ) ¶ -
Process change events adding timeout to process multiple concerted value change at once rather than firing off multiple plot updates.
-
on_event( event ) ¶ -
Process bokeh UIEvents adding timeout to process multiple concerted value change at once rather than firing off multiple plot updates.
-
process_on_event( ) ¶ -
Trigger callback change event and triggering corresponding streams.
-
resolve_attr_spec( spec , cb_obj , model=None ) ¶ -
Resolves a Callback attribute specification looking the corresponding attribute up on the cb_obj, which should be a bokeh model. If not model is supplied cb_obj is assumed to be the same as the model.
-
set_customjs_callback( js_callback , handle ) ¶ -
Generates a CustomJS callback by generating the required JS code and gathering all plotting handles and installs it on the requested callback handle.
-
set_server_callback( handle ) ¶ -
Set up on_change events for bokeh server interactions.
-
-
class
holoviews.plotting.bokeh.callbacks.CDSCallback( plot , streams , source , **params ) [source] ¶ -
Bases:
holoviews.plotting.bokeh.callbacks.CallbackA Stream callback that syncs the data on a bokeh ColumnDataSource model with Python.
-
attributes_js( attributes ) ¶ -
Generates JS code to look up attributes on JS objects from an attributes specification dictionary. If the specification references a plotting particular plotting handle it will also generate JS code to get the ID of the object.
Simple example (when referencing cb_data or cb_obj):
Input : {‘x’: ‘cb_data.geometry.x’}
Output : data[‘x’] = cb_data[‘geometry’][‘x’]
Example referencing plot handle:
Input : {‘x0’: ‘x_range.attributes.start’}
- Output : if ((x_range !== undefined)) {
-
data[‘x0’] = {id: x_range[‘id’], value: x_range[‘attributes’][‘start’]}
}
-
get_customjs( references , plot_id=None ) ¶ -
Creates a CustomJS callback that will send the requested attributes back to python.
-
on_change( attr , old , new ) ¶ -
Process change events adding timeout to process multiple concerted value change at once rather than firing off multiple plot updates.
-
on_event( event ) ¶ -
Process bokeh UIEvents adding timeout to process multiple concerted value change at once rather than firing off multiple plot updates.
-
process_on_event( ) ¶ -
Trigger callback change event and triggering corresponding streams.
-
resolve_attr_spec( spec , cb_obj , model=None ) ¶ -
Resolves a Callback attribute specification looking the corresponding attribute up on the cb_obj, which should be a bokeh model. If not model is supplied cb_obj is assumed to be the same as the model.
-
set_customjs_callback( js_callback , handle ) ¶ -
Generates a CustomJS callback by generating the required JS code and gathering all plotting handles and installs it on the requested callback handle.
-
set_server_callback( handle ) ¶ -
Set up on_change events for bokeh server interactions.
-
-
class
holoviews.plotting.bokeh.callbacks.Callback( plot , streams , source , **params ) [source] ¶ -
Bases:
holoviews.plotting.bokeh.callbacks.CustomJSCallback,holoviews.plotting.bokeh.callbacks.ServerCallbackProvides a baseclass to define callbacks, which return data from bokeh model callbacks, events and attribute changes. The callback then makes this data available to any streams attached to it.
The definition of a callback consists of a number of components:
-
- models : Defines which bokeh models the callback will be
- attached on referencing the model by its key in the plots handles, e.g. this could be the x_range, y_range, plot, a plotting tool or any other bokeh mode.
-
- extra_models: Any additional models available in handles which
- should be made available in the namespace of the objects, e.g. to make a tool available to skip checks.
-
- attributes : The attributes define which attributes to send
- back to Python. They are defined as a dictionary mapping between the name under which the variable is made available to Python and the specification of the attribute. The specification should start with the variable name that is to be accessed and the location of the attribute separated by periods. All models defined by the models and extra_models attributes can be addressed in this way, e.g. to get the start of the x_range as ‘x’ you can supply {‘x’: ‘x_range.attributes.start’}. Additionally certain handles additionally make the cb_data and cb_obj variables available containing additional information about the event.
-
- skip : Conditions when the Callback should be skipped
- specified as a list of valid JS expressions, which can reference models requested by the callback, e.g. [‘pan.attributes.active’] would skip the callback if the pan tool is active.
-
- code : Defines any additional JS code to be executed,
- which can modify the data object that is sent to the backend.
-
- on_events : If the Callback should listen to bokeh events this
- should declare the types of event as a list (optional)
-
- on_changes : If the Callback should listen to model attribute
-
changes on the defined
models(optional)
If either on_events or on_changes are declared the Callback will be registered using the on_event or on_change machinery, otherwise it will be treated as a regular callback on the model. The callback can also define a _process_msg method, which can modify the data sent by the callback before it is passed to the streams.
-
attributes_js( attributes ) ¶ -
Generates JS code to look up attributes on JS objects from an attributes specification dictionary. If the specification references a plotting particular plotting handle it will also generate JS code to get the ID of the object.
Simple example (when referencing cb_data or cb_obj):
Input : {‘x’: ‘cb_data.geometry.x’}
Output : data[‘x’] = cb_data[‘geometry’][‘x’]
Example referencing plot handle:
Input : {‘x0’: ‘x_range.attributes.start’}
- Output : if ((x_range !== undefined)) {
-
data[‘x0’] = {id: x_range[‘id’], value: x_range[‘attributes’][‘start’]}
}
-
get_customjs( references , plot_id=None ) ¶ -
Creates a CustomJS callback that will send the requested attributes back to python.
-
on_change( attr , old , new ) ¶ -
Process change events adding timeout to process multiple concerted value change at once rather than firing off multiple plot updates.
-
on_event( event ) ¶ -
Process bokeh UIEvents adding timeout to process multiple concerted value change at once rather than firing off multiple plot updates.
-
process_on_event( ) ¶ -
Trigger callback change event and triggering corresponding streams.
-
resolve_attr_spec( spec , cb_obj , model=None ) ¶ -
Resolves a Callback attribute specification looking the corresponding attribute up on the cb_obj, which should be a bokeh model. If not model is supplied cb_obj is assumed to be the same as the model.
-
set_customjs_callback( js_callback , handle ) ¶ -
Generates a CustomJS callback by generating the required JS code and gathering all plotting handles and installs it on the requested callback handle.
-
set_server_callback( handle ) ¶ -
Set up on_change events for bokeh server interactions.
-
-
class
holoviews.plotting.bokeh.callbacks.CustomJSCallback( plot , streams , source , **params ) [source] ¶ -
Bases:
holoviews.plotting.bokeh.callbacks.MessageCallbackThe CustomJSCallback attaches CustomJS callbacks to a bokeh plot, which looks up the requested attributes and sends back a message to Python using a Comms instance.
-
classmethod
attributes_js( attributes ) [source] ¶ -
Generates JS code to look up attributes on JS objects from an attributes specification dictionary. If the specification references a plotting particular plotting handle it will also generate JS code to get the ID of the object.
Simple example (when referencing cb_data or cb_obj):
Input : {‘x’: ‘cb_data.geometry.x’}
Output : data[‘x’] = cb_data[‘geometry’][‘x’]
Example referencing plot handle:
Input : {‘x0’: ‘x_range.attributes.start’}
- Output : if ((x_range !== undefined)) {
-
data[‘x0’] = {id: x_range[‘id’], value: x_range[‘attributes’][‘start’]}
}
-
classmethod
-
class
holoviews.plotting.bokeh.callbacks.DataLinkCallback( root_model , link , source_plot , target_plot ) [source] ¶ -
Bases:
holoviews.plotting.bokeh.callbacks.LinkCallbackMerges the source and target ColumnDataSource
-
debug( *args , **kwargs ) ¶ -
Inspect .param.debug method for the full docstring
-
defaults( *args , **kwargs ) ¶ -
Inspect .param.defaults method for the full docstring
-
find_link( plot , link=None ) ¶ -
Searches a GenericElementPlot for a Link.
-
find_links( root_plot ) ¶ -
Traverses the supplied plot and searches for any Links on the plotted objects.
-
force_new_dynamic_value= functools.partial(<function Parameters.deprecate.<locals>.inner>, <class 'holoviews.plotting.bokeh.callbacks.DataLinkCallback'>) 
-
get_param_values= functools.partial(<function Parameters.deprecate.<locals>.inner>, <class 'holoviews.plotting.bokeh.callbacks.DataLinkCallback'>) 
-
get_value_generator= functools.partial(<function Parameters.deprecate.<locals>.inner>, <class 'holoviews.plotting.bokeh.callbacks.DataLinkCallback'>) 
-
inspect_value= functools.partial(<function Parameters.deprecate.<locals>.inner>, <class 'holoviews.plotting.bokeh.callbacks.DataLinkCallback'>) 
-
message( *args , **kwargs ) ¶ -
Inspect .param.message method for the full docstring
-
params( *args , **kwargs ) ¶ -
Inspect .param.params method for the full docstring
-
pprint( imports=None , prefix=' ' , unknown_value='<?>' , qualify=False , separator='' ) ¶ -
(Experimental) Pretty printed representation that may be evaluated with eval. See pprint() function for more details.
-
print_param_defaults( *args , **kwargs ) ¶ -
Inspect .param.print_param_defaults method for the full docstring
-
print_param_values( *args , **kwargs ) ¶ -
Inspect .param.print_param_values method for the full docstring
-
script_repr( imports=[] , prefix=' ' ) ¶ -
Variant of __repr__ designed for generating a runnable script.
-
set_default( *args , **kwargs ) ¶ -
Inspect .param.set_default method for the full docstring
-
set_dynamic_time_fn= functools.partial(<function Parameters.deprecate.<locals>.inner>, <class 'holoviews.plotting.bokeh.callbacks.DataLinkCallback'>) 
-
set_param= functools.partial(<function Parameters.deprecate.<locals>.inner>, <class 'holoviews.plotting.bokeh.callbacks.DataLinkCallback'>) 
-
state_pop( ) ¶ -
Restore the most recently saved state.
See state_push() for more details.
-
state_push( ) ¶ -
Save this instance’s state.
For Parameterized instances, this includes the state of dynamically generated values.
Subclasses that maintain short-term state should additionally save and restore that state using state_push() and state_pop().
Generally, this method is used by operations that need to test something without permanently altering the objects’ state.
-
validate( ) ¶ -
Should be subclassed to check if the source and target plots are compatible to perform the linking.
-
verbose( *args , **kwargs ) ¶ -
Inspect .param.verbose method for the full docstring
-
warning( *args , **kwargs ) ¶ -
Inspect .param.warning method for the full docstring
-
-
class
holoviews.plotting.bokeh.callbacks.DoubleTapCallback( plot , streams , source , **params ) [source] ¶ -
Bases:
holoviews.plotting.bokeh.callbacks.TapCallbackReturns the mouse x/y-position on doubletap event.
-
attributes_js( attributes ) ¶ -
Generates JS code to look up attributes on JS objects from an attributes specification dictionary. If the specification references a plotting particular plotting handle it will also generate JS code to get the ID of the object.
Simple example (when referencing cb_data or cb_obj):
Input : {‘x’: ‘cb_data.geometry.x’}
Output : data[‘x’] = cb_data[‘geometry’][‘x’]
Example referencing plot handle:
Input : {‘x0’: ‘x_range.attributes.start’}
- Output : if ((x_range !== undefined)) {
-
data[‘x0’] = {id: x_range[‘id’], value: x_range[‘attributes’][‘start’]}
}
-
get_customjs( references , plot_id=None ) ¶ -
Creates a CustomJS callback that will send the requested attributes back to python.
-
on_change( attr , old , new ) ¶ -
Process change events adding timeout to process multiple concerted value change at once rather than firing off multiple plot updates.
-
on_event( event ) ¶ -
Process bokeh UIEvents adding timeout to process multiple concerted value change at once rather than firing off multiple plot updates.
-
process_on_event( ) ¶ -
Trigger callback change event and triggering corresponding streams.
-
resolve_attr_spec( spec , cb_obj , model=None ) ¶ -
Resolves a Callback attribute specification looking the corresponding attribute up on the cb_obj, which should be a bokeh model. If not model is supplied cb_obj is assumed to be the same as the model.
-
set_customjs_callback( js_callback , handle ) ¶ -
Generates a CustomJS callback by generating the required JS code and gathering all plotting handles and installs it on the requested callback handle.
-
set_server_callback( handle ) ¶ -
Set up on_change events for bokeh server interactions.
-
-
class
holoviews.plotting.bokeh.callbacks.MessageCallback( plot , streams , source , **params ) [source] ¶ -
Bases:
objectA MessageCallback is an abstract baseclass used to supply Streams with events originating from bokeh plot interactions. The baseclass defines how messages are handled and the basic specification required to define a Callback.
-
class
holoviews.plotting.bokeh.callbacks.MouseEnterCallback( plot , streams , source , **params ) [source] ¶ -
Bases:
holoviews.plotting.bokeh.callbacks.PointerXYCallbackReturns the mouse x/y-position on mouseenter event, i.e. when mouse enters the plot canvas.
-
attributes_js( attributes ) ¶ -
Generates JS code to look up attributes on JS objects from an attributes specification dictionary. If the specification references a plotting particular plotting handle it will also generate JS code to get the ID of the object.
Simple example (when referencing cb_data or cb_obj):
Input : {‘x’: ‘cb_data.geometry.x’}
Output : data[‘x’] = cb_data[‘geometry’][‘x’]
Example referencing plot handle:
Input : {‘x0’: ‘x_range.attributes.start’}
- Output : if ((x_range !== undefined)) {
-
data[‘x0’] = {id: x_range[‘id’], value: x_range[‘attributes’][‘start’]}
}
-
get_customjs( references , plot_id=None ) ¶ -
Creates a CustomJS callback that will send the requested attributes back to python.
-
on_change( attr , old , new ) ¶ -
Process change events adding timeout to process multiple concerted value change at once rather than firing off multiple plot updates.
-
on_event( event ) ¶ -
Process bokeh UIEvents adding timeout to process multiple concerted value change at once rather than firing off multiple plot updates.
-
process_on_event( ) ¶ -
Trigger callback change event and triggering corresponding streams.
-
resolve_attr_spec( spec , cb_obj , model=None ) ¶ -
Resolves a Callback attribute specification looking the corresponding attribute up on the cb_obj, which should be a bokeh model. If not model is supplied cb_obj is assumed to be the same as the model.
-
set_customjs_callback( js_callback , handle ) ¶ -
Generates a CustomJS callback by generating the required JS code and gathering all plotting handles and installs it on the requested callback handle.
-
set_server_callback( handle ) ¶ -
Set up on_change events for bokeh server interactions.
-
-
class
holoviews.plotting.bokeh.callbacks.MouseLeaveCallback( plot , streams , source , **params ) [source] ¶ -
Bases:
holoviews.plotting.bokeh.callbacks.PointerXYCallbackReturns the mouse x/y-position on mouseleave event, i.e. when mouse leaves the plot canvas.
-
attributes_js( attributes ) ¶ -
Generates JS code to look up attributes on JS objects from an attributes specification dictionary. If the specification references a plotting particular plotting handle it will also generate JS code to get the ID of the object.
Simple example (when referencing cb_data or cb_obj):
Input : {‘x’: ‘cb_data.geometry.x’}
Output : data[‘x’] = cb_data[‘geometry’][‘x’]
Example referencing plot handle:
Input : {‘x0’: ‘x_range.attributes.start’}
- Output : if ((x_range !== undefined)) {
-
data[‘x0’] = {id: x_range[‘id’], value: x_range[‘attributes’][‘start’]}
}
-
get_customjs( references , plot_id=None ) ¶ -
Creates a CustomJS callback that will send the requested attributes back to python.
-
on_change( attr , old , new ) ¶ -
Process change events adding timeout to process multiple concerted value change at once rather than firing off multiple plot updates.
-
on_event( event ) ¶ -
Process bokeh UIEvents adding timeout to process multiple concerted value change at once rather than firing off multiple plot updates.
-
process_on_event( ) ¶ -
Trigger callback change event and triggering corresponding streams.
-
resolve_attr_spec( spec , cb_obj , model=None ) ¶ -
Resolves a Callback attribute specification looking the corresponding attribute up on the cb_obj, which should be a bokeh model. If not model is supplied cb_obj is assumed to be the same as the model.
-
set_customjs_callback( js_callback , handle ) ¶ -
Generates a CustomJS callback by generating the required JS code and gathering all plotting handles and installs it on the requested callback handle.
-
set_server_callback( handle ) ¶ -
Set up on_change events for bokeh server interactions.
-
-
class
holoviews.plotting.bokeh.callbacks.PlotSizeCallback( plot , streams , source , **params ) [source] ¶ -
Bases:
holoviews.plotting.bokeh.callbacks.CallbackReturns the actual width and height of a plot once the layout solver has executed.
-
attributes_js( attributes ) ¶ -
Generates JS code to look up attributes on JS objects from an attributes specification dictionary. If the specification references a plotting particular plotting handle it will also generate JS code to get the ID of the object.
Simple example (when referencing cb_data or cb_obj):
Input : {‘x’: ‘cb_data.geometry.x’}
Output : data[‘x’] = cb_data[‘geometry’][‘x’]
Example referencing plot handle:
Input : {‘x0’: ‘x_range.attributes.start’}
- Output : if ((x_range !== undefined)) {
-
data[‘x0’] = {id: x_range[‘id’], value: x_range[‘attributes’][‘start’]}
}
-
get_customjs( references , plot_id=None ) ¶ -
Creates a CustomJS callback that will send the requested attributes back to python.
-
on_change( attr , old , new ) ¶ -
Process change events adding timeout to process multiple concerted value change at once rather than firing off multiple plot updates.
-
on_event( event ) ¶ -
Process bokeh UIEvents adding timeout to process multiple concerted value change at once rather than firing off multiple plot updates.
-
process_on_event( ) ¶ -
Trigger callback change event and triggering corresponding streams.
-
resolve_attr_spec( spec , cb_obj , model=None ) ¶ -
Resolves a Callback attribute specification looking the corresponding attribute up on the cb_obj, which should be a bokeh model. If not model is supplied cb_obj is assumed to be the same as the model.
-
set_customjs_callback( js_callback , handle ) ¶ -
Generates a CustomJS callback by generating the required JS code and gathering all plotting handles and installs it on the requested callback handle.
-
set_server_callback( handle ) ¶ -
Set up on_change events for bokeh server interactions.
-
-
class
holoviews.plotting.bokeh.callbacks.PointerXCallback( plot , streams , source , **params ) [source] ¶ -
Bases:
holoviews.plotting.bokeh.callbacks.PointerXYCallbackReturns the mouse x-position on mousemove event.
-
attributes_js( attributes ) ¶ -
Generates JS code to look up attributes on JS objects from an attributes specification dictionary. If the specification references a plotting particular plotting handle it will also generate JS code to get the ID of the object.
Simple example (when referencing cb_data or cb_obj):
Input : {‘x’: ‘cb_data.geometry.x’}
Output : data[‘x’] = cb_data[‘geometry’][‘x’]
Example referencing plot handle:
Input : {‘x0’: ‘x_range.attributes.start’}
- Output : if ((x_range !== undefined)) {
-
data[‘x0’] = {id: x_range[‘id’], value: x_range[‘attributes’][‘start’]}
}
-
get_customjs( references , plot_id=None ) ¶ -
Creates a CustomJS callback that will send the requested attributes back to python.
-
on_change( attr , old , new ) ¶ -
Process change events adding timeout to process multiple concerted value change at once rather than firing off multiple plot updates.
-
on_event( event ) ¶ -
Process bokeh UIEvents adding timeout to process multiple concerted value change at once rather than firing off multiple plot updates.
-
process_on_event( ) ¶ -
Trigger callback change event and triggering corresponding streams.
-
resolve_attr_spec( spec , cb_obj , model=None ) ¶ -
Resolves a Callback attribute specification looking the corresponding attribute up on the cb_obj, which should be a bokeh model. If not model is supplied cb_obj is assumed to be the same as the model.
-
set_customjs_callback( js_callback , handle ) ¶ -
Generates a CustomJS callback by generating the required JS code and gathering all plotting handles and installs it on the requested callback handle.
-
set_server_callback( handle ) ¶ -
Set up on_change events for bokeh server interactions.
-
-
class
holoviews.plotting.bokeh.callbacks.PointerXYCallback( plot , streams , source , **params ) [source] ¶ -
Bases:
holoviews.plotting.bokeh.callbacks.CallbackReturns the mouse x/y-position on mousemove event.
-
attributes_js( attributes ) ¶ -
Generates JS code to look up attributes on JS objects from an attributes specification dictionary. If the specification references a plotting particular plotting handle it will also generate JS code to get the ID of the object.
Simple example (when referencing cb_data or cb_obj):
Input : {‘x’: ‘cb_data.geometry.x’}
Output : data[‘x’] = cb_data[‘geometry’][‘x’]
Example referencing plot handle:
Input : {‘x0’: ‘x_range.attributes.start’}
- Output : if ((x_range !== undefined)) {
-
data[‘x0’] = {id: x_range[‘id’], value: x_range[‘attributes’][‘start’]}
}
-
get_customjs( references , plot_id=None ) ¶ -
Creates a CustomJS callback that will send the requested attributes back to python.
-
on_change( attr , old , new ) ¶ -
Process change events adding timeout to process multiple concerted value change at once rather than firing off multiple plot updates.
-
on_event( event ) ¶ -
Process bokeh UIEvents adding timeout to process multiple concerted value change at once rather than firing off multiple plot updates.
-
process_on_event( ) ¶ -
Trigger callback change event and triggering corresponding streams.
-
resolve_attr_spec( spec , cb_obj , model=None ) ¶ -
Resolves a Callback attribute specification looking the corresponding attribute up on the cb_obj, which should be a bokeh model. If not model is supplied cb_obj is assumed to be the same as the model.
-
set_customjs_callback( js_callback , handle ) ¶ -
Generates a CustomJS callback by generating the required JS code and gathering all plotting handles and installs it on the requested callback handle.
-
set_server_callback( handle ) ¶ -
Set up on_change events for bokeh server interactions.
-
-
class
holoviews.plotting.bokeh.callbacks.PointerYCallback( plot , streams , source , **params ) [source] ¶ -
Bases:
holoviews.plotting.bokeh.callbacks.PointerXYCallbackReturns the mouse x/y-position on mousemove event.
-
attributes_js( attributes ) ¶ -
Generates JS code to look up attributes on JS objects from an attributes specification dictionary. If the specification references a plotting particular plotting handle it will also generate JS code to get the ID of the object.
Simple example (when referencing cb_data or cb_obj):
Input : {‘x’: ‘cb_data.geometry.x’}
Output : data[‘x’] = cb_data[‘geometry’][‘x’]
Example referencing plot handle:
Input : {‘x0’: ‘x_range.attributes.start’}
- Output : if ((x_range !== undefined)) {
-
data[‘x0’] = {id: x_range[‘id’], value: x_range[‘attributes’][‘start’]}
}
-
get_customjs( references , plot_id=None ) ¶ -
Creates a CustomJS callback that will send the requested attributes back to python.
-
on_change( attr , old , new ) ¶ -
Process change events adding timeout to process multiple concerted value change at once rather than firing off multiple plot updates.
-
on_event( event ) ¶ -
Process bokeh UIEvents adding timeout to process multiple concerted value change at once rather than firing off multiple plot updates.
-
process_on_event( ) ¶ -
Trigger callback change event and triggering corresponding streams.
-
resolve_attr_spec( spec , cb_obj , model=None ) ¶ -
Resolves a Callback attribute specification looking the corresponding attribute up on the cb_obj, which should be a bokeh model. If not model is supplied cb_obj is assumed to be the same as the model.
-
set_customjs_callback( js_callback , handle ) ¶ -
Generates a CustomJS callback by generating the required JS code and gathering all plotting handles and installs it on the requested callback handle.
-
set_server_callback( handle ) ¶ -
Set up on_change events for bokeh server interactions.
-
-
class
holoviews.plotting.bokeh.callbacks.RangeToolLinkCallback( root_model , link , source_plot , target_plot ) [source] ¶ -
Bases:
holoviews.plotting.bokeh.callbacks.LinkCallbackAttaches a RangeTool to the source plot and links it to the specified axes on the target plot
-
debug( *args , **kwargs ) ¶ -
Inspect .param.debug method for the full docstring
-
defaults( *args , **kwargs ) ¶ -
Inspect .param.defaults method for the full docstring
-
find_link( plot , link=None ) ¶ -
Searches a GenericElementPlot for a Link.
-
find_links( root_plot ) ¶ -
Traverses the supplied plot and searches for any Links on the plotted objects.
-
force_new_dynamic_value= functools.partial(<function Parameters.deprecate.<locals>.inner>, <class 'holoviews.plotting.bokeh.callbacks.RangeToolLinkCallback'>) 
-
get_param_values= functools.partial(<function Parameters.deprecate.<locals>.inner>, <class 'holoviews.plotting.bokeh.callbacks.RangeToolLinkCallback'>) 
-
get_value_generator= functools.partial(<function Parameters.deprecate.<locals>.inner>, <class 'holoviews.plotting.bokeh.callbacks.RangeToolLinkCallback'>) 
-
inspect_value= functools.partial(<function Parameters.deprecate.<locals>.inner>, <class 'holoviews.plotting.bokeh.callbacks.RangeToolLinkCallback'>) 
-
message( *args , **kwargs ) ¶ -
Inspect .param.message method for the full docstring
-
params( *args , **kwargs ) ¶ -
Inspect .param.params method for the full docstring
-
pprint( imports=None , prefix=' ' , unknown_value='<?>' , qualify=False , separator='' ) ¶ -
(Experimental) Pretty printed representation that may be evaluated with eval. See pprint() function for more details.
-
print_param_defaults( *args , **kwargs ) ¶ -
Inspect .param.print_param_defaults method for the full docstring
-
print_param_values( *args , **kwargs ) ¶ -
Inspect .param.print_param_values method for the full docstring
-
script_repr( imports=[] , prefix=' ' ) ¶ -
Variant of __repr__ designed for generating a runnable script.
-
set_default( *args , **kwargs ) ¶ -
Inspect .param.set_default method for the full docstring
-
set_dynamic_time_fn= functools.partial(<function Parameters.deprecate.<locals>.inner>, <class 'holoviews.plotting.bokeh.callbacks.RangeToolLinkCallback'>) 
-
set_param= functools.partial(<function Parameters.deprecate.<locals>.inner>, <class 'holoviews.plotting.bokeh.callbacks.RangeToolLinkCallback'>) 
-
state_pop( ) ¶ -
Restore the most recently saved state.
See state_push() for more details.
-
state_push( ) ¶ -
Save this instance’s state.
For Parameterized instances, this includes the state of dynamically generated values.
Subclasses that maintain short-term state should additionally save and restore that state using state_push() and state_pop().
Generally, this method is used by operations that need to test something without permanently altering the objects’ state.
-
validate( ) ¶ -
Should be subclassed to check if the source and target plots are compatible to perform the linking.
-
verbose( *args , **kwargs ) ¶ -
Inspect .param.verbose method for the full docstring
-
warning( *args , **kwargs ) ¶ -
Inspect .param.warning method for the full docstring
-
-
class
holoviews.plotting.bokeh.callbacks.RangeXCallback( plot , streams , source , **params ) [source] ¶ -
Bases:
holoviews.plotting.bokeh.callbacks.RangeXYCallbackReturns the x-axis range of a plot.
-
attributes_js( attributes ) ¶ -
Generates JS code to look up attributes on JS objects from an attributes specification dictionary. If the specification references a plotting particular plotting handle it will also generate JS code to get the ID of the object.
Simple example (when referencing cb_data or cb_obj):
Input : {‘x’: ‘cb_data.geometry.x’}
Output : data[‘x’] = cb_data[‘geometry’][‘x’]
Example referencing plot handle:
Input : {‘x0’: ‘x_range.attributes.start’}
- Output : if ((x_range !== undefined)) {
-
data[‘x0’] = {id: x_range[‘id’], value: x_range[‘attributes’][‘start’]}
}
-
get_customjs( references , plot_id=None ) ¶ -
Creates a CustomJS callback that will send the requested attributes back to python.
-
on_change( attr , old , new ) ¶ -
Process change events adding timeout to process multiple concerted value change at once rather than firing off multiple plot updates.
-
on_event( event ) ¶ -
Process bokeh UIEvents adding timeout to process multiple concerted value change at once rather than firing off multiple plot updates.
-
process_on_event( ) ¶ -
Trigger callback change event and triggering corresponding streams.
-
resolve_attr_spec( spec , cb_obj , model=None ) ¶ -
Resolves a Callback attribute specification looking the corresponding attribute up on the cb_obj, which should be a bokeh model. If not model is supplied cb_obj is assumed to be the same as the model.
-
set_customjs_callback( js_callback , handle ) ¶ -
Generates a CustomJS callback by generating the required JS code and gathering all plotting handles and installs it on the requested callback handle.
-
set_server_callback( handle ) ¶ -
Set up on_change events for bokeh server interactions.
-
-
class
holoviews.plotting.bokeh.callbacks.RangeXYCallback( plot , streams , source , **params ) [source] ¶ -
Bases:
holoviews.plotting.bokeh.callbacks.CallbackReturns the x/y-axis ranges of a plot.
-
attributes_js( attributes ) ¶ -
Generates JS code to look up attributes on JS objects from an attributes specification dictionary. If the specification references a plotting particular plotting handle it will also generate JS code to get the ID of the object.
Simple example (when referencing cb_data or cb_obj):
Input : {‘x’: ‘cb_data.geometry.x’}
Output : data[‘x’] = cb_data[‘geometry’][‘x’]
Example referencing plot handle:
Input : {‘x0’: ‘x_range.attributes.start’}
- Output : if ((x_range !== undefined)) {
-
data[‘x0’] = {id: x_range[‘id’], value: x_range[‘attributes’][‘start’]}
}
-
get_customjs( references , plot_id=None ) ¶ -
Creates a CustomJS callback that will send the requested attributes back to python.
-
on_change( attr , old , new ) ¶ -
Process change events adding timeout to process multiple concerted value change at once rather than firing off multiple plot updates.
-
on_event( event ) ¶ -
Process bokeh UIEvents adding timeout to process multiple concerted value change at once rather than firing off multiple plot updates.
-
process_on_event( ) ¶ -
Trigger callback change event and triggering corresponding streams.
-
resolve_attr_spec( spec , cb_obj , model=None ) ¶ -
Resolves a Callback attribute specification looking the corresponding attribute up on the cb_obj, which should be a bokeh model. If not model is supplied cb_obj is assumed to be the same as the model.
-
set_customjs_callback( js_callback , handle ) ¶ -
Generates a CustomJS callback by generating the required JS code and gathering all plotting handles and installs it on the requested callback handle.
-
set_server_callback( handle ) ¶ -
Set up on_change events for bokeh server interactions.
-
-
class
holoviews.plotting.bokeh.callbacks.RangeYCallback( plot , streams , source , **params ) [source] ¶ -
Bases:
holoviews.plotting.bokeh.callbacks.RangeXYCallbackReturns the y-axis range of a plot.
-
attributes_js( attributes ) ¶ -
Generates JS code to look up attributes on JS objects from an attributes specification dictionary. If the specification references a plotting particular plotting handle it will also generate JS code to get the ID of the object.
Simple example (when referencing cb_data or cb_obj):
Input : {‘x’: ‘cb_data.geometry.x’}
Output : data[‘x’] = cb_data[‘geometry’][‘x’]
Example referencing plot handle:
Input : {‘x0’: ‘x_range.attributes.start’}
- Output : if ((x_range !== undefined)) {
-
data[‘x0’] = {id: x_range[‘id’], value: x_range[‘attributes’][‘start’]}
}
-
get_customjs( references , plot_id=None ) ¶ -
Creates a CustomJS callback that will send the requested attributes back to python.
-
on_change( attr , old , new ) ¶ -
Process change events adding timeout to process multiple concerted value change at once rather than firing off multiple plot updates.
-
on_event( event ) ¶ -
Process bokeh UIEvents adding timeout to process multiple concerted value change at once rather than firing off multiple plot updates.
-
process_on_event( ) ¶ -
Trigger callback change event and triggering corresponding streams.
-
resolve_attr_spec( spec , cb_obj , model=None ) ¶ -
Resolves a Callback attribute specification looking the corresponding attribute up on the cb_obj, which should be a bokeh model. If not model is supplied cb_obj is assumed to be the same as the model.
-
set_customjs_callback( js_callback , handle ) ¶ -
Generates a CustomJS callback by generating the required JS code and gathering all plotting handles and installs it on the requested callback handle.
-
set_server_callback( handle ) ¶ -
Set up on_change events for bokeh server interactions.
-
-
class
holoviews.plotting.bokeh.callbacks.ResetCallback( plot , streams , source , **params ) [source] ¶ -
Bases:
holoviews.plotting.bokeh.callbacks.CallbackSignals the Reset stream if an event has been triggered.
-
attributes_js( attributes ) ¶ -
Generates JS code to look up attributes on JS objects from an attributes specification dictionary. If the specification references a plotting particular plotting handle it will also generate JS code to get the ID of the object.
Simple example (when referencing cb_data or cb_obj):
Input : {‘x’: ‘cb_data.geometry.x’}
Output : data[‘x’] = cb_data[‘geometry’][‘x’]
Example referencing plot handle:
Input : {‘x0’: ‘x_range.attributes.start’}
- Output : if ((x_range !== undefined)) {
-
data[‘x0’] = {id: x_range[‘id’], value: x_range[‘attributes’][‘start’]}
}
-
get_customjs( references , plot_id=None ) ¶ -
Creates a CustomJS callback that will send the requested attributes back to python.
-
on_change( attr , old , new ) ¶ -
Process change events adding timeout to process multiple concerted value change at once rather than firing off multiple plot updates.
-
on_event( event ) ¶ -
Process bokeh UIEvents adding timeout to process multiple concerted value change at once rather than firing off multiple plot updates.
-
process_on_event( ) ¶ -
Trigger callback change event and triggering corresponding streams.
-
resolve_attr_spec( spec , cb_obj , model=None ) ¶ -
Resolves a Callback attribute specification looking the corresponding attribute up on the cb_obj, which should be a bokeh model. If not model is supplied cb_obj is assumed to be the same as the model.
-
set_customjs_callback( js_callback , handle ) ¶ -
Generates a CustomJS callback by generating the required JS code and gathering all plotting handles and installs it on the requested callback handle.
-
set_server_callback( handle ) ¶ -
Set up on_change events for bokeh server interactions.
-
-
class
holoviews.plotting.bokeh.callbacks.Selection1DCallback( plot , streams , source , **params ) [source] ¶ -
Bases:
holoviews.plotting.bokeh.callbacks.CallbackReturns the current selection on a ColumnDataSource.
-
attributes_js( attributes ) ¶ -
Generates JS code to look up attributes on JS objects from an attributes specification dictionary. If the specification references a plotting particular plotting handle it will also generate JS code to get the ID of the object.
Simple example (when referencing cb_data or cb_obj):
Input : {‘x’: ‘cb_data.geometry.x’}
Output : data[‘x’] = cb_data[‘geometry’][‘x’]
Example referencing plot handle:
Input : {‘x0’: ‘x_range.attributes.start’}
- Output : if ((x_range !== undefined)) {
-
data[‘x0’] = {id: x_range[‘id’], value: x_range[‘attributes’][‘start’]}
}
-
get_customjs( references , plot_id=None ) ¶ -
Creates a CustomJS callback that will send the requested attributes back to python.
-
on_change( attr , old , new ) ¶ -
Process change events adding timeout to process multiple concerted value change at once rather than firing off multiple plot updates.
-
on_event( event ) ¶ -
Process bokeh UIEvents adding timeout to process multiple concerted value change at once rather than firing off multiple plot updates.
-
process_on_event( ) ¶ -
Trigger callback change event and triggering corresponding streams.
-
resolve_attr_spec( spec , cb_obj , model=None ) ¶ -
Resolves a Callback attribute specification looking the corresponding attribute up on the cb_obj, which should be a bokeh model. If not model is supplied cb_obj is assumed to be the same as the model.
-
set_customjs_callback( js_callback , handle ) ¶ -
Generates a CustomJS callback by generating the required JS code and gathering all plotting handles and installs it on the requested callback handle.
-
set_server_callback( handle ) ¶ -
Set up on_change events for bokeh server interactions.
-
-
class
holoviews.plotting.bokeh.callbacks.ServerCallback( plot , streams , source , **params ) [source] ¶ -
Bases:
holoviews.plotting.bokeh.callbacks.MessageCallbackImplements methods to set up bokeh server callbacks. A ServerCallback resolves the requested attributes on the Python end and then hands the msg off to the general on_msg handler, which will update the Stream(s) attached to the callback.
-
on_change( attr , old , new ) [source] ¶ -
Process change events adding timeout to process multiple concerted value change at once rather than firing off multiple plot updates.
-
on_event( event ) [source] ¶ -
Process bokeh UIEvents adding timeout to process multiple concerted value change at once rather than firing off multiple plot updates.
-
-
class
holoviews.plotting.bokeh.callbacks.SingleTapCallback( plot , streams , source , **params ) [source] ¶ -
Bases:
holoviews.plotting.bokeh.callbacks.TapCallbackReturns the mouse x/y-position on tap event.
-
attributes_js( attributes ) ¶ -
Generates JS code to look up attributes on JS objects from an attributes specification dictionary. If the specification references a plotting particular plotting handle it will also generate JS code to get the ID of the object.
Simple example (when referencing cb_data or cb_obj):
Input : {‘x’: ‘cb_data.geometry.x’}
Output : data[‘x’] = cb_data[‘geometry’][‘x’]
Example referencing plot handle:
Input : {‘x0’: ‘x_range.attributes.start’}
- Output : if ((x_range !== undefined)) {
-
data[‘x0’] = {id: x_range[‘id’], value: x_range[‘attributes’][‘start’]}
}
-
get_customjs( references , plot_id=None ) ¶ -
Creates a CustomJS callback that will send the requested attributes back to python.
-
on_change( attr , old , new ) ¶ -
Process change events adding timeout to process multiple concerted value change at once rather than firing off multiple plot updates.
-
on_event( event ) ¶ -
Process bokeh UIEvents adding timeout to process multiple concerted value change at once rather than firing off multiple plot updates.
-
process_on_event( ) ¶ -
Trigger callback change event and triggering corresponding streams.
-
resolve_attr_spec( spec , cb_obj , model=None ) ¶ -
Resolves a Callback attribute specification looking the corresponding attribute up on the cb_obj, which should be a bokeh model. If not model is supplied cb_obj is assumed to be the same as the model.
-
set_customjs_callback( js_callback , handle ) ¶ -
Generates a CustomJS callback by generating the required JS code and gathering all plotting handles and installs it on the requested callback handle.
-
set_server_callback( handle ) ¶ -
Set up on_change events for bokeh server interactions.
-
-
class
holoviews.plotting.bokeh.callbacks.TapCallback( plot , streams , source , **params ) [source] ¶ -
Bases:
holoviews.plotting.bokeh.callbacks.PointerXYCallbackReturns the mouse x/y-position on tap event.
Note: As of bokeh 0.12.5, there is no way to distinguish the individual tap events within a doubletap event.
-
attributes_js( attributes ) ¶ -
Generates JS code to look up attributes on JS objects from an attributes specification dictionary. If the specification references a plotting particular plotting handle it will also generate JS code to get the ID of the object.
Simple example (when referencing cb_data or cb_obj):
Input : {‘x’: ‘cb_data.geometry.x’}
Output : data[‘x’] = cb_data[‘geometry’][‘x’]
Example referencing plot handle:
Input : {‘x0’: ‘x_range.attributes.start’}
- Output : if ((x_range !== undefined)) {
-
data[‘x0’] = {id: x_range[‘id’], value: x_range[‘attributes’][‘start’]}
}
-
get_customjs( references , plot_id=None ) ¶ -
Creates a CustomJS callback that will send the requested attributes back to python.
-
on_change( attr , old , new ) ¶ -
Process change events adding timeout to process multiple concerted value change at once rather than firing off multiple plot updates.
-
on_event( event ) ¶ -
Process bokeh UIEvents adding timeout to process multiple concerted value change at once rather than firing off multiple plot updates.
-
process_on_event( ) ¶ -
Trigger callback change event and triggering corresponding streams.
-
resolve_attr_spec( spec , cb_obj , model=None ) ¶ -
Resolves a Callback attribute specification looking the corresponding attribute up on the cb_obj, which should be a bokeh model. If not model is supplied cb_obj is assumed to be the same as the model.
-
set_customjs_callback( js_callback , handle ) ¶ -
Generates a CustomJS callback by generating the required JS code and gathering all plotting handles and installs it on the requested callback handle.
-
set_server_callback( handle ) ¶ -
Set up on_change events for bokeh server interactions.
-
chart
Module
-
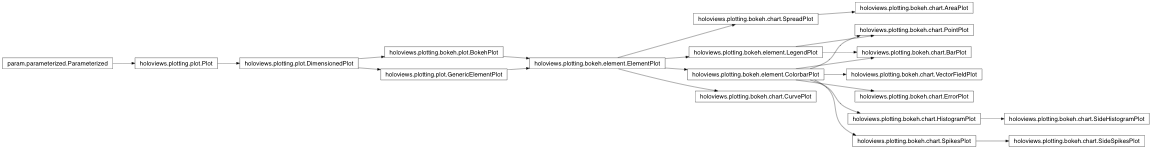
class
holoviews.plotting.bokeh.chart.BarPlot( element , plot=None , **params ) [source] ¶ -
Bases:
holoviews.plotting.bokeh.element.ColorbarPlot,holoviews.plotting.bokeh.element.LegendPlotBarPlot allows generating single- or multi-category bar Charts, by selecting which key dimensions are mapped onto separate groups, categories and stacks.
-
param Parameter
fontsize( allow_None=True, constant=False, default={‘title’: ‘12pt’}, instantiate=False, pickle_default_value=True, precedence=None, readonly=False, watchers={} ) - Specifies various fontsizes of the displayed text. Finer control is available by supplying a dictionary where any unmentioned keys reverts to the default sizes, e.g: {‘ticks’: ‘20pt’, ‘title’: ‘15pt’, ‘ylabel’: ‘5px’, ‘xlabel’: ‘5px’}
-
param Boolean
show_title( allow_None=False, bounds=(0, 1), constant=False, default=True, instantiate=False, pickle_default_value=True, precedence=None, readonly=False, watchers={} ) - Whether to display the plot title.
-
param String
title( allow_None=False, basestring=<class ‘str’>, constant=False, default={label} {group} {dimensions}, instantiate=False, pickle_default_value=True, precedence=None, readonly=False, regex=None, watchers={} ) - The formatting string for the title of this plot, allows defining a label group separator and dimension labels.
-
param String
title_format( allow_None=True, basestring=<class ‘str’>, constant=False, default=None, instantiate=False, pickle_default_value=True, precedence=None, readonly=False, regex=None, watchers={} ) - Alias for title.
-
param Boolean
normalize( allow_None=False, bounds=(0, 1), constant=False, default=True, instantiate=False, pickle_default_value=True, precedence=None, readonly=False, watchers={} ) - Whether to compute ranges across all Elements at this level of plotting. Allows selecting normalization at different levels for nested data containers.
-
param Parameter
projection( allow_None=True, constant=False, default=None, instantiate=False, pickle_default_value=True, precedence=None, readonly=False, watchers={} ) - Allows supplying a custom projection to transform the axis coordinates during display. Example projections include ‘3d’ and ‘polar’ projections supported by some backends. Depending on the backend custom, projection objects may be supplied.
-
param Boolean
apply_ranges( allow_None=False, bounds=(0, 1), constant=False, default=True, instantiate=False, pickle_default_value=True, precedence=None, readonly=False, watchers={} ) - Whether to compute the plot bounds from the data itself.
-
param Boolean
apply_extents( allow_None=False, bounds=(0, 1), constant=False, default=True, instantiate=False, pickle_default_value=True, precedence=None, readonly=False, watchers={} ) - Whether to apply extent overrides on the Elements
-
param ClassSelector
bgcolor( allow_None=True, constant=False, default=None, instantiate=True, is_instance=True, pickle_default_value=True, precedence=None, readonly=False, watchers={} ) - If set bgcolor overrides the background color of the axis.
-
param ClassSelector
default_span( allow_None=False, constant=False, default=2.0, instantiate=True, is_instance=True, pickle_default_value=True, precedence=None, readonly=False, watchers={} ) - Defines the span of an axis if the axis range is zero, i.e. if the lower and upper end of an axis are equal or no range is defined at all. For example if there is a single datapoint at 0 a default_span of 2.0 will result in axis ranges spanning from -1 to 1.
-
param Boolean
invert_axes( allow_None=False, bounds=(0, 1), constant=False, default=False, instantiate=False, pickle_default_value=True, precedence=None, readonly=False, watchers={} ) - Whether to invert the x- and y-axis
-
param Boolean
invert_xaxis( allow_None=False, bounds=(0, 1), constant=False, default=False, instantiate=False, pickle_default_value=True, precedence=None, readonly=False, watchers={} ) - Whether to invert the plot x-axis.
-
param Boolean
invert_yaxis( allow_None=False, bounds=(0, 1), constant=False, default=False, instantiate=False, pickle_default_value=True, precedence=None, readonly=False, watchers={} ) - Whether to invert the plot y-axis.
-
param Boolean
logx( allow_None=False, bounds=(0, 1), constant=False, default=False, instantiate=False, pickle_default_value=True, precedence=None, readonly=False, watchers={} ) - Whether the x-axis of the plot will be a log axis.
-
param Boolean
logy( allow_None=False, bounds=(0, 1), constant=False, default=False, instantiate=False, pickle_default_value=True, precedence=None, readonly=False, watchers={} ) - Whether the y-axis of the plot will be a log axis.
-
param ClassSelector
padding( allow_None=False, constant=False, default=0, instantiate=True, is_instance=True, pickle_default_value=True, precedence=None, readonly=False, watchers={} ) - Fraction by which to increase auto-ranged extents to make datapoints more visible around borders. To compute padding, the axis whose screen size is largest is chosen, and the range of that axis is increased by the specified fraction along each axis. Other axes are then padded ensuring that the amount of screen space devoted to padding is equal for all axes. If specified as a tuple, the int or float values in the tuple will be used for padding in each axis, in order (x,y or x,y,z). For example, for padding=0.2 on a 800x800-pixel plot, an x-axis with the range [0,10] will be padded by 20% to be [-1,11], while a y-axis with a range [0,1000] will be padded to be [-100,1100], which should make the padding be approximately the same number of pixels. But if the same plot is changed to have a height of only 200, the y-range will then be [-400,1400] so that the y-axis padding will still match that of the x-axis. It is also possible to declare non-equal padding value for the lower and upper bound of an axis by supplying nested tuples, e.g. padding=(0.1, (0, 0.1)) will pad the x-axis lower and upper bound as well as the y-axis upper bound by a fraction of 0.1 while the y-axis lower bound is not padded at all.
-
param Boolean
show_legend( allow_None=False, bounds=(0, 1), constant=False, default=True, instantiate=False, pickle_default_value=True, precedence=None, readonly=False, watchers={} ) - Whether to show legend for the plot.
-
param Boolean
show_grid( allow_None=False, bounds=(0, 1), constant=False, default=False, instantiate=False, pickle_default_value=True, precedence=None, readonly=False, watchers={} ) - Whether to show a Cartesian grid on the plot.
-
param ObjectSelector
xaxis( allow_None=None, check_on_set=True, compute_default_fn=None, constant=False, default=bottom, instantiate=False, names=None, objects=[‘top’, ‘bottom’, ‘bare’, ‘top-bare’, ‘bottom-bare’, None, True, False], pickle_default_value=True, precedence=None, readonly=False, watchers={} ) - Whether and where to display the xaxis. The “bare” options allow suppressing all axis labels, including ticks and xlabel. Valid options are ‘top’, ‘bottom’, ‘bare’, ‘top-bare’ and ‘bottom-bare’.
-
param ObjectSelector
yaxis( allow_None=None, check_on_set=True, compute_default_fn=None, constant=False, default=left, instantiate=False, names=None, objects=[‘left’, ‘right’, ‘bare’, ‘left-bare’, ‘right-bare’, None, True, False], pickle_default_value=True, precedence=None, readonly=False, watchers={} ) - Whether and where to display the yaxis. The “bare” options allow suppressing all axis labels, including ticks and ylabel. Valid options are ‘left’, ‘right’, ‘bare’, ‘left-bare’ and ‘right-bare’.
-
param String
xlabel( allow_None=True, basestring=<class ‘str’>, constant=False, default=None, instantiate=False, pickle_default_value=True, precedence=None, readonly=False, regex=None, watchers={} ) - An explicit override of the x-axis label, if set takes precedence over the dimension label.
-
param String
ylabel( allow_None=True, basestring=<class ‘str’>, constant=False, default=None, instantiate=False, pickle_default_value=True, precedence=None, readonly=False, regex=None, watchers={} ) - An explicit override of the y-axis label, if set takes precedence over the dimension label.
-
param NumericTuple
xlim( allow_None=False, constant=False, default=(nan, nan), instantiate=False, length=2, pickle_default_value=True, precedence=None, readonly=False, watchers={} ) - User-specified x-axis range limits for the plot, as a tuple (low,high). If specified, takes precedence over data and dimension ranges.
-
param NumericTuple
ylim( allow_None=False, constant=False, default=(nan, nan), instantiate=False, length=2, pickle_default_value=True, precedence=None, readonly=False, watchers={} ) - User-specified x-axis range limits for the plot, as a tuple (low,high). If specified, takes precedence over data and dimension ranges.
-
param NumericTuple
zlim( allow_None=False, constant=False, default=(nan, nan), instantiate=False, length=2, pickle_default_value=True, precedence=None, readonly=False, watchers={} ) - User-specified z-axis range limits for the plot, as a tuple (low,high). If specified, takes precedence over data and dimension ranges.
-
param Integer
xrotation( allow_None=True, bounds=(0, 360), constant=False, default=None, inclusive_bounds=(True, True), instantiate=False, pickle_default_value=True, precedence=None, readonly=False, softbounds=None, time_dependent=False, time_fn=<Time Time00001>, watchers={} ) - Rotation angle of the xticks.
-
param Integer
yrotation( allow_None=True, bounds=(0, 360), constant=False, default=None, inclusive_bounds=(True, True), instantiate=False, pickle_default_value=True, precedence=None, readonly=False, softbounds=None, time_dependent=False, time_fn=<Time Time00001>, watchers={} ) - Rotation angle of the yticks.
-
param Parameter
xticks( allow_None=True, constant=False, default=None, instantiate=False, pickle_default_value=True, precedence=None, readonly=False, watchers={} ) - Ticks along x-axis specified as an integer, explicit list of tick locations, or bokeh Ticker object. If set to None default bokeh ticking behavior is applied.
-
param Parameter
yticks( allow_None=True, constant=False, default=None, instantiate=False, pickle_default_value=True, precedence=None, readonly=False, watchers={} ) - Ticks along y-axis specified as an integer, explicit list of tick locations, or bokeh Ticker object. If set to None default bokeh ticking behavior is applied.
-
param Integer
width( allow_None=False, bounds=None, constant=False, default=300, inclusive_bounds=(True, True), instantiate=False, pickle_default_value=True, precedence=None, readonly=False, softbounds=None, time_dependent=False, time_fn=<Time Time00001>, watchers={} ) - Width of the plot in pixels
-
param Integer
height( allow_None=False, bounds=None, constant=False, default=300, inclusive_bounds=(True, True), instantiate=False, pickle_default_value=True, precedence=None, readonly=False, softbounds=None, time_dependent=False, time_fn=<Time Time00001>, watchers={} ) - Height of the plot in pixels
-
param ObjectSelector
sizing_mode( allow_None=None, check_on_set=True, compute_default_fn=None, constant=False, default=fixed, instantiate=False, names=None, objects=[‘fixed’, ‘stretch_both’, ‘scale_width’, ‘scale_height’, ‘scale_both’], pickle_default_value=True, precedence=None, readonly=False, watchers={} ) - How the item being displayed should size itself. “stretch_both” plots will resize to occupy all available space, even if this changes the aspect ratio of the element. “fixed” plots are not responsive and will retain their original width and height regardless of any subsequent browser window resize events. “scale_width” elements will responsively resize to fit to the width available, while maintaining the original aspect ratio. “scale_height” elements will responsively resize to fit to the height available, while maintaining the original aspect ratio. “scale_both” elements will responsively resize to for both the width and height available, while maintaining the original aspect ratio.
-
param Boolean
shared_datasource( allow_None=False, bounds=(0, 1), constant=False, default=True, instantiate=False, pickle_default_value=True, precedence=None, readonly=False, watchers={} ) - Whether Elements drawing the data from the same object should share their Bokeh data source allowing for linked brushing and other linked behaviors.
-
param ObjectSelector
toolbar( allow_None=None, check_on_set=True, compute_default_fn=None, constant=False, default=right, instantiate=False, names=None, objects=[‘above’, ‘below’, ‘left’, ‘right’, ‘disable’, None], pickle_default_value=True, precedence=None, readonly=False, watchers={} ) - The toolbar location, must be one of ‘above’, ‘below’, ‘left’, ‘right’, None.
-
param List
active_tools( allow_None=False, bounds=(0, None), constant=False, default=[], instantiate=True, pickle_default_value=True, precedence=None, readonly=False, watchers={} ) - Allows specifying which tools are active by default. Note that only one tool per gesture type can be active, e.g. both ‘pan’ and ‘box_zoom’ are drag tools, so if both are listed only the last one will be active.
-
param Number
border( allow_None=False, bounds=None, constant=False, default=10, inclusive_bounds=(True, True), instantiate=False, pickle_default_value=True, precedence=None, readonly=False, softbounds=None, time_dependent=False, time_fn=<Time Time00001>, watchers={} ) - Minimum border around plot.
-
param HookList
finalize_hooks( allow_None=False, bounds=(0, None), constant=False, default=[], instantiate=True, pickle_default_value=True, precedence=None, readonly=False, watchers={} ) - Deprecated; use hooks options instead.
-
param HookList
hooks( allow_None=False, bounds=(0, None), constant=False, default=[], instantiate=True, pickle_default_value=True, precedence=None, readonly=False, watchers={} ) - Optional list of hooks called when finalizing a plot. The hook is passed the plot object and the displayed element, and other plotting handles can be accessed via plot.handles.
-
param Dict
gridstyle( allow_None=False, constant=False, default={}, instantiate=True, is_instance=True, pickle_default_value=True, precedence=None, readonly=False, watchers={} ) - Allows customizing the grid style, e.g. grid_line_color defines the line color for both grids while xgrid_line_color exclusively customizes the x-axis grid lines.
-
param List
labelled( allow_None=False, bounds=(0, None), constant=False, default=[‘x’, ‘y’], instantiate=True, pickle_default_value=True, precedence=None, readonly=False, watchers={} ) - Whether to plot the ‘x’ and ‘y’ labels.
-
param Dict
lod( allow_None=False, constant=False, default={‘factor’: 10, ‘interval’: 300, ‘threshold’: 2000, ‘timeout’: 500}, instantiate=True, is_instance=True, pickle_default_value=True, precedence=None, readonly=False, watchers={} ) - Bokeh plots offer “Level of Detail” (LOD) capability to accommodate large (but not huge) amounts of data. The available options are: * factor - Decimation factor to use when applying decimation. * interval - Interval (in ms) downsampling will be enabled after an interactive event. * threshold - Number of samples before downsampling is enabled. * timeout - Timeout (in ms) for checking whether interactive tool events are still occurring.
-
param Boolean
show_frame( allow_None=False, bounds=(0, 1), constant=False, default=True, instantiate=False, pickle_default_value=True, precedence=None, readonly=False, watchers={} ) - Whether or not to show a complete frame around the plot.
-
param Boolean
shared_axes( allow_None=False, bounds=(0, 1), constant=False, default=True, instantiate=False, pickle_default_value=True, precedence=None, readonly=False, watchers={} ) - Whether to invert the share axes across plots for linked panning and zooming.
-
param List
default_tools( allow_None=False, bounds=(0, None), constant=False, default=[‘save’, ‘pan’, ‘wheel_zoom’, ‘box_zoom’, ‘reset’], instantiate=True, pickle_default_value=True, precedence=None, readonly=False, watchers={} ) - A list of plugin tools to use on the plot.
-
param List
tools( allow_None=False, bounds=(0, None), constant=False, default=[], instantiate=True, pickle_default_value=True, precedence=None, readonly=False, watchers={} ) - A list of plugin tools to use on the plot.
-
param ClassSelector
xformatter( allow_None=True, constant=False, default=None, instantiate=True, is_instance=True, pickle_default_value=True, precedence=None, readonly=False, watchers={} ) - Formatter for ticks along the x-axis.
-
param ClassSelector
yformatter( allow_None=True, constant=False, default=None, instantiate=True, is_instance=True, pickle_default_value=True, precedence=None, readonly=False, watchers={} ) - Formatter for ticks along the x-axis.
-
param ObjectSelector
legend_position( allow_None=None, check_on_set=True, compute_default_fn=None, constant=False, default=top_right, instantiate=False, names=None, objects=[‘top_right’, ‘top_left’, ‘bottom_left’, ‘bottom_right’, ‘right’, ‘left’, ‘top’, ‘bottom’], pickle_default_value=True, precedence=None, readonly=False, watchers={} ) - Allows selecting between a number of predefined legend position options. The predefined options may be customized in the legend_specs class attribute.
-
param Boolean
legend_muted( allow_None=False, bounds=(0, 1), constant=False, default=False, instantiate=False, pickle_default_value=True, precedence=None, readonly=False, watchers={} ) - Controls whether the legend entries are muted by default.
-
param NumericTuple
legend_offset( allow_None=False, constant=False, default=(0, 0), instantiate=False, length=2, pickle_default_value=True, precedence=None, readonly=False, watchers={} ) - If legend is placed outside the axis, this determines the (width, height) offset in pixels from the original position.
-
param Integer
legend_cols( allow_None=False, bounds=None, constant=False, default=False, inclusive_bounds=(True, True), instantiate=False, pickle_default_value=True, precedence=None, readonly=False, softbounds=None, time_dependent=False, time_fn=<Time Time00001>, watchers={} ) - Whether to lay out the legend as columns.
-
param ClassSelector
color_levels( allow_None=True, constant=False, default=None, instantiate=True, is_instance=True, pickle_default_value=True, precedence=None, readonly=False, watchers={} ) - Number of discrete colors to use when colormapping or a set of color intervals defining the range of values to map each color to.
-
param Boolean
colorbar( allow_None=False, bounds=(0, 1), constant=False, default=False, instantiate=False, pickle_default_value=True, precedence=None, readonly=False, watchers={} ) - Whether to display a colorbar.
-
param ObjectSelector
colorbar_position( allow_None=None, check_on_set=True, compute_default_fn=None, constant=False, default=right, instantiate=False, names=None, objects=[‘right’, ‘left’, ‘bottom’, ‘top’, ‘top_right’, ‘top_left’, ‘bottom_left’, ‘bottom_right’], pickle_default_value=True, precedence=None, readonly=False, watchers={} ) - Allows selecting between a number of predefined colorbar position options. The predefined options may be customized in the colorbar_specs class attribute.
-
param Dict
colorbar_opts( allow_None=False, constant=False, default={}, instantiate=True, is_instance=True, pickle_default_value=True, precedence=None, readonly=False, watchers={} ) - Allows setting specific styling options for the colorbar overriding the options defined in the colorbar_specs class attribute. Includes location, orientation, height, width, scale_alpha, title, title_props, margin, padding, background_fill_color and more.
-
param Dict
clipping_colors( allow_None=False, constant=False, default={}, instantiate=True, is_instance=True, pickle_default_value=True, precedence=None, readonly=False, watchers={} ) - Dictionary to specify colors for clipped values, allows setting color for NaN values and for values above and below the min and max value. The min, max or NaN color may specify an RGB(A) color as a color hex string of the form #FFFFFF or #FFFFFFFF or a length 3 or length 4 tuple specifying values in the range 0-1 or a named HTML color.
-
param Boolean
logz( allow_None=False, bounds=(0, 1), constant=False, default=False, instantiate=False, pickle_default_value=True, precedence=None, readonly=False, watchers={} ) - Whether to apply log scaling to the z-axis.
-
param Boolean
symmetric( allow_None=False, bounds=(0, 1), constant=False, default=False, instantiate=False, pickle_default_value=True, precedence=None, readonly=False, watchers={} ) - Whether to make the colormap symmetric around zero.
-
param Boolean
stacked( allow_None=False, bounds=(0, 1), constant=False, default=False, instantiate=False, pickle_default_value=True, precedence=None, readonly=False, watchers={} ) - Whether the bars should be stacked or grouped.
-
param ClassSelector
color_index( allow_None=True, constant=False, default=None, instantiate=True, is_instance=True, pickle_default_value=True, precedence=None, readonly=False, watchers={} ) - Deprecated in favor of color style mapping, e.g. color=dim(‘color’)
-
param ClassSelector
group_index( allow_None=True, constant=False, default=1, instantiate=True, is_instance=True, pickle_default_value=True, precedence=None, readonly=False, watchers={} ) - Deprecated; use stacked option instead.
-
param ClassSelector
stack_index( allow_None=True, constant=False, default=None, instantiate=True, is_instance=True, pickle_default_value=True, precedence=None, readonly=False, watchers={} ) - Deprecated; use stacked option instead.
-
cleanup( ) ¶ -
Cleans up references to the plot after the plot has been deleted. Traverses through all plots cleaning up Callbacks and Stream subscribers.
-
compute_ranges( obj , key , ranges ) ¶ -
Given an object, a specific key, and the normalization options, this method will find the specified normalization options on the appropriate OptionTree, group the elements according to the selected normalization option (i.e. either per frame or over the whole animation) and finally compute the dimension ranges in each group. The new set of ranges is returned.
-
current_handles¶ -
Should return a list of plot objects that have changed and should be updated.
-
debug( *args , **kwargs ) ¶ -
Inspect .param.debug method for the full docstring
-
defaults( *args , **kwargs ) ¶ -
Inspect .param.defaults method for the full docstring
-
force_new_dynamic_value= functools.partial(<function Parameters.deprecate.<locals>.inner>, <class 'holoviews.plotting.bokeh.chart.BarPlot'>) 
-
framewise¶ -
Property to determine whether the current frame should have framewise normalization enabled. Required for bokeh plotting classes to determine whether to send updated ranges for each frame.
-
get_aspect( xspan , yspan ) ¶ -
Computes the aspect ratio of the plot
-
get_extents( element , ranges , range_type='combined' ) [source] ¶ -
Make adjustments to plot extents by computing stacked bar heights, adjusting the bar baseline and forcing the x-axis to be categorical.
-
get_padding( extents ) ¶ -
Computes padding along the axes taking into account the plot aspect.
-
get_param_values= functools.partial(<function Parameters.deprecate.<locals>.inner>, <class 'holoviews.plotting.bokeh.chart.BarPlot'>) 
-
get_stack( xvals , yvals , baselines , sign='positive' ) [source] ¶ -
Iterates over a x- and y-values in a stack layer and appropriately offsets the layer on top of the previous layer.
-
get_value_generator= functools.partial(<function Parameters.deprecate.<locals>.inner>, <class 'holoviews.plotting.bokeh.chart.BarPlot'>) 
-
get_zorder( overlay , key , el ) ¶ -
Computes the z-order of element in the NdOverlay taking into account possible batching of elements.
-
init_comm( ) ¶ -
Initializes comm and attaches streams.
-
initialize_plot( ranges=None , plot=None , plots=None , source=None ) ¶ -
Initializes a new plot object with the last available frame.
-
inspect_value= functools.partial(<function Parameters.deprecate.<locals>.inner>, <class 'holoviews.plotting.bokeh.chart.BarPlot'>) 
-
link_sources¶ -
Returns potential Link or Stream sources.
-
matches( spec ) ¶ -
Matches a specification against the current Plot.
-
message( *args , **kwargs ) ¶ -
Inspect .param.message method for the full docstring
-
model_changed( model ) ¶ -
Determines if the bokeh model was just changed on the frontend. Useful to suppress boomeranging events, e.g. when the frontend just sent an update to the x_range this should not trigger an update on the backend.
-
params( *args , **kwargs ) ¶ -
Inspect .param.params method for the full docstring
-
pprint( imports=None , prefix=' ' , unknown_value='<?>' , qualify=False , separator='' ) ¶ -
(Experimental) Pretty printed representation that may be evaluated with eval. See pprint() function for more details.
-
print_param_defaults( *args , **kwargs ) ¶ -
Inspect .param.print_param_defaults method for the full docstring
-
print_param_values( *args , **kwargs ) ¶ -
Inspect .param.print_param_values method for the full docstring
-
push( ) ¶ -
Pushes updated plot data via the Comm.
-
refresh( **kwargs ) ¶ -
Refreshes the plot by rerendering it and then pushing the updated data if the plot has an associated Comm.
-
script_repr( imports=[] , prefix=' ' ) ¶ -
Variant of __repr__ designed for generating a runnable script.
-
set_default( *args , **kwargs ) ¶ -
Inspect .param.set_default method for the full docstring
-
set_dynamic_time_fn= functools.partial(<function Parameters.deprecate.<locals>.inner>, <class 'holoviews.plotting.bokeh.chart.BarPlot'>) 
-
set_param= functools.partial(<function Parameters.deprecate.<locals>.inner>, <class 'holoviews.plotting.bokeh.chart.BarPlot'>) 
-
set_root( root ) ¶ -
Sets the root model on all subplots.
-
state¶ -
The plotting state that gets updated via the update method and used by the renderer to generate output.
-
state_pop( ) ¶ -
Restore the most recently saved state.
See state_push() for more details.
-
state_push( ) ¶ -
Save this instance’s state.
For Parameterized instances, this includes the state of dynamically generated values.
Subclasses that maintain short-term state should additionally save and restore that state using state_push() and state_pop().
Generally, this method is used by operations that need to test something without permanently altering the objects’ state.
-
sync_sources( ) ¶ -
Syncs data sources between Elements, which draw data from the same object.
-
traverse( fn=None , specs=None , full_breadth=True ) ¶ -
Traverses any nested DimensionedPlot returning a list of all plots that match the specs. The specs should be supplied as a list of either Plot types or callables, which should return a boolean given the plot class.
-
update_frame( key , ranges=None , plot=None , element=None ) ¶ -
Updates an existing plot with data corresponding to the key.
-
verbose( *args , **kwargs ) ¶ -
Inspect .param.verbose method for the full docstring
-
warning( *args , **kwargs ) ¶ -
Inspect .param.warning method for the full docstring
-
param Parameter
-
class
holoviews.plotting.bokeh.chart.SideSpikesPlot( element , plot=None , **params ) [source] ¶ -
Bases:
holoviews.plotting.bokeh.chart.SpikesPlotSpikesPlot with useful defaults for plotting adjoined rug plot.
-
param Parameter
fontsize( allow_None=True, constant=False, default={‘title’: ‘12pt’}, instantiate=False, pickle_default_value=True, precedence=None, readonly=False, watchers={} ) - Specifies various fontsizes of the displayed text. Finer control is available by supplying a dictionary where any unmentioned keys reverts to the default sizes, e.g: {‘ticks’: ‘20pt’, ‘title’: ‘15pt’, ‘ylabel’: ‘5px’, ‘xlabel’: ‘5px’}
-
param Boolean
show_title( allow_None=False, bounds=(0, 1), constant=False, default=True, instantiate=False, pickle_default_value=True, precedence=None, readonly=False, watchers={} ) - Whether to display the plot title.
-
param String
title( allow_None=False, basestring=<class ‘str’>, constant=False, default={label} {group} {dimensions}, instantiate=False, pickle_default_value=True, precedence=None, readonly=False, regex=None, watchers={} ) - The formatting string for the title of this plot, allows defining a label group separator and dimension labels.
-
param String
title_format( allow_None=True, basestring=<class ‘str’>, constant=False, default=None, instantiate=False, pickle_default_value=True, precedence=None, readonly=False, regex=None, watchers={} ) - Alias for title.
-
param Boolean
normalize( allow_None=False, bounds=(0, 1), constant=False, default=True, instantiate=False, pickle_default_value=True, precedence=None, readonly=False, watchers={} ) - Whether to compute ranges across all Elements at this level of plotting. Allows selecting normalization at different levels for nested data containers.
-
param Parameter
projection( allow_None=True, constant=False, default=None, instantiate=False, pickle_default_value=True, precedence=None, readonly=False, watchers={} ) - Allows supplying a custom projection to transform the axis coordinates during display. Example projections include ‘3d’ and ‘polar’ projections supported by some backends. Depending on the backend custom, projection objects may be supplied.
-
param Boolean
apply_ranges( allow_None=False, bounds=(0, 1), constant=False, default=True, instantiate=False, pickle_default_value=True, precedence=None, readonly=False, watchers={} ) - Whether to compute the plot bounds from the data itself.
-
param Boolean
apply_extents( allow_None=False, bounds=(0, 1), constant=False, default=True, instantiate=False, pickle_default_value=True, precedence=None, readonly=False, watchers={} ) - Whether to apply extent overrides on the Elements
-
param ClassSelector
bgcolor( allow_None=True, constant=False, default=None, instantiate=True, is_instance=True, pickle_default_value=True, precedence=None, readonly=False, watchers={} ) - If set bgcolor overrides the background color of the axis.
-
param ClassSelector
default_span( allow_None=False, constant=False, default=2.0, instantiate=True, is_instance=True, pickle_default_value=True, precedence=None, readonly=False, watchers={} ) - Defines the span of an axis if the axis range is zero, i.e. if the lower and upper end of an axis are equal or no range is defined at all. For example if there is a single datapoint at 0 a default_span of 2.0 will result in axis ranges spanning from -1 to 1.
-
param Boolean
invert_axes( allow_None=False, bounds=(0, 1), constant=False, default=False, instantiate=False, pickle_default_value=True, precedence=None, readonly=False, watchers={} ) - Whether to invert the x- and y-axis
-
param Boolean
invert_xaxis( allow_None=False, bounds=(0, 1), constant=False, default=False, instantiate=False, pickle_default_value=True, precedence=None, readonly=False, watchers={} ) - Whether to invert the plot x-axis.
-
param Boolean
invert_yaxis( allow_None=False, bounds=(0, 1), constant=False, default=False, instantiate=False, pickle_default_value=True, precedence=None, readonly=False, watchers={} ) - Whether to invert the plot y-axis.
-
param Boolean
logx( allow_None=False, bounds=(0, 1), constant=False, default=False, instantiate=False, pickle_default_value=True, precedence=None, readonly=False, watchers={} ) - Whether the x-axis of the plot will be a log axis.
-
param Boolean
logy( allow_None=False, bounds=(0, 1), constant=False, default=False, instantiate=False, pickle_default_value=True, precedence=None, readonly=False, watchers={} ) - Whether the y-axis of the plot will be a log axis.
-
param ClassSelector
padding( allow_None=False, constant=False, default=0, instantiate=True, is_instance=True, pickle_default_value=True, precedence=None, readonly=False, watchers={} ) - Fraction by which to increase auto-ranged extents to make datapoints more visible around borders. To compute padding, the axis whose screen size is largest is chosen, and the range of that axis is increased by the specified fraction along each axis. Other axes are then padded ensuring that the amount of screen space devoted to padding is equal for all axes. If specified as a tuple, the int or float values in the tuple will be used for padding in each axis, in order (x,y or x,y,z). For example, for padding=0.2 on a 800x800-pixel plot, an x-axis with the range [0,10] will be padded by 20% to be [-1,11], while a y-axis with a range [0,1000] will be padded to be [-100,1100], which should make the padding be approximately the same number of pixels. But if the same plot is changed to have a height of only 200, the y-range will then be [-400,1400] so that the y-axis padding will still match that of the x-axis. It is also possible to declare non-equal padding value for the lower and upper bound of an axis by supplying nested tuples, e.g. padding=(0.1, (0, 0.1)) will pad the x-axis lower and upper bound as well as the y-axis upper bound by a fraction of 0.1 while the y-axis lower bound is not padded at all.
-
param Boolean
show_legend( allow_None=False, bounds=(0, 1), constant=False, default=True, instantiate=False, pickle_default_value=True, precedence=None, readonly=False, watchers={} ) - Whether to show legend for the plot.
-
param Boolean
show_grid( allow_None=False, bounds=(0, 1), constant=False, default=False, instantiate=False, pickle_default_value=True, precedence=None, readonly=False, watchers={} ) - Whether to show a Cartesian grid on the plot.
-
param ObjectSelector
xaxis( allow_None=None, check_on_set=True, compute_default_fn=None, constant=False, default=top-bare, instantiate=False, names=None, objects=[‘top’, ‘bottom’, ‘bare’, ‘top-bare’, ‘bottom-bare’, None], pickle_default_value=True, precedence=None, readonly=False, watchers={} ) - Whether and where to display the xaxis, bare options allow suppressing all axis labels including ticks and xlabel. Valid options are ‘top’, ‘bottom’, ‘bare’, ‘top-bare’ and ‘bottom-bare’.
-
param ObjectSelector
yaxis( allow_None=None, check_on_set=True, compute_default_fn=None, constant=False, default=right-bare, instantiate=False, names=None, objects=[‘left’, ‘right’, ‘bare’, ‘left-bare’, ‘right-bare’, None], pickle_default_value=True, precedence=None, readonly=False, watchers={} ) - Whether and where to display the yaxis, bare options allow suppressing all axis labels including ticks and ylabel. Valid options are ‘left’, ‘right’, ‘bare’ ‘left-bare’ and ‘right-bare’.
-
param String
xlabel( allow_None=True, basestring=<class ‘str’>, constant=False, default=None, instantiate=False, pickle_default_value=True, precedence=None, readonly=False, regex=None, watchers={} ) - An explicit override of the x-axis label, if set takes precedence over the dimension label.
-
param String
ylabel( allow_None=True, basestring=<class ‘str’>, constant=False, default=None, instantiate=False, pickle_default_value=True, precedence=None, readonly=False, regex=None, watchers={} ) - An explicit override of the y-axis label, if set takes precedence over the dimension label.
-
param NumericTuple
xlim( allow_None=False, constant=False, default=(nan, nan), instantiate=False, length=2, pickle_default_value=True, precedence=None, readonly=False, watchers={} ) - User-specified x-axis range limits for the plot, as a tuple (low,high). If specified, takes precedence over data and dimension ranges.
-
param NumericTuple
ylim( allow_None=False, constant=False, default=(nan, nan), instantiate=False, length=2, pickle_default_value=True, precedence=None, readonly=False, watchers={} ) - User-specified x-axis range limits for the plot, as a tuple (low,high). If specified, takes precedence over data and dimension ranges.
-
param NumericTuple
zlim( allow_None=False, constant=False, default=(nan, nan), instantiate=False, length=2, pickle_default_value=True, precedence=None, readonly=False, watchers={} ) - User-specified z-axis range limits for the plot, as a tuple (low,high). If specified, takes precedence over data and dimension ranges.
-
param Integer
xrotation( allow_None=True, bounds=(0, 360), constant=False, default=None, inclusive_bounds=(True, True), instantiate=False, pickle_default_value=True, precedence=None, readonly=False, softbounds=None, time_dependent=False, time_fn=<Time Time00001>, watchers={} ) - Rotation angle of the xticks.
-
param Integer
yrotation( allow_None=True, bounds=(0, 360), constant=False, default=None, inclusive_bounds=(True, True), instantiate=False, pickle_default_value=True, precedence=None, readonly=False, softbounds=None, time_dependent=False, time_fn=<Time Time00001>, watchers={} ) - Rotation angle of the yticks.
-
param Parameter
xticks( allow_None=True, constant=False, default=None, instantiate=False, pickle_default_value=True, precedence=None, readonly=False, watchers={} ) - Ticks along x-axis specified as an integer, explicit list of tick locations, or bokeh Ticker object. If set to None default bokeh ticking behavior is applied.
-
param Parameter
yticks( allow_None=True, constant=False, default=None, instantiate=False, pickle_default_value=True, precedence=None, readonly=False, watchers={} ) - Ticks along y-axis specified as an integer, explicit list of tick locations, or bokeh Ticker object. If set to None default bokeh ticking behavior is applied.
-
param Integer
width( allow_None=False, bounds=None, constant=False, default=50, inclusive_bounds=(True, True), instantiate=False, pickle_default_value=True, precedence=None, readonly=False, softbounds=None, time_dependent=False, time_fn=<Time Time00001>, watchers={} ) - Width of plot
-
param Integer
height( allow_None=False, bounds=None, constant=False, default=50, inclusive_bounds=(True, True), instantiate=False, pickle_default_value=True, precedence=None, readonly=False, softbounds=None, time_dependent=False, time_fn=<Time Time00001>, watchers={} ) - Height of plot
-
param ObjectSelector
sizing_mode( allow_None=None, check_on_set=True, compute_default_fn=None, constant=False, default=fixed, instantiate=False, names=None, objects=[‘fixed’, ‘stretch_both’, ‘scale_width’, ‘scale_height’, ‘scale_both’], pickle_default_value=True, precedence=None, readonly=False, watchers={} ) - How the item being displayed should size itself. “stretch_both” plots will resize to occupy all available space, even if this changes the aspect ratio of the element. “fixed” plots are not responsive and will retain their original width and height regardless of any subsequent browser window resize events. “scale_width” elements will responsively resize to fit to the width available, while maintaining the original aspect ratio. “scale_height” elements will responsively resize to fit to the height available, while maintaining the original aspect ratio. “scale_both” elements will responsively resize to for both the width and height available, while maintaining the original aspect ratio.
-
param Boolean
shared_datasource( allow_None=False, bounds=(0, 1), constant=False, default=True, instantiate=False, pickle_default_value=True, precedence=None, readonly=False, watchers={} ) - Whether Elements drawing the data from the same object should share their Bokeh data source allowing for linked brushing and other linked behaviors.
-
param ObjectSelector
toolbar( allow_None=None, check_on_set=True, compute_default_fn=None, constant=False, default=right, instantiate=False, names=None, objects=[‘above’, ‘below’, ‘left’, ‘right’, ‘disable’, None], pickle_default_value=True, precedence=None, readonly=False, watchers={} ) - The toolbar location, must be one of ‘above’, ‘below’, ‘left’, ‘right’, None.
-
param List
active_tools( allow_None=False, bounds=(0, None), constant=False, default=[], instantiate=True, pickle_default_value=True, precedence=None, readonly=False, watchers={} ) - Allows specifying which tools are active by default. Note that only one tool per gesture type can be active, e.g. both ‘pan’ and ‘box_zoom’ are drag tools, so if both are listed only the last one will be active.
-
param Integer
border( allow_None=False, bounds=None, constant=False, default=5, inclusive_bounds=(True, True), instantiate=False, pickle_default_value=True, precedence=None, readonly=False, softbounds=None, time_dependent=False, time_fn=<Time Time00001>, watchers={} ) - Default borders on plot
-
param HookList
finalize_hooks( allow_None=False, bounds=(0, None), constant=False, default=[], instantiate=True, pickle_default_value=True, precedence=None, readonly=False, watchers={} ) - Deprecated; use hooks options instead.
-
param HookList
hooks( allow_None=False, bounds=(0, None), constant=False, default=[], instantiate=True, pickle_default_value=True, precedence=None, readonly=False, watchers={} ) - Optional list of hooks called when finalizing a plot. The hook is passed the plot object and the displayed element, and other plotting handles can be accessed via plot.handles.
-
param Dict
gridstyle( allow_None=False, constant=False, default={}, instantiate=True, is_instance=True, pickle_default_value=True, precedence=None, readonly=False, watchers={} ) - Allows customizing the grid style, e.g. grid_line_color defines the line color for both grids while xgrid_line_color exclusively customizes the x-axis grid lines.
-
param List
labelled( allow_None=False, bounds=(0, None), constant=False, default=[‘x’, ‘y’], instantiate=True, pickle_default_value=True, precedence=None, readonly=False, watchers={} ) - Whether to plot the ‘x’ and ‘y’ labels.
-
param Dict
lod( allow_None=False, constant=False, default={‘factor’: 10, ‘interval’: 300, ‘threshold’: 2000, ‘timeout’: 500}, instantiate=True, is_instance=True, pickle_default_value=True, precedence=None, readonly=False, watchers={} ) - Bokeh plots offer “Level of Detail” (LOD) capability to accommodate large (but not huge) amounts of data. The available options are: * factor - Decimation factor to use when applying decimation. * interval - Interval (in ms) downsampling will be enabled after an interactive event. * threshold - Number of samples before downsampling is enabled. * timeout - Timeout (in ms) for checking whether interactive tool events are still occurring.
-
param Boolean
show_frame( allow_None=False, bounds=(0, 1), constant=False, default=True, instantiate=False, pickle_default_value=True, precedence=None, readonly=False, watchers={} ) - Whether or not to show a complete frame around the plot.
-
param Boolean
shared_axes( allow_None=False, bounds=(0, 1), constant=False, default=True, instantiate=False, pickle_default_value=True, precedence=None, readonly=False, watchers={} ) - Whether to invert the share axes across plots for linked panning and zooming.
-
param List
default_tools( allow_None=False, bounds=(0, None), constant=False, default=[‘save’, ‘pan’, ‘wheel_zoom’, ‘box_zoom’, ‘reset’], instantiate=True, pickle_default_value=True, precedence=None, readonly=False, watchers={} ) - A list of plugin tools to use on the plot.
-
param List
tools( allow_None=False, bounds=(0, None), constant=False, default=[], instantiate=True, pickle_default_value=True, precedence=None, readonly=False, watchers={} ) - A list of plugin tools to use on the plot.
-
param ClassSelector
xformatter( allow_None=True, constant=False, default=None, instantiate=True, is_instance=True, pickle_default_value=True, precedence=None, readonly=False, watchers={} ) - Formatter for ticks along the x-axis.
-
param ClassSelector
yformatter( allow_None=True, constant=False, default=None, instantiate=True, is_instance=True, pickle_default_value=True, precedence=None, readonly=False, watchers={} ) - Formatter for ticks along the x-axis.
-
param ClassSelector
color_levels( allow_None=True, constant=False, default=None, instantiate=True, is_instance=True, pickle_default_value=True, precedence=None, readonly=False, watchers={} ) - Number of discrete colors to use when colormapping or a set of color intervals defining the range of values to map each color to.
-
param Boolean
colorbar( allow_None=False, bounds=(0, 1), constant=False, default=False, instantiate=False, pickle_default_value=True, precedence=None, readonly=False, watchers={} ) - Whether to display a colorbar.
-
param ObjectSelector
colorbar_position( allow_None=None, check_on_set=True, compute_default_fn=None, constant=False, default=right, instantiate=False, names=None, objects=[‘right’, ‘left’, ‘bottom’, ‘top’, ‘top_right’, ‘top_left’, ‘bottom_left’, ‘bottom_right’], pickle_default_value=True, precedence=None, readonly=False, watchers={} ) - Allows selecting between a number of predefined colorbar position options. The predefined options may be customized in the colorbar_specs class attribute.
-
param Dict
colorbar_opts( allow_None=False, constant=False, default={}, instantiate=True, is_instance=True, pickle_default_value=True, precedence=None, readonly=False, watchers={} ) - Allows setting specific styling options for the colorbar overriding the options defined in the colorbar_specs class attribute. Includes location, orientation, height, width, scale_alpha, title, title_props, margin, padding, background_fill_color and more.
-
param Dict
clipping_colors( allow_None=False, constant=False, default={}, instantiate=True, is_instance=True, pickle_default_value=True, precedence=None, readonly=False, watchers={} ) - Dictionary to specify colors for clipped values, allows setting color for NaN values and for values above and below the min and max value. The min, max or NaN color may specify an RGB(A) color as a color hex string of the form #FFFFFF or #FFFFFFFF or a length 3 or length 4 tuple specifying values in the range 0-1 or a named HTML color.
-
param Boolean
logz( allow_None=False, bounds=(0, 1), constant=False, default=False, instantiate=False, pickle_default_value=True, precedence=None, readonly=False, watchers={} ) - Whether to apply log scaling to the z-axis.
-
param Boolean
symmetric( allow_None=False, bounds=(0, 1), constant=False, default=False, instantiate=False, pickle_default_value=True, precedence=None, readonly=False, watchers={} ) - Whether to make the colormap symmetric around zero.
-
param Number
spike_length( allow_None=False, bounds=None, constant=False, default=0.5, inclusive_bounds=(True, True), instantiate=False, pickle_default_value=True, precedence=None, readonly=False, softbounds=None, time_dependent=False, time_fn=<Time Time00001>, watchers={} ) - The length of each spike if Spikes object is one dimensional.
-
param Number
position( allow_None=False, bounds=None, constant=False, default=0.0, inclusive_bounds=(True, True), instantiate=False, pickle_default_value=True, precedence=None, readonly=False, softbounds=None, time_dependent=False, time_fn=<Time Time00001>, watchers={} ) - The position of the lower end of each spike.
-
param ClassSelector
color_index( allow_None=True, constant=False, default=None, instantiate=True, is_instance=True, pickle_default_value=True, precedence=None, readonly=False, watchers={} ) - Deprecated in favor of color style mapping, e.g. color=dim(‘color’)
-
cleanup( ) ¶ -
Cleans up references to the plot after the plot has been deleted. Traverses through all plots cleaning up Callbacks and Stream subscribers.
-
compute_ranges( obj , key , ranges ) ¶ -
Given an object, a specific key, and the normalization options, this method will find the specified normalization options on the appropriate OptionTree, group the elements according to the selected normalization option (i.e. either per frame or over the whole animation) and finally compute the dimension ranges in each group. The new set of ranges is returned.
-
current_handles¶ -
Should return a list of plot objects that have changed and should be updated.
-
debug( *args , **kwargs ) ¶ -
Inspect .param.debug method for the full docstring
-
defaults( *args , **kwargs ) ¶ -
Inspect .param.defaults method for the full docstring
-
force_new_dynamic_value= functools.partial(<function Parameters.deprecate.<locals>.inner>, <class 'holoviews.plotting.bokeh.chart.SideSpikesPlot'>) 
-
framewise¶ -
Property to determine whether the current frame should have framewise normalization enabled. Required for bokeh plotting classes to determine whether to send updated ranges for each frame.
-
get_aspect( xspan , yspan ) ¶ -
Computes the aspect ratio of the plot
-
get_padding( extents ) ¶ -
Computes padding along the axes taking into account the plot aspect.
-
get_param_values= functools.partial(<function Parameters.deprecate.<locals>.inner>, <class 'holoviews.plotting.bokeh.chart.SideSpikesPlot'>) 
-
get_value_generator= functools.partial(<function Parameters.deprecate.<locals>.inner>, <class 'holoviews.plotting.bokeh.chart.SideSpikesPlot'>) 
-
get_zorder( overlay , key , el ) ¶ -
Computes the z-order of element in the NdOverlay taking into account possible batching of elements.
-
init_comm( ) ¶ -
Initializes comm and attaches streams.
-
initialize_plot( ranges=None , plot=None , plots=None , source=None ) ¶ -
Initializes a new plot object with the last available frame.
-
inspect_value= functools.partial(<function Parameters.deprecate.<locals>.inner>, <class 'holoviews.plotting.bokeh.chart.SideSpikesPlot'>) 
-
link_sources¶ -
Returns potential Link or Stream sources.
-
matches( spec ) ¶ -
Matches a specification against the current Plot.
-
message( *args , **kwargs ) ¶ -
Inspect .param.message method for the full docstring
-
model_changed( model ) ¶ -
Determines if the bokeh model was just changed on the frontend. Useful to suppress boomeranging events, e.g. when the frontend just sent an update to the x_range this should not trigger an update on the backend.
-
params( *args , **kwargs ) ¶ -
Inspect .param.params method for the full docstring
-
pprint( imports=None , prefix=' ' , unknown_value='<?>' , qualify=False , separator='' ) ¶ -
(Experimental) Pretty printed representation that may be evaluated with eval. See pprint() function for more details.
-
print_param_defaults( *args , **kwargs ) ¶ -
Inspect .param.print_param_defaults method for the full docstring
-
print_param_values( *args , **kwargs ) ¶ -
Inspect .param.print_param_values method for the full docstring
-
push( ) ¶ -
Pushes updated plot data via the Comm.
-
refresh( **kwargs ) ¶ -
Refreshes the plot by rerendering it and then pushing the updated data if the plot has an associated Comm.
-
script_repr( imports=[] , prefix=' ' ) ¶ -
Variant of __repr__ designed for generating a runnable script.
-
set_default( *args , **kwargs ) ¶ -
Inspect .param.set_default method for the full docstring
-
set_dynamic_time_fn= functools.partial(<function Parameters.deprecate.<locals>.inner>, <class 'holoviews.plotting.bokeh.chart.SideSpikesPlot'>) 
-
set_param= functools.partial(<function Parameters.deprecate.<locals>.inner>, <class 'holoviews.plotting.bokeh.chart.SideSpikesPlot'>) 
-
set_root( root ) ¶ -
Sets the root model on all subplots.
-
state¶ -
The plotting state that gets updated via the update method and used by the renderer to generate output.
-
state_pop( ) ¶ -
Restore the most recently saved state.
See state_push() for more details.
-
state_push( ) ¶ -
Save this instance’s state.
For Parameterized instances, this includes the state of dynamically generated values.
Subclasses that maintain short-term state should additionally save and restore that state using state_push() and state_pop().
Generally, this method is used by operations that need to test something without permanently altering the objects’ state.
-
sync_sources( ) ¶ -
Syncs data sources between Elements, which draw data from the same object.
-
traverse( fn=None , specs=None , full_breadth=True ) ¶ -
Traverses any nested DimensionedPlot returning a list of all plots that match the specs. The specs should be supplied as a list of either Plot types or callables, which should return a boolean given the plot class.
-
update_frame( key , ranges=None , plot=None , element=None ) ¶ -
Updates an existing plot with data corresponding to the key.
-
verbose( *args , **kwargs ) ¶ -
Inspect .param.verbose method for the full docstring
-
warning( *args , **kwargs ) ¶ -
Inspect .param.warning method for the full docstring
-
param Parameter
element
Module

-
class
holoviews.plotting.bokeh.element.AnnotationPlot[source] ¶ -
Bases:
objectMix-in plotting subclass for AnnotationPlots which do not have a legend.
-
class
holoviews.plotting.bokeh.element.ColorbarPlot( element , plot=None , **params ) [source] ¶ -
Bases:
holoviews.plotting.bokeh.element.ElementPlotColorbarPlot provides methods to create colormappers and colorbar models which can be added to a glyph. Additionally it provides parameters to control the position and other styling options of the colorbar. The default colorbar_position options are defined by the colorbar_specs, but may be overridden by the colorbar_opts.
-
param Parameter
fontsize( allow_None=True, constant=False, default={‘title’: ‘12pt’}, instantiate=False, pickle_default_value=True, precedence=None, readonly=False, watchers={} ) - Specifies various fontsizes of the displayed text. Finer control is available by supplying a dictionary where any unmentioned keys reverts to the default sizes, e.g: {‘ticks’: ‘20pt’, ‘title’: ‘15pt’, ‘ylabel’: ‘5px’, ‘xlabel’: ‘5px’}
-
param Boolean
show_title( allow_None=False, bounds=(0, 1), constant=False, default=True, instantiate=False, pickle_default_value=True, precedence=None, readonly=False, watchers={} ) - Whether to display the plot title.
-
param String
title( allow_None=False, basestring=<class ‘str’>, constant=False, default={label} {group} {dimensions}, instantiate=False, pickle_default_value=True, precedence=None, readonly=False, regex=None, watchers={} ) - The formatting string for the title of this plot, allows defining a label group separator and dimension labels.
-
param String
title_format( allow_None=True, basestring=<class ‘str’>, constant=False, default=None, instantiate=False, pickle_default_value=True, precedence=None, readonly=False, regex=None, watchers={} ) - Alias for title.
-
param Boolean
normalize( allow_None=False, bounds=(0, 1), constant=False, default=True, instantiate=False, pickle_default_value=True, precedence=None, readonly=False, watchers={} ) - Whether to compute ranges across all Elements at this level of plotting. Allows selecting normalization at different levels for nested data containers.
-
param Parameter
projection( allow_None=True, constant=False, default=None, instantiate=False, pickle_default_value=True, precedence=None, readonly=False, watchers={} ) - Allows supplying a custom projection to transform the axis coordinates during display. Example projections include ‘3d’ and ‘polar’ projections supported by some backends. Depending on the backend custom, projection objects may be supplied.
-
param Boolean
apply_ranges( allow_None=False, bounds=(0, 1), constant=False, default=True, instantiate=False, pickle_default_value=True, precedence=None, readonly=False, watchers={} ) - Whether to compute the plot bounds from the data itself.
-
param Boolean
apply_extents( allow_None=False, bounds=(0, 1), constant=False, default=True, instantiate=False, pickle_default_value=True, precedence=None, readonly=False, watchers={} ) - Whether to apply extent overrides on the Elements
-
param ClassSelector
bgcolor( allow_None=True, constant=False, default=None, instantiate=True, is_instance=True, pickle_default_value=True, precedence=None, readonly=False, watchers={} ) - If set bgcolor overrides the background color of the axis.
-
param ClassSelector
default_span( allow_None=False, constant=False, default=2.0, instantiate=True, is_instance=True, pickle_default_value=True, precedence=None, readonly=False, watchers={} ) - Defines the span of an axis if the axis range is zero, i.e. if the lower and upper end of an axis are equal or no range is defined at all. For example if there is a single datapoint at 0 a default_span of 2.0 will result in axis ranges spanning from -1 to 1.
-
param Boolean
invert_axes( allow_None=False, bounds=(0, 1), constant=False, default=False, instantiate=False, pickle_default_value=True, precedence=None, readonly=False, watchers={} ) - Whether to invert the x- and y-axis
-
param Boolean
invert_xaxis( allow_None=False, bounds=(0, 1), constant=False, default=False, instantiate=False, pickle_default_value=True, precedence=None, readonly=False, watchers={} ) - Whether to invert the plot x-axis.
-
param Boolean
invert_yaxis( allow_None=False, bounds=(0, 1), constant=False, default=False, instantiate=False, pickle_default_value=True, precedence=None, readonly=False, watchers={} ) - Whether to invert the plot y-axis.
-
param Boolean
logx( allow_None=False, bounds=(0, 1), constant=False, default=False, instantiate=False, pickle_default_value=True, precedence=None, readonly=False, watchers={} ) - Whether the x-axis of the plot will be a log axis.
-
param Boolean
logy( allow_None=False, bounds=(0, 1), constant=False, default=False, instantiate=False, pickle_default_value=True, precedence=None, readonly=False, watchers={} ) - Whether the y-axis of the plot will be a log axis.
-
param ClassSelector
padding( allow_None=False, constant=False, default=0, instantiate=True, is_instance=True, pickle_default_value=True, precedence=None, readonly=False, watchers={} ) - Fraction by which to increase auto-ranged extents to make datapoints more visible around borders. To compute padding, the axis whose screen size is largest is chosen, and the range of that axis is increased by the specified fraction along each axis. Other axes are then padded ensuring that the amount of screen space devoted to padding is equal for all axes. If specified as a tuple, the int or float values in the tuple will be used for padding in each axis, in order (x,y or x,y,z). For example, for padding=0.2 on a 800x800-pixel plot, an x-axis with the range [0,10] will be padded by 20% to be [-1,11], while a y-axis with a range [0,1000] will be padded to be [-100,1100], which should make the padding be approximately the same number of pixels. But if the same plot is changed to have a height of only 200, the y-range will then be [-400,1400] so that the y-axis padding will still match that of the x-axis. It is also possible to declare non-equal padding value for the lower and upper bound of an axis by supplying nested tuples, e.g. padding=(0.1, (0, 0.1)) will pad the x-axis lower and upper bound as well as the y-axis upper bound by a fraction of 0.1 while the y-axis lower bound is not padded at all.
-
param Boolean
show_legend( allow_None=False, bounds=(0, 1), constant=False, default=True, instantiate=False, pickle_default_value=True, precedence=None, readonly=False, watchers={} ) - Whether to show legend for the plot.
-
param Boolean
show_grid( allow_None=False, bounds=(0, 1), constant=False, default=False, instantiate=False, pickle_default_value=True, precedence=None, readonly=False, watchers={} ) - Whether to show a Cartesian grid on the plot.
-
param ObjectSelector
xaxis( allow_None=None, check_on_set=True, compute_default_fn=None, constant=False, default=bottom, instantiate=False, names=None, objects=[‘top’, ‘bottom’, ‘bare’, ‘top-bare’, ‘bottom-bare’, None, True, False], pickle_default_value=True, precedence=None, readonly=False, watchers={} ) - Whether and where to display the xaxis. The “bare” options allow suppressing all axis labels, including ticks and xlabel. Valid options are ‘top’, ‘bottom’, ‘bare’, ‘top-bare’ and ‘bottom-bare’.
-
param ObjectSelector
yaxis( allow_None=None, check_on_set=True, compute_default_fn=None, constant=False, default=left, instantiate=False, names=None, objects=[‘left’, ‘right’, ‘bare’, ‘left-bare’, ‘right-bare’, None, True, False], pickle_default_value=True, precedence=None, readonly=False, watchers={} ) - Whether and where to display the yaxis. The “bare” options allow suppressing all axis labels, including ticks and ylabel. Valid options are ‘left’, ‘right’, ‘bare’, ‘left-bare’ and ‘right-bare’.
-
param String
xlabel( allow_None=True, basestring=<class ‘str’>, constant=False, default=None, instantiate=False, pickle_default_value=True, precedence=None, readonly=False, regex=None, watchers={} ) - An explicit override of the x-axis label, if set takes precedence over the dimension label.
-
param String
ylabel( allow_None=True, basestring=<class ‘str’>, constant=False, default=None, instantiate=False, pickle_default_value=True, precedence=None, readonly=False, regex=None, watchers={} ) - An explicit override of the y-axis label, if set takes precedence over the dimension label.
-
param NumericTuple
xlim( allow_None=False, constant=False, default=(nan, nan), instantiate=False, length=2, pickle_default_value=True, precedence=None, readonly=False, watchers={} ) - User-specified x-axis range limits for the plot, as a tuple (low,high). If specified, takes precedence over data and dimension ranges.
-
param NumericTuple
ylim( allow_None=False, constant=False, default=(nan, nan), instantiate=False, length=2, pickle_default_value=True, precedence=None, readonly=False, watchers={} ) - User-specified x-axis range limits for the plot, as a tuple (low,high). If specified, takes precedence over data and dimension ranges.
-
param NumericTuple
zlim( allow_None=False, constant=False, default=(nan, nan), instantiate=False, length=2, pickle_default_value=True, precedence=None, readonly=False, watchers={} ) - User-specified z-axis range limits for the plot, as a tuple (low,high). If specified, takes precedence over data and dimension ranges.
-
param Integer
xrotation( allow_None=True, bounds=(0, 360), constant=False, default=None, inclusive_bounds=(True, True), instantiate=False, pickle_default_value=True, precedence=None, readonly=False, softbounds=None, time_dependent=False, time_fn=<Time Time00001>, watchers={} ) - Rotation angle of the xticks.
-
param Integer
yrotation( allow_None=True, bounds=(0, 360), constant=False, default=None, inclusive_bounds=(True, True), instantiate=False, pickle_default_value=True, precedence=None, readonly=False, softbounds=None, time_dependent=False, time_fn=<Time Time00001>, watchers={} ) - Rotation angle of the yticks.
-
param Parameter
xticks( allow_None=True, constant=False, default=None, instantiate=False, pickle_default_value=True, precedence=None, readonly=False, watchers={} ) - Ticks along x-axis specified as an integer, explicit list of tick locations, or bokeh Ticker object. If set to None default bokeh ticking behavior is applied.
-
param Parameter
yticks( allow_None=True, constant=False, default=None, instantiate=False, pickle_default_value=True, precedence=None, readonly=False, watchers={} ) - Ticks along y-axis specified as an integer, explicit list of tick locations, or bokeh Ticker object. If set to None default bokeh ticking behavior is applied.
-
param Integer
width( allow_None=False, bounds=None, constant=False, default=300, inclusive_bounds=(True, True), instantiate=False, pickle_default_value=True, precedence=None, readonly=False, softbounds=None, time_dependent=False, time_fn=<Time Time00001>, watchers={} ) - Width of the plot in pixels
-
param Integer
height( allow_None=False, bounds=None, constant=False, default=300, inclusive_bounds=(True, True), instantiate=False, pickle_default_value=True, precedence=None, readonly=False, softbounds=None, time_dependent=False, time_fn=<Time Time00001>, watchers={} ) - Height of the plot in pixels
-
param ObjectSelector
sizing_mode( allow_None=None, check_on_set=True, compute_default_fn=None, constant=False, default=fixed, instantiate=False, names=None, objects=[‘fixed’, ‘stretch_both’, ‘scale_width’, ‘scale_height’, ‘scale_both’], pickle_default_value=True, precedence=None, readonly=False, watchers={} ) - How the item being displayed should size itself. “stretch_both” plots will resize to occupy all available space, even if this changes the aspect ratio of the element. “fixed” plots are not responsive and will retain their original width and height regardless of any subsequent browser window resize events. “scale_width” elements will responsively resize to fit to the width available, while maintaining the original aspect ratio. “scale_height” elements will responsively resize to fit to the height available, while maintaining the original aspect ratio. “scale_both” elements will responsively resize to for both the width and height available, while maintaining the original aspect ratio.
-
param Boolean
shared_datasource( allow_None=False, bounds=(0, 1), constant=False, default=True, instantiate=False, pickle_default_value=True, precedence=None, readonly=False, watchers={} ) - Whether Elements drawing the data from the same object should share their Bokeh data source allowing for linked brushing and other linked behaviors.
-
param ObjectSelector
toolbar( allow_None=None, check_on_set=True, compute_default_fn=None, constant=False, default=right, instantiate=False, names=None, objects=[‘above’, ‘below’, ‘left’, ‘right’, ‘disable’, None], pickle_default_value=True, precedence=None, readonly=False, watchers={} ) - The toolbar location, must be one of ‘above’, ‘below’, ‘left’, ‘right’, None.
-
param List
active_tools( allow_None=False, bounds=(0, None), constant=False, default=[], instantiate=True, pickle_default_value=True, precedence=None, readonly=False, watchers={} ) - Allows specifying which tools are active by default. Note that only one tool per gesture type can be active, e.g. both ‘pan’ and ‘box_zoom’ are drag tools, so if both are listed only the last one will be active.
-
param Number
border( allow_None=False, bounds=None, constant=False, default=10, inclusive_bounds=(True, True), instantiate=False, pickle_default_value=True, precedence=None, readonly=False, softbounds=None, time_dependent=False, time_fn=<Time Time00001>, watchers={} ) - Minimum border around plot.
-
param HookList
finalize_hooks( allow_None=False, bounds=(0, None), constant=False, default=[], instantiate=True, pickle_default_value=True, precedence=None, readonly=False, watchers={} ) - Deprecated; use hooks options instead.
-
param HookList
hooks( allow_None=False, bounds=(0, None), constant=False, default=[], instantiate=True, pickle_default_value=True, precedence=None, readonly=False, watchers={} ) - Optional list of hooks called when finalizing a plot. The hook is passed the plot object and the displayed element, and other plotting handles can be accessed via plot.handles.
-
param Dict
gridstyle( allow_None=False, constant=False, default={}, instantiate=True, is_instance=True, pickle_default_value=True, precedence=None, readonly=False, watchers={} ) - Allows customizing the grid style, e.g. grid_line_color defines the line color for both grids while xgrid_line_color exclusively customizes the x-axis grid lines.
-
param List
labelled( allow_None=False, bounds=(0, None), constant=False, default=[‘x’, ‘y’], instantiate=True, pickle_default_value=True, precedence=None, readonly=False, watchers={} ) - Whether to plot the ‘x’ and ‘y’ labels.
-
param Dict
lod( allow_None=False, constant=False, default={‘factor’: 10, ‘interval’: 300, ‘threshold’: 2000, ‘timeout’: 500}, instantiate=True, is_instance=True, pickle_default_value=True, precedence=None, readonly=False, watchers={} ) - Bokeh plots offer “Level of Detail” (LOD) capability to accommodate large (but not huge) amounts of data. The available options are: * factor - Decimation factor to use when applying decimation. * interval - Interval (in ms) downsampling will be enabled after an interactive event. * threshold - Number of samples before downsampling is enabled. * timeout - Timeout (in ms) for checking whether interactive tool events are still occurring.
-
param Boolean
show_frame( allow_None=False, bounds=(0, 1), constant=False, default=True, instantiate=False, pickle_default_value=True, precedence=None, readonly=False, watchers={} ) - Whether or not to show a complete frame around the plot.
-
param Boolean
shared_axes( allow_None=False, bounds=(0, 1), constant=False, default=True, instantiate=False, pickle_default_value=True, precedence=None, readonly=False, watchers={} ) - Whether to invert the share axes across plots for linked panning and zooming.
-
param List
default_tools( allow_None=False, bounds=(0, None), constant=False, default=[‘save’, ‘pan’, ‘wheel_zoom’, ‘box_zoom’, ‘reset’], instantiate=True, pickle_default_value=True, precedence=None, readonly=False, watchers={} ) - A list of plugin tools to use on the plot.
-
param List
tools( allow_None=False, bounds=(0, None), constant=False, default=[], instantiate=True, pickle_default_value=True, precedence=None, readonly=False, watchers={} ) - A list of plugin tools to use on the plot.
-
param ClassSelector
xformatter( allow_None=True, constant=False, default=None, instantiate=True, is_instance=True, pickle_default_value=True, precedence=None, readonly=False, watchers={} ) - Formatter for ticks along the x-axis.
-
param ClassSelector
yformatter( allow_None=True, constant=False, default=None, instantiate=True, is_instance=True, pickle_default_value=True, precedence=None, readonly=False, watchers={} ) - Formatter for ticks along the x-axis.
-
param ClassSelector
color_levels( allow_None=True, constant=False, default=None, instantiate=True, is_instance=True, pickle_default_value=True, precedence=None, readonly=False, watchers={} ) - Number of discrete colors to use when colormapping or a set of color intervals defining the range of values to map each color to.
-
param Boolean
colorbar( allow_None=False, bounds=(0, 1), constant=False, default=False, instantiate=False, pickle_default_value=True, precedence=None, readonly=False, watchers={} ) - Whether to display a colorbar.
-
param ObjectSelector
colorbar_position( allow_None=None, check_on_set=True, compute_default_fn=None, constant=False, default=right, instantiate=False, names=None, objects=[‘right’, ‘left’, ‘bottom’, ‘top’, ‘top_right’, ‘top_left’, ‘bottom_left’, ‘bottom_right’], pickle_default_value=True, precedence=None, readonly=False, watchers={} ) - Allows selecting between a number of predefined colorbar position options. The predefined options may be customized in the colorbar_specs class attribute.
-
param Dict
colorbar_opts( allow_None=False, constant=False, default={}, instantiate=True, is_instance=True, pickle_default_value=True, precedence=None, readonly=False, watchers={} ) - Allows setting specific styling options for the colorbar overriding the options defined in the colorbar_specs class attribute. Includes location, orientation, height, width, scale_alpha, title, title_props, margin, padding, background_fill_color and more.
-
param Dict
clipping_colors( allow_None=False, constant=False, default={}, instantiate=True, is_instance=True, pickle_default_value=True, precedence=None, readonly=False, watchers={} ) - Dictionary to specify colors for clipped values, allows setting color for NaN values and for values above and below the min and max value. The min, max or NaN color may specify an RGB(A) color as a color hex string of the form #FFFFFF or #FFFFFFFF or a length 3 or length 4 tuple specifying values in the range 0-1 or a named HTML color.
-
param Boolean
logz( allow_None=False, bounds=(0, 1), constant=False, default=False, instantiate=False, pickle_default_value=True, precedence=None, readonly=False, watchers={} ) - Whether to apply log scaling to the z-axis.
-
param Boolean
symmetric( allow_None=False, bounds=(0, 1), constant=False, default=False, instantiate=False, pickle_default_value=True, precedence=None, readonly=False, watchers={} ) - Whether to make the colormap symmetric around zero.
-
cleanup( ) ¶ -
Cleans up references to the plot after the plot has been deleted. Traverses through all plots cleaning up Callbacks and Stream subscribers.
-
compute_ranges( obj , key , ranges ) ¶ -
Given an object, a specific key, and the normalization options, this method will find the specified normalization options on the appropriate OptionTree, group the elements according to the selected normalization option (i.e. either per frame or over the whole animation) and finally compute the dimension ranges in each group. The new set of ranges is returned.
-
current_handles¶ -
Should return a list of plot objects that have changed and should be updated.
-
debug( *args , **kwargs ) ¶ -
Inspect .param.debug method for the full docstring
-
defaults( *args , **kwargs ) ¶ -
Inspect .param.defaults method for the full docstring
-
force_new_dynamic_value= functools.partial(<function Parameters.deprecate.<locals>.inner>, <class 'holoviews.plotting.bokeh.element.ColorbarPlot'>) 
-
framewise¶ -
Property to determine whether the current frame should have framewise normalization enabled. Required for bokeh plotting classes to determine whether to send updated ranges for each frame.
-
get_aspect( xspan , yspan ) ¶ -
Computes the aspect ratio of the plot
-
get_data( element , ranges , style ) ¶ -
Returns the data from an element in the appropriate format for initializing or updating a ColumnDataSource and a dictionary which maps the expected keywords arguments of a glyph to the column in the datasource.
-
get_extents( element , ranges , range_type='combined' , xdim=None , ydim=None , zdim=None ) ¶ -
Gets the extents for the axes from the current Element. The globally computed ranges can optionally override the extents.
The extents are computed by combining the data ranges, extents and dimension ranges. Each of these can be obtained individually by setting the range_type to one of:
- ‘data’: Just the data ranges
- ‘extents’: Element.extents
- ‘soft’: Dimension.soft_range values
- ‘hard’: Dimension.range values
To obtain the combined range, which includes range padding the default may be used:
- ‘combined’: All the range types combined and padding applied
This allows Overlay plots to obtain each range and combine them appropriately for all the objects in the overlay.
-
get_padding( extents ) ¶ -
Computes padding along the axes taking into account the plot aspect.
-
get_param_values= functools.partial(<function Parameters.deprecate.<locals>.inner>, <class 'holoviews.plotting.bokeh.element.ColorbarPlot'>) 
-
get_value_generator= functools.partial(<function Parameters.deprecate.<locals>.inner>, <class 'holoviews.plotting.bokeh.element.ColorbarPlot'>) 
-
get_zorder( overlay , key , el ) ¶ -
Computes the z-order of element in the NdOverlay taking into account possible batching of elements.
-
init_comm( ) ¶ -
Initializes comm and attaches streams.
-
initialize_plot( ranges=None , plot=None , plots=None , source=None ) ¶ -
Initializes a new plot object with the last available frame.
-
inspect_value= functools.partial(<function Parameters.deprecate.<locals>.inner>, <class 'holoviews.plotting.bokeh.element.ColorbarPlot'>) 
-
link_sources¶ -
Returns potential Link or Stream sources.
-
matches( spec ) ¶ -
Matches a specification against the current Plot.
-
message( *args , **kwargs ) ¶ -
Inspect .param.message method for the full docstring
-
model_changed( model ) ¶ -
Determines if the bokeh model was just changed on the frontend. Useful to suppress boomeranging events, e.g. when the frontend just sent an update to the x_range this should not trigger an update on the backend.
-
params( *args , **kwargs ) ¶ -
Inspect .param.params method for the full docstring
-
pprint( imports=None , prefix=' ' , unknown_value='<?>' , qualify=False , separator='' ) ¶ -
(Experimental) Pretty printed representation that may be evaluated with eval. See pprint() function for more details.
-
print_param_defaults( *args , **kwargs ) ¶ -
Inspect .param.print_param_defaults method for the full docstring
-
print_param_values( *args , **kwargs ) ¶ -
Inspect .param.print_param_values method for the full docstring
-
push( ) ¶ -
Pushes updated plot data via the Comm.
-
refresh( **kwargs ) ¶ -
Refreshes the plot by rerendering it and then pushing the updated data if the plot has an associated Comm.
-
script_repr( imports=[] , prefix=' ' ) ¶ -
Variant of __repr__ designed for generating a runnable script.
-
set_default( *args , **kwargs ) ¶ -
Inspect .param.set_default method for the full docstring
-
set_dynamic_time_fn= functools.partial(<function Parameters.deprecate.<locals>.inner>, <class 'holoviews.plotting.bokeh.element.ColorbarPlot'>) 
-
set_param= functools.partial(<function Parameters.deprecate.<locals>.inner>, <class 'holoviews.plotting.bokeh.element.ColorbarPlot'>) 
-
set_root( root ) ¶ -
Sets the root model on all subplots.
-
state¶ -
The plotting state that gets updated via the update method and used by the renderer to generate output.
-
state_pop( ) ¶ -
Restore the most recently saved state.
See state_push() for more details.
-
state_push( ) ¶ -
Save this instance’s state.
For Parameterized instances, this includes the state of dynamically generated values.
Subclasses that maintain short-term state should additionally save and restore that state using state_push() and state_pop().
Generally, this method is used by operations that need to test something without permanently altering the objects’ state.
-
sync_sources( ) ¶ -
Syncs data sources between Elements, which draw data from the same object.
-
traverse( fn=None , specs=None , full_breadth=True ) ¶ -
Traverses any nested DimensionedPlot returning a list of all plots that match the specs. The specs should be supplied as a list of either Plot types or callables, which should return a boolean given the plot class.
-
update_frame( key , ranges=None , plot=None , element=None ) ¶ -
Updates an existing plot with data corresponding to the key.
-
verbose( *args , **kwargs ) ¶ -
Inspect .param.verbose method for the full docstring
-
warning( *args , **kwargs ) ¶ -
Inspect .param.warning method for the full docstring
-
param Parameter
-
class
holoviews.plotting.bokeh.element.CompositeElementPlot( element , plot=None , **params ) [source] ¶ -
Bases:
holoviews.plotting.bokeh.element.ElementPlotA CompositeElementPlot is an Element plot type that coordinates drawing of multiple glyphs.
-
param Parameter
fontsize( allow_None=True, constant=False, default={‘title’: ‘12pt’}, instantiate=False, pickle_default_value=True, precedence=None, readonly=False, watchers={} ) - Specifies various fontsizes of the displayed text. Finer control is available by supplying a dictionary where any unmentioned keys reverts to the default sizes, e.g: {‘ticks’: ‘20pt’, ‘title’: ‘15pt’, ‘ylabel’: ‘5px’, ‘xlabel’: ‘5px’}
-
param Boolean
show_title( allow_None=False, bounds=(0, 1), constant=False, default=True, instantiate=False, pickle_default_value=True, precedence=None, readonly=False, watchers={} ) - Whether to display the plot title.
-
param String
title( allow_None=False, basestring=<class ‘str’>, constant=False, default={label} {group} {dimensions}, instantiate=False, pickle_default_value=True, precedence=None, readonly=False, regex=None, watchers={} ) - The formatting string for the title of this plot, allows defining a label group separator and dimension labels.
-
param String
title_format( allow_None=True, basestring=<class ‘str’>, constant=False, default=None, instantiate=False, pickle_default_value=True, precedence=None, readonly=False, regex=None, watchers={} ) - Alias for title.
-
param Boolean
normalize( allow_None=False, bounds=(0, 1), constant=False, default=True, instantiate=False, pickle_default_value=True, precedence=None, readonly=False, watchers={} ) - Whether to compute ranges across all Elements at this level of plotting. Allows selecting normalization at different levels for nested data containers.
-
param Parameter
projection( allow_None=True, constant=False, default=None, instantiate=False, pickle_default_value=True, precedence=None, readonly=False, watchers={} ) - Allows supplying a custom projection to transform the axis coordinates during display. Example projections include ‘3d’ and ‘polar’ projections supported by some backends. Depending on the backend custom, projection objects may be supplied.
-
param Boolean
apply_ranges( allow_None=False, bounds=(0, 1), constant=False, default=True, instantiate=False, pickle_default_value=True, precedence=None, readonly=False, watchers={} ) - Whether to compute the plot bounds from the data itself.
-
param Boolean
apply_extents( allow_None=False, bounds=(0, 1), constant=False, default=True, instantiate=False, pickle_default_value=True, precedence=None, readonly=False, watchers={} ) - Whether to apply extent overrides on the Elements
-
param ClassSelector
bgcolor( allow_None=True, constant=False, default=None, instantiate=True, is_instance=True, pickle_default_value=True, precedence=None, readonly=False, watchers={} ) - If set bgcolor overrides the background color of the axis.
-
param ClassSelector
default_span( allow_None=False, constant=False, default=2.0, instantiate=True, is_instance=True, pickle_default_value=True, precedence=None, readonly=False, watchers={} ) - Defines the span of an axis if the axis range is zero, i.e. if the lower and upper end of an axis are equal or no range is defined at all. For example if there is a single datapoint at 0 a default_span of 2.0 will result in axis ranges spanning from -1 to 1.
-
param Boolean
invert_axes( allow_None=False, bounds=(0, 1), constant=False, default=False, instantiate=False, pickle_default_value=True, precedence=None, readonly=False, watchers={} ) - Whether to invert the x- and y-axis
-
param Boolean
invert_xaxis( allow_None=False, bounds=(0, 1), constant=False, default=False, instantiate=False, pickle_default_value=True, precedence=None, readonly=False, watchers={} ) - Whether to invert the plot x-axis.
-
param Boolean
invert_yaxis( allow_None=False, bounds=(0, 1), constant=False, default=False, instantiate=False, pickle_default_value=True, precedence=None, readonly=False, watchers={} ) - Whether to invert the plot y-axis.
-
param Boolean
logx( allow_None=False, bounds=(0, 1), constant=False, default=False, instantiate=False, pickle_default_value=True, precedence=None, readonly=False, watchers={} ) - Whether the x-axis of the plot will be a log axis.
-
param Boolean
logy( allow_None=False, bounds=(0, 1), constant=False, default=False, instantiate=False, pickle_default_value=True, precedence=None, readonly=False, watchers={} ) - Whether the y-axis of the plot will be a log axis.
-
param ClassSelector
padding( allow_None=False, constant=False, default=0, instantiate=True, is_instance=True, pickle_default_value=True, precedence=None, readonly=False, watchers={} ) - Fraction by which to increase auto-ranged extents to make datapoints more visible around borders. To compute padding, the axis whose screen size is largest is chosen, and the range of that axis is increased by the specified fraction along each axis. Other axes are then padded ensuring that the amount of screen space devoted to padding is equal for all axes. If specified as a tuple, the int or float values in the tuple will be used for padding in each axis, in order (x,y or x,y,z). For example, for padding=0.2 on a 800x800-pixel plot, an x-axis with the range [0,10] will be padded by 20% to be [-1,11], while a y-axis with a range [0,1000] will be padded to be [-100,1100], which should make the padding be approximately the same number of pixels. But if the same plot is changed to have a height of only 200, the y-range will then be [-400,1400] so that the y-axis padding will still match that of the x-axis. It is also possible to declare non-equal padding value for the lower and upper bound of an axis by supplying nested tuples, e.g. padding=(0.1, (0, 0.1)) will pad the x-axis lower and upper bound as well as the y-axis upper bound by a fraction of 0.1 while the y-axis lower bound is not padded at all.
-
param Boolean
show_legend( allow_None=False, bounds=(0, 1), constant=False, default=True, instantiate=False, pickle_default_value=True, precedence=None, readonly=False, watchers={} ) - Whether to show legend for the plot.
-
param Boolean
show_grid( allow_None=False, bounds=(0, 1), constant=False, default=False, instantiate=False, pickle_default_value=True, precedence=None, readonly=False, watchers={} ) - Whether to show a Cartesian grid on the plot.
-
param ObjectSelector
xaxis( allow_None=None, check_on_set=True, compute_default_fn=None, constant=False, default=bottom, instantiate=False, names=None, objects=[‘top’, ‘bottom’, ‘bare’, ‘top-bare’, ‘bottom-bare’, None, True, False], pickle_default_value=True, precedence=None, readonly=False, watchers={} ) - Whether and where to display the xaxis. The “bare” options allow suppressing all axis labels, including ticks and xlabel. Valid options are ‘top’, ‘bottom’, ‘bare’, ‘top-bare’ and ‘bottom-bare’.
-
param ObjectSelector
yaxis( allow_None=None, check_on_set=True, compute_default_fn=None, constant=False, default=left, instantiate=False, names=None, objects=[‘left’, ‘right’, ‘bare’, ‘left-bare’, ‘right-bare’, None, True, False], pickle_default_value=True, precedence=None, readonly=False, watchers={} ) - Whether and where to display the yaxis. The “bare” options allow suppressing all axis labels, including ticks and ylabel. Valid options are ‘left’, ‘right’, ‘bare’, ‘left-bare’ and ‘right-bare’.
-
param String
xlabel( allow_None=True, basestring=<class ‘str’>, constant=False, default=None, instantiate=False, pickle_default_value=True, precedence=None, readonly=False, regex=None, watchers={} ) - An explicit override of the x-axis label, if set takes precedence over the dimension label.
-
param String
ylabel( allow_None=True, basestring=<class ‘str’>, constant=False, default=None, instantiate=False, pickle_default_value=True, precedence=None, readonly=False, regex=None, watchers={} ) - An explicit override of the y-axis label, if set takes precedence over the dimension label.
-
param NumericTuple
xlim( allow_None=False, constant=False, default=(nan, nan), instantiate=False, length=2, pickle_default_value=True, precedence=None, readonly=False, watchers={} ) - User-specified x-axis range limits for the plot, as a tuple (low,high). If specified, takes precedence over data and dimension ranges.
-
param NumericTuple
ylim( allow_None=False, constant=False, default=(nan, nan), instantiate=False, length=2, pickle_default_value=True, precedence=None, readonly=False, watchers={} ) - User-specified x-axis range limits for the plot, as a tuple (low,high). If specified, takes precedence over data and dimension ranges.
-
param NumericTuple
zlim( allow_None=False, constant=False, default=(nan, nan), instantiate=False, length=2, pickle_default_value=True, precedence=None, readonly=False, watchers={} ) - User-specified z-axis range limits for the plot, as a tuple (low,high). If specified, takes precedence over data and dimension ranges.
-
param Integer
xrotation( allow_None=True, bounds=(0, 360), constant=False, default=None, inclusive_bounds=(True, True), instantiate=False, pickle_default_value=True, precedence=None, readonly=False, softbounds=None, time_dependent=False, time_fn=<Time Time00001>, watchers={} ) - Rotation angle of the xticks.
-
param Integer
yrotation( allow_None=True, bounds=(0, 360), constant=False, default=None, inclusive_bounds=(True, True), instantiate=False, pickle_default_value=True, precedence=None, readonly=False, softbounds=None, time_dependent=False, time_fn=<Time Time00001>, watchers={} ) - Rotation angle of the yticks.
-
param Parameter
xticks( allow_None=True, constant=False, default=None, instantiate=False, pickle_default_value=True, precedence=None, readonly=False, watchers={} ) - Ticks along x-axis specified as an integer, explicit list of tick locations, or bokeh Ticker object. If set to None default bokeh ticking behavior is applied.
-
param Parameter
yticks( allow_None=True, constant=False, default=None, instantiate=False, pickle_default_value=True, precedence=None, readonly=False, watchers={} ) - Ticks along y-axis specified as an integer, explicit list of tick locations, or bokeh Ticker object. If set to None default bokeh ticking behavior is applied.
-
param Integer
width( allow_None=False, bounds=None, constant=False, default=300, inclusive_bounds=(True, True), instantiate=False, pickle_default_value=True, precedence=None, readonly=False, softbounds=None, time_dependent=False, time_fn=<Time Time00001>, watchers={} ) - Width of the plot in pixels
-
param Integer
height( allow_None=False, bounds=None, constant=False, default=300, inclusive_bounds=(True, True), instantiate=False, pickle_default_value=True, precedence=None, readonly=False, softbounds=None, time_dependent=False, time_fn=<Time Time00001>, watchers={} ) - Height of the plot in pixels
-
param ObjectSelector
sizing_mode( allow_None=None, check_on_set=True, compute_default_fn=None, constant=False, default=fixed, instantiate=False, names=None, objects=[‘fixed’, ‘stretch_both’, ‘scale_width’, ‘scale_height’, ‘scale_both’], pickle_default_value=True, precedence=None, readonly=False, watchers={} ) - How the item being displayed should size itself. “stretch_both” plots will resize to occupy all available space, even if this changes the aspect ratio of the element. “fixed” plots are not responsive and will retain their original width and height regardless of any subsequent browser window resize events. “scale_width” elements will responsively resize to fit to the width available, while maintaining the original aspect ratio. “scale_height” elements will responsively resize to fit to the height available, while maintaining the original aspect ratio. “scale_both” elements will responsively resize to for both the width and height available, while maintaining the original aspect ratio.
-
param Boolean
shared_datasource( allow_None=False, bounds=(0, 1), constant=False, default=True, instantiate=False, pickle_default_value=True, precedence=None, readonly=False, watchers={} ) - Whether Elements drawing the data from the same object should share their Bokeh data source allowing for linked brushing and other linked behaviors.
-
param ObjectSelector
toolbar( allow_None=None, check_on_set=True, compute_default_fn=None, constant=False, default=right, instantiate=False, names=None, objects=[‘above’, ‘below’, ‘left’, ‘right’, ‘disable’, None], pickle_default_value=True, precedence=None, readonly=False, watchers={} ) - The toolbar location, must be one of ‘above’, ‘below’, ‘left’, ‘right’, None.
-
param List
active_tools( allow_None=False, bounds=(0, None), constant=False, default=[], instantiate=True, pickle_default_value=True, precedence=None, readonly=False, watchers={} ) - Allows specifying which tools are active by default. Note that only one tool per gesture type can be active, e.g. both ‘pan’ and ‘box_zoom’ are drag tools, so if both are listed only the last one will be active.
-
param Number
border( allow_None=False, bounds=None, constant=False, default=10, inclusive_bounds=(True, True), instantiate=False, pickle_default_value=True, precedence=None, readonly=False, softbounds=None, time_dependent=False, time_fn=<Time Time00001>, watchers={} ) - Minimum border around plot.
-
param HookList
finalize_hooks( allow_None=False, bounds=(0, None), constant=False, default=[], instantiate=True, pickle_default_value=True, precedence=None, readonly=False, watchers={} ) - Deprecated; use hooks options instead.
-
param HookList
hooks( allow_None=False, bounds=(0, None), constant=False, default=[], instantiate=True, pickle_default_value=True, precedence=None, readonly=False, watchers={} ) - Optional list of hooks called when finalizing a plot. The hook is passed the plot object and the displayed element, and other plotting handles can be accessed via plot.handles.
-
param Dict
gridstyle( allow_None=False, constant=False, default={}, instantiate=True, is_instance=True, pickle_default_value=True, precedence=None, readonly=False, watchers={} ) - Allows customizing the grid style, e.g. grid_line_color defines the line color for both grids while xgrid_line_color exclusively customizes the x-axis grid lines.
-
param List
labelled( allow_None=False, bounds=(0, None), constant=False, default=[‘x’, ‘y’], instantiate=True, pickle_default_value=True, precedence=None, readonly=False, watchers={} ) - Whether to plot the ‘x’ and ‘y’ labels.
-
param Dict
lod( allow_None=False, constant=False, default={‘factor’: 10, ‘interval’: 300, ‘threshold’: 2000, ‘timeout’: 500}, instantiate=True, is_instance=True, pickle_default_value=True, precedence=None, readonly=False, watchers={} ) - Bokeh plots offer “Level of Detail” (LOD) capability to accommodate large (but not huge) amounts of data. The available options are: * factor - Decimation factor to use when applying decimation. * interval - Interval (in ms) downsampling will be enabled after an interactive event. * threshold - Number of samples before downsampling is enabled. * timeout - Timeout (in ms) for checking whether interactive tool events are still occurring.
-
param Boolean
show_frame( allow_None=False, bounds=(0, 1), constant=False, default=True, instantiate=False, pickle_default_value=True, precedence=None, readonly=False, watchers={} ) - Whether or not to show a complete frame around the plot.
-
param Boolean
shared_axes( allow_None=False, bounds=(0, 1), constant=False, default=True, instantiate=False, pickle_default_value=True, precedence=None, readonly=False, watchers={} ) - Whether to invert the share axes across plots for linked panning and zooming.
-
param List
default_tools( allow_None=False, bounds=(0, None), constant=False, default=[‘save’, ‘pan’, ‘wheel_zoom’, ‘box_zoom’, ‘reset’], instantiate=True, pickle_default_value=True, precedence=None, readonly=False, watchers={} ) - A list of plugin tools to use on the plot.
-
param List
tools( allow_None=False, bounds=(0, None), constant=False, default=[], instantiate=True, pickle_default_value=True, precedence=None, readonly=False, watchers={} ) - A list of plugin tools to use on the plot.
-
param ClassSelector
xformatter( allow_None=True, constant=False, default=None, instantiate=True, is_instance=True, pickle_default_value=True, precedence=None, readonly=False, watchers={} ) - Formatter for ticks along the x-axis.
-
param ClassSelector
yformatter( allow_None=True, constant=False, default=None, instantiate=True, is_instance=True, pickle_default_value=True, precedence=None, readonly=False, watchers={} ) - Formatter for ticks along the x-axis.
-
cleanup( ) ¶ -
Cleans up references to the plot after the plot has been deleted. Traverses through all plots cleaning up Callbacks and Stream subscribers.
-
compute_ranges( obj , key , ranges ) ¶ -
Given an object, a specific key, and the normalization options, this method will find the specified normalization options on the appropriate OptionTree, group the elements according to the selected normalization option (i.e. either per frame or over the whole animation) and finally compute the dimension ranges in each group. The new set of ranges is returned.
-
current_handles¶ -
Should return a list of plot objects that have changed and should be updated.
-
debug( *args , **kwargs ) ¶ -
Inspect .param.debug method for the full docstring
-
defaults( *args , **kwargs ) ¶ -
Inspect .param.defaults method for the full docstring
-
force_new_dynamic_value= functools.partial(<function Parameters.deprecate.<locals>.inner>, <class 'holoviews.plotting.bokeh.element.CompositeElementPlot'>) 
-
framewise¶ -
Property to determine whether the current frame should have framewise normalization enabled. Required for bokeh plotting classes to determine whether to send updated ranges for each frame.
-
get_aspect( xspan , yspan ) ¶ -
Computes the aspect ratio of the plot
-
get_data( element , ranges , style ) ¶ -
Returns the data from an element in the appropriate format for initializing or updating a ColumnDataSource and a dictionary which maps the expected keywords arguments of a glyph to the column in the datasource.
-
get_extents( element , ranges , range_type='combined' , xdim=None , ydim=None , zdim=None ) ¶ -
Gets the extents for the axes from the current Element. The globally computed ranges can optionally override the extents.
The extents are computed by combining the data ranges, extents and dimension ranges. Each of these can be obtained individually by setting the range_type to one of:
- ‘data’: Just the data ranges
- ‘extents’: Element.extents
- ‘soft’: Dimension.soft_range values
- ‘hard’: Dimension.range values
To obtain the combined range, which includes range padding the default may be used:
- ‘combined’: All the range types combined and padding applied
This allows Overlay plots to obtain each range and combine them appropriately for all the objects in the overlay.
-
get_padding( extents ) ¶ -
Computes padding along the axes taking into account the plot aspect.
-
get_param_values= functools.partial(<function Parameters.deprecate.<locals>.inner>, <class 'holoviews.plotting.bokeh.element.CompositeElementPlot'>) 
-
get_value_generator= functools.partial(<function Parameters.deprecate.<locals>.inner>, <class 'holoviews.plotting.bokeh.element.CompositeElementPlot'>) 
-
get_zorder( overlay , key , el ) ¶ -
Computes the z-order of element in the NdOverlay taking into account possible batching of elements.
-
init_comm( ) ¶ -
Initializes comm and attaches streams.
-
initialize_plot( ranges=None , plot=None , plots=None , source=None ) ¶ -
Initializes a new plot object with the last available frame.
-
inspect_value= functools.partial(<function Parameters.deprecate.<locals>.inner>, <class 'holoviews.plotting.bokeh.element.CompositeElementPlot'>) 
-
link_sources¶ -
Returns potential Link or Stream sources.
-
matches( spec ) ¶ -
Matches a specification against the current Plot.
-
message( *args , **kwargs ) ¶ -
Inspect .param.message method for the full docstring
-
model_changed( model ) ¶ -
Determines if the bokeh model was just changed on the frontend. Useful to suppress boomeranging events, e.g. when the frontend just sent an update to the x_range this should not trigger an update on the backend.
-
params( *args , **kwargs ) ¶ -
Inspect .param.params method for the full docstring
-
pprint( imports=None , prefix=' ' , unknown_value='<?>' , qualify=False , separator='' ) ¶ -
(Experimental) Pretty printed representation that may be evaluated with eval. See pprint() function for more details.
-
print_param_defaults( *args , **kwargs ) ¶ -
Inspect .param.print_param_defaults method for the full docstring
-
print_param_values( *args , **kwargs ) ¶ -
Inspect .param.print_param_values method for the full docstring
-
push( ) ¶ -
Pushes updated plot data via the Comm.
-
refresh( **kwargs ) ¶ -
Refreshes the plot by rerendering it and then pushing the updated data if the plot has an associated Comm.
-
script_repr( imports=[] , prefix=' ' ) ¶ -
Variant of __repr__ designed for generating a runnable script.
-
set_default( *args , **kwargs ) ¶ -
Inspect .param.set_default method for the full docstring
-
set_dynamic_time_fn= functools.partial(<function Parameters.deprecate.<locals>.inner>, <class 'holoviews.plotting.bokeh.element.CompositeElementPlot'>) 
-
set_param= functools.partial(<function Parameters.deprecate.<locals>.inner>, <class 'holoviews.plotting.bokeh.element.CompositeElementPlot'>) 
-
set_root( root ) ¶ -
Sets the root model on all subplots.
-
state¶ -
The plotting state that gets updated via the update method and used by the renderer to generate output.
-
state_pop( ) ¶ -
Restore the most recently saved state.
See state_push() for more details.
-
state_push( ) ¶ -
Save this instance’s state.
For Parameterized instances, this includes the state of dynamically generated values.
Subclasses that maintain short-term state should additionally save and restore that state using state_push() and state_pop().
Generally, this method is used by operations that need to test something without permanently altering the objects’ state.
-
sync_sources( ) ¶ -
Syncs data sources between Elements, which draw data from the same object.
-
traverse( fn=None , specs=None , full_breadth=True ) ¶ -
Traverses any nested DimensionedPlot returning a list of all plots that match the specs. The specs should be supplied as a list of either Plot types or callables, which should return a boolean given the plot class.
-
update_frame( key , ranges=None , plot=None , element=None ) ¶ -
Updates an existing plot with data corresponding to the key.
-
verbose( *args , **kwargs ) ¶ -
Inspect .param.verbose method for the full docstring
-
warning( *args , **kwargs ) ¶ -
Inspect .param.warning method for the full docstring
-
param Parameter

plot
Module
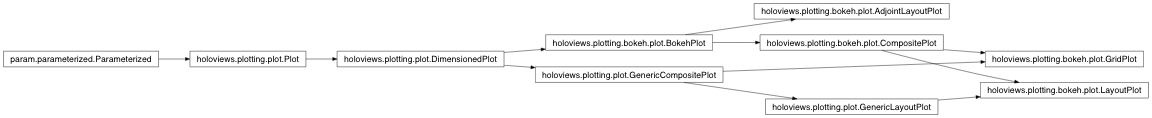
-
class
holoviews.plotting.bokeh.plot.BokehPlot( *args , **params ) [source] ¶ -
Bases:
holoviews.plotting.plot.DimensionedPlotPlotting baseclass for the Bokeh backends, implementing the basic plotting interface for Bokeh based plots.
-
param Parameter
fontsize( allow_None=True, constant=False, default=None, instantiate=False, pickle_default_value=True, precedence=None, readonly=False, watchers={} ) - Specifies various font sizes of the displayed text. Finer control is available by supplying a dictionary where any unmentioned keys revert to the default sizes, e.g: {‘ticks’:20, ‘title’:15, ‘ylabel’:5, ‘xlabel’:5, ‘zlabel’:5, ‘legend’:8, ‘legend_title’:13} You can set the font size of ‘zlabel’, ‘ylabel’ and ‘xlabel’ together using the ‘labels’ key.
-
param Boolean
show_title( allow_None=False, bounds=(0, 1), constant=False, default=True, instantiate=False, pickle_default_value=True, precedence=None, readonly=False, watchers={} ) - Whether to display the plot title.
-
param String
title( allow_None=False, basestring=<class ‘str’>, constant=False, default={label} {group} {dimensions}, instantiate=False, pickle_default_value=True, precedence=None, readonly=False, regex=None, watchers={} ) - The formatting string for the title of this plot, allows defining a label group separator and dimension labels.
-
param String
title_format( allow_None=True, basestring=<class ‘str’>, constant=False, default=None, instantiate=False, pickle_default_value=True, precedence=None, readonly=False, regex=None, watchers={} ) - Alias for title.
-
param Boolean
normalize( allow_None=False, bounds=(0, 1), constant=False, default=True, instantiate=False, pickle_default_value=True, precedence=None, readonly=False, watchers={} ) - Whether to compute ranges across all Elements at this level of plotting. Allows selecting normalization at different levels for nested data containers.
-
param Parameter
projection( allow_None=True, constant=False, default=None, instantiate=False, pickle_default_value=True, precedence=None, readonly=False, watchers={} ) - Allows supplying a custom projection to transform the axis coordinates during display. Example projections include ‘3d’ and ‘polar’ projections supported by some backends. Depending on the backend custom, projection objects may be supplied.
-
param Integer
width( allow_None=False, bounds=None, constant=False, default=300, inclusive_bounds=(True, True), instantiate=False, pickle_default_value=True, precedence=None, readonly=False, softbounds=None, time_dependent=False, time_fn=<Time Time00001>, watchers={} ) - Width of the plot in pixels
-
param Integer
height( allow_None=False, bounds=None, constant=False, default=300, inclusive_bounds=(True, True), instantiate=False, pickle_default_value=True, precedence=None, readonly=False, softbounds=None, time_dependent=False, time_fn=<Time Time00001>, watchers={} ) - Height of the plot in pixels
-
param ObjectSelector
sizing_mode( allow_None=None, check_on_set=True, compute_default_fn=None, constant=False, default=fixed, instantiate=False, names=None, objects=[‘fixed’, ‘stretch_both’, ‘scale_width’, ‘scale_height’, ‘scale_both’], pickle_default_value=True, precedence=None, readonly=False, watchers={} ) - How the item being displayed should size itself. “stretch_both” plots will resize to occupy all available space, even if this changes the aspect ratio of the element. “fixed” plots are not responsive and will retain their original width and height regardless of any subsequent browser window resize events. “scale_width” elements will responsively resize to fit to the width available, while maintaining the original aspect ratio. “scale_height” elements will responsively resize to fit to the height available, while maintaining the original aspect ratio. “scale_both” elements will responsively resize to for both the width and height available, while maintaining the original aspect ratio.
-
param Boolean
shared_datasource( allow_None=False, bounds=(0, 1), constant=False, default=True, instantiate=False, pickle_default_value=True, precedence=None, readonly=False, watchers={} ) - Whether Elements drawing the data from the same object should share their Bokeh data source allowing for linked brushing and other linked behaviors.
-
param ObjectSelector
toolbar( allow_None=None, check_on_set=True, compute_default_fn=None, constant=False, default=above, instantiate=False, names=None, objects=[‘above’, ‘below’, ‘left’, ‘right’, None], pickle_default_value=True, precedence=None, readonly=False, watchers={} ) - The toolbar location, must be one of ‘above’, ‘below’, ‘left’, ‘right’, None.
-
cleanup( ) [source] ¶ -
Cleans up references to the plot after the plot has been deleted. Traverses through all plots cleaning up Callbacks and Stream subscribers.
-
compute_ranges( obj , key , ranges ) ¶ -
Given an object, a specific key, and the normalization options, this method will find the specified normalization options on the appropriate OptionTree, group the elements according to the selected normalization option (i.e. either per frame or over the whole animation) and finally compute the dimension ranges in each group. The new set of ranges is returned.
-
current_handles¶ -
Should return a list of plot objects that have changed and should be updated.
-
debug( *args , **kwargs ) ¶ -
Inspect .param.debug method for the full docstring
-
defaults( *args , **kwargs ) ¶ -
Inspect .param.defaults method for the full docstring
-
force_new_dynamic_value= functools.partial(<function Parameters.deprecate.<locals>.inner>, <class 'holoviews.plotting.bokeh.plot.BokehPlot'>) 
-
get_data( element , ranges , style ) [source] ¶ -
Returns the data from an element in the appropriate format for initializing or updating a ColumnDataSource and a dictionary which maps the expected keywords arguments of a glyph to the column in the datasource.
-
get_param_values= functools.partial(<function Parameters.deprecate.<locals>.inner>, <class 'holoviews.plotting.bokeh.plot.BokehPlot'>) 
-
get_value_generator= functools.partial(<function Parameters.deprecate.<locals>.inner>, <class 'holoviews.plotting.bokeh.plot.BokehPlot'>) 
-
init_comm( ) ¶ -
Initializes comm and attaches streams.
-
initialize_plot( ranges=None ) ¶ -
Initialize the matplotlib figure.
-
inspect_value= functools.partial(<function Parameters.deprecate.<locals>.inner>, <class 'holoviews.plotting.bokeh.plot.BokehPlot'>) 
-
link_sources¶ -
Returns potential Link or Stream sources.
-
matches( spec ) ¶ -
Matches a specification against the current Plot.
-
message( *args , **kwargs ) ¶ -
Inspect .param.message method for the full docstring
-
params( *args , **kwargs ) ¶ -
Inspect .param.params method for the full docstring
-
pprint( imports=None , prefix=' ' , unknown_value='<?>' , qualify=False , separator='' ) ¶ -
(Experimental) Pretty printed representation that may be evaluated with eval. See pprint() function for more details.
-
print_param_defaults( *args , **kwargs ) ¶ -
Inspect .param.print_param_defaults method for the full docstring
-
print_param_values( *args , **kwargs ) ¶ -
Inspect .param.print_param_values method for the full docstring
-
refresh( **kwargs ) ¶ -
Refreshes the plot by rerendering it and then pushing the updated data if the plot has an associated Comm.
-
script_repr( imports=[] , prefix=' ' ) ¶ -
Variant of __repr__ designed for generating a runnable script.
-
set_default( *args , **kwargs ) ¶ -
Inspect .param.set_default method for the full docstring
-
set_dynamic_time_fn= functools.partial(<function Parameters.deprecate.<locals>.inner>, <class 'holoviews.plotting.bokeh.plot.BokehPlot'>) 
-
set_param= functools.partial(<function Parameters.deprecate.<locals>.inner>, <class 'holoviews.plotting.bokeh.plot.BokehPlot'>) 
-
state¶ -
The plotting state that gets updated via the update method and used by the renderer to generate output.
-
state_pop( ) ¶ -
Restore the most recently saved state.
See state_push() for more details.
-
state_push( ) ¶ -
Save this instance’s state.
For Parameterized instances, this includes the state of dynamically generated values.
Subclasses that maintain short-term state should additionally save and restore that state using state_push() and state_pop().
Generally, this method is used by operations that need to test something without permanently altering the objects’ state.
-
sync_sources( ) [source] ¶ -
Syncs data sources between Elements, which draw data from the same object.
-
traverse( fn=None , specs=None , full_breadth=True ) ¶ -
Traverses any nested DimensionedPlot returning a list of all plots that match the specs. The specs should be supplied as a list of either Plot types or callables, which should return a boolean given the plot class.
-
verbose( *args , **kwargs ) ¶ -
Inspect .param.verbose method for the full docstring
-
warning( *args , **kwargs ) ¶ -
Inspect .param.warning method for the full docstring
-
param Parameter
-
class
holoviews.plotting.bokeh.plot.CompositePlot( *args , **params ) [source] ¶ -
Bases:
holoviews.plotting.bokeh.plot.BokehPlotCompositePlot is an abstract baseclass for plot types that draw render multiple axes. It implements methods to add an overall title to such a plot.
-
param Parameter
fontsize( allow_None=True, constant=False, default={‘title’: ‘15pt’}, instantiate=False, pickle_default_value=True, precedence=None, readonly=False, watchers={} ) - Specifies various fontsizes of the displayed text. Finer control is available by supplying a dictionary where any unmentioned keys reverts to the default sizes, e.g: {‘title’: ‘15pt’}
-
param Boolean
show_title( allow_None=False, bounds=(0, 1), constant=False, default=True, instantiate=False, pickle_default_value=True, precedence=None, readonly=False, watchers={} ) - Whether to display the plot title.
-
param String
title( allow_None=False, basestring=<class ‘str’>, constant=False, default={label} {group} {dimensions}, instantiate=False, pickle_default_value=True, precedence=None, readonly=False, regex=None, watchers={} ) - The formatting string for the title of this plot, allows defining a label group separator and dimension labels.
-
param String
title_format( allow_None=True, basestring=<class ‘str’>, constant=False, default=None, instantiate=False, pickle_default_value=True, precedence=None, readonly=False, regex=None, watchers={} ) - Alias for title.
-
param Boolean
normalize( allow_None=False, bounds=(0, 1), constant=False, default=True, instantiate=False, pickle_default_value=True, precedence=None, readonly=False, watchers={} ) - Whether to compute ranges across all Elements at this level of plotting. Allows selecting normalization at different levels for nested data containers.
-
param Parameter
projection( allow_None=True, constant=False, default=None, instantiate=False, pickle_default_value=True, precedence=None, readonly=False, watchers={} ) - Allows supplying a custom projection to transform the axis coordinates during display. Example projections include ‘3d’ and ‘polar’ projections supported by some backends. Depending on the backend custom, projection objects may be supplied.
-
param Integer
width( allow_None=False, bounds=None, constant=False, default=300, inclusive_bounds=(True, True), instantiate=False, pickle_default_value=True, precedence=None, readonly=False, softbounds=None, time_dependent=False, time_fn=<Time Time00001>, watchers={} ) - Width of the plot in pixels
-
param Integer
height( allow_None=False, bounds=None, constant=False, default=300, inclusive_bounds=(True, True), instantiate=False, pickle_default_value=True, precedence=None, readonly=False, softbounds=None, time_dependent=False, time_fn=<Time Time00001>, watchers={} ) - Height of the plot in pixels
-
param ObjectSelector
sizing_mode( allow_None=None, check_on_set=True, compute_default_fn=None, constant=False, default=fixed, instantiate=False, names=None, objects=[‘fixed’, ‘stretch_both’, ‘scale_width’, ‘scale_height’, ‘scale_both’], pickle_default_value=True, precedence=None, readonly=False, watchers={} ) - How the item being displayed should size itself. “stretch_both” plots will resize to occupy all available space, even if this changes the aspect ratio of the element. “fixed” plots are not responsive and will retain their original width and height regardless of any subsequent browser window resize events. “scale_width” elements will responsively resize to fit to the width available, while maintaining the original aspect ratio. “scale_height” elements will responsively resize to fit to the height available, while maintaining the original aspect ratio. “scale_both” elements will responsively resize to for both the width and height available, while maintaining the original aspect ratio.
-
param Boolean
shared_datasource( allow_None=False, bounds=(0, 1), constant=False, default=True, instantiate=False, pickle_default_value=True, precedence=None, readonly=False, watchers={} ) - Whether Elements drawing the data from the same object should share their Bokeh data source allowing for linked brushing and other linked behaviors.
-
param ObjectSelector
toolbar( allow_None=None, check_on_set=True, compute_default_fn=None, constant=False, default=above, instantiate=False, names=None, objects=[‘above’, ‘below’, ‘left’, ‘right’, None], pickle_default_value=True, precedence=None, readonly=False, watchers={} ) - The toolbar location, must be one of ‘above’, ‘below’, ‘left’, ‘right’, None.
-
cleanup( ) ¶ -
Cleans up references to the plot after the plot has been deleted. Traverses through all plots cleaning up Callbacks and Stream subscribers.
-
compute_ranges( obj , key , ranges ) ¶ -
Given an object, a specific key, and the normalization options, this method will find the specified normalization options on the appropriate OptionTree, group the elements according to the selected normalization option (i.e. either per frame or over the whole animation) and finally compute the dimension ranges in each group. The new set of ranges is returned.
-
current_handles¶ -
Should return a list of plot objects that have changed and should be updated.
-
debug( *args , **kwargs ) ¶ -
Inspect .param.debug method for the full docstring
-
defaults( *args , **kwargs ) ¶ -
Inspect .param.defaults method for the full docstring
-
force_new_dynamic_value= functools.partial(<function Parameters.deprecate.<locals>.inner>, <class 'holoviews.plotting.bokeh.plot.CompositePlot'>) 
-
get_data( element , ranges , style ) ¶ -
Returns the data from an element in the appropriate format for initializing or updating a ColumnDataSource and a dictionary which maps the expected keywords arguments of a glyph to the column in the datasource.
-
get_param_values= functools.partial(<function Parameters.deprecate.<locals>.inner>, <class 'holoviews.plotting.bokeh.plot.CompositePlot'>) 
-
get_value_generator= functools.partial(<function Parameters.deprecate.<locals>.inner>, <class 'holoviews.plotting.bokeh.plot.CompositePlot'>) 
-
init_comm( ) ¶ -
Initializes comm and attaches streams.
-
initialize_plot( ranges=None ) ¶ -
Initialize the matplotlib figure.
-
inspect_value= functools.partial(<function Parameters.deprecate.<locals>.inner>, <class 'holoviews.plotting.bokeh.plot.CompositePlot'>) 
-
link_sources¶ -
Returns potential Link or Stream sources.
-
matches( spec ) ¶ -
Matches a specification against the current Plot.
-
message( *args , **kwargs ) ¶ -
Inspect .param.message method for the full docstring
-
params( *args , **kwargs ) ¶ -
Inspect .param.params method for the full docstring
-
pprint( imports=None , prefix=' ' , unknown_value='<?>' , qualify=False , separator='' ) ¶ -
(Experimental) Pretty printed representation that may be evaluated with eval. See pprint() function for more details.
-
print_param_defaults( *args , **kwargs ) ¶ -
Inspect .param.print_param_defaults method for the full docstring
-
print_param_values( *args , **kwargs ) ¶ -
Inspect .param.print_param_values method for the full docstring
-
push( ) ¶ -
Pushes updated plot data via the Comm.
-
refresh( **kwargs ) ¶ -
Refreshes the plot by rerendering it and then pushing the updated data if the plot has an associated Comm.
-
script_repr( imports=[] , prefix=' ' ) ¶ -
Variant of __repr__ designed for generating a runnable script.
-
set_default( *args , **kwargs ) ¶ -
Inspect .param.set_default method for the full docstring
-
set_dynamic_time_fn= functools.partial(<function Parameters.deprecate.<locals>.inner>, <class 'holoviews.plotting.bokeh.plot.CompositePlot'>) 
-
set_param= functools.partial(<function Parameters.deprecate.<locals>.inner>, <class 'holoviews.plotting.bokeh.plot.CompositePlot'>) 
-
set_root( root ) ¶ -
Sets the root model on all subplots.
-
state¶ -
The plotting state that gets updated via the update method and used by the renderer to generate output.
-
state_pop( ) ¶ -
Restore the most recently saved state.
See state_push() for more details.
-
state_push( ) ¶ -
Save this instance’s state.
For Parameterized instances, this includes the state of dynamically generated values.
Subclasses that maintain short-term state should additionally save and restore that state using state_push() and state_pop().
Generally, this method is used by operations that need to test something without permanently altering the objects’ state.
-
sync_sources( ) ¶ -
Syncs data sources between Elements, which draw data from the same object.
-
traverse( fn=None , specs=None , full_breadth=True ) ¶ -
Traverses any nested DimensionedPlot returning a list of all plots that match the specs. The specs should be supplied as a list of either Plot types or callables, which should return a boolean given the plot class.
-
verbose( *args , **kwargs ) ¶ -
Inspect .param.verbose method for the full docstring
-
warning( *args , **kwargs ) ¶ -
Inspect .param.warning method for the full docstring
-
param Parameter
-
class
holoviews.plotting.bokeh.plot.GridPlot( layout , ranges=None , layout_num=1 , keys=None , **params ) [source] ¶ -
Bases:
holoviews.plotting.bokeh.plot.CompositePlot,holoviews.plotting.plot.GenericCompositePlotPlot a group of elements in a grid layout based on a GridSpace element object.
-
param Parameter
fontsize( allow_None=True, constant=False, default={‘title’: ‘16pt’}, instantiate=False, pickle_default_value=True, precedence=None, readonly=False, watchers={} ) - Specifies various fontsizes of the displayed text. Finer control is available by supplying a dictionary where any unmentioned keys reverts to the default sizes, e.g: {‘title’: ‘15pt’}
-
param Boolean
show_title( allow_None=False, bounds=(0, 1), constant=False, default=True, instantiate=False, pickle_default_value=True, precedence=None, readonly=False, watchers={} ) - Whether to display the plot title.
-
param String
title( allow_None=False, basestring=<class ‘str’>, constant=False, default={label} {group} {dimensions}, instantiate=False, pickle_default_value=True, precedence=None, readonly=False, regex=None, watchers={} ) - The formatting string for the title of this plot, allows defining a label group separator and dimension labels.
-
param String
title_format( allow_None=True, basestring=<class ‘str’>, constant=False, default=None, instantiate=False, pickle_default_value=True, precedence=None, readonly=False, regex=None, watchers={} ) - Alias for title.
-
param Boolean
normalize( allow_None=False, bounds=(0, 1), constant=False, default=True, instantiate=False, pickle_default_value=True, precedence=None, readonly=False, watchers={} ) - Whether to compute ranges across all Elements at this level of plotting. Allows selecting normalization at different levels for nested data containers.
-
param Parameter
projection( allow_None=True, constant=False, default=None, instantiate=False, pickle_default_value=True, precedence=None, readonly=False, watchers={} ) - Allows supplying a custom projection to transform the axis coordinates during display. Example projections include ‘3d’ and ‘polar’ projections supported by some backends. Depending on the backend custom, projection objects may be supplied.
-
param Integer
width( allow_None=False, bounds=None, constant=False, default=300, inclusive_bounds=(True, True), instantiate=False, pickle_default_value=True, precedence=None, readonly=False, softbounds=None, time_dependent=False, time_fn=<Time Time00001>, watchers={} ) - Width of the plot in pixels
-
param Integer
height( allow_None=False, bounds=None, constant=False, default=300, inclusive_bounds=(True, True), instantiate=False, pickle_default_value=True, precedence=None, readonly=False, softbounds=None, time_dependent=False, time_fn=<Time Time00001>, watchers={} ) - Height of the plot in pixels
-
param ObjectSelector
sizing_mode( allow_None=None, check_on_set=True, compute_default_fn=None, constant=False, default=fixed, instantiate=False, names=None, objects=[‘fixed’, ‘stretch_both’, ‘scale_width’, ‘scale_height’, ‘scale_both’], pickle_default_value=True, precedence=None, readonly=False, watchers={} ) - How the item being displayed should size itself. “stretch_both” plots will resize to occupy all available space, even if this changes the aspect ratio of the element. “fixed” plots are not responsive and will retain their original width and height regardless of any subsequent browser window resize events. “scale_width” elements will responsively resize to fit to the width available, while maintaining the original aspect ratio. “scale_height” elements will responsively resize to fit to the height available, while maintaining the original aspect ratio. “scale_both” elements will responsively resize to for both the width and height available, while maintaining the original aspect ratio.
-
param Boolean
shared_datasource( allow_None=False, bounds=(0, 1), constant=False, default=True, instantiate=False, pickle_default_value=True, precedence=None, readonly=False, watchers={} ) - Whether Elements drawing the data from the same object should share their Bokeh data source allowing for linked brushing and other linked behaviors.
-
param ObjectSelector
toolbar( allow_None=None, check_on_set=True, compute_default_fn=None, constant=False, default=above, instantiate=False, names=None, objects=[‘above’, ‘below’, ‘left’, ‘right’, None], pickle_default_value=True, precedence=None, readonly=False, watchers={} ) - The toolbar location, must be one of ‘above’, ‘below’, ‘left’, ‘right’, None.
-
param Integer
axis_offset( allow_None=False, bounds=None, constant=False, default=50, inclusive_bounds=(True, True), instantiate=False, pickle_default_value=True, precedence=None, readonly=False, softbounds=None, time_dependent=False, time_fn=<Time Time00001>, watchers={} ) - Number of pixels to adjust row and column widths and height by to compensate for shared axes.
-
param Boolean
merge_tools( allow_None=False, bounds=(0, 1), constant=False, default=True, instantiate=False, pickle_default_value=True, precedence=None, readonly=False, watchers={} ) - Whether to merge all the tools into a single toolbar
-
param Boolean
shared_xaxis( allow_None=False, bounds=(0, 1), constant=False, default=False, instantiate=False, pickle_default_value=True, precedence=None, readonly=False, watchers={} ) - If enabled the x-axes of the GridSpace will be drawn from the objects inside the Grid rather than the GridSpace dimensions.
-
param Boolean
shared_yaxis( allow_None=False, bounds=(0, 1), constant=False, default=False, instantiate=False, pickle_default_value=True, precedence=None, readonly=False, watchers={} ) - If enabled the x-axes of the GridSpace will be drawn from the objects inside the Grid rather than the GridSpace dimensions.
-
param ObjectSelector
xaxis( allow_None=None, check_on_set=True, compute_default_fn=None, constant=False, default=True, instantiate=False, names=None, objects=[‘bottom’, ‘top’, None, True, False], pickle_default_value=True, precedence=None, readonly=False, watchers={} ) - Whether and where to display the xaxis, supported options are ‘bottom’, ‘top’ and None.
-
param ObjectSelector
yaxis( allow_None=None, check_on_set=True, compute_default_fn=None, constant=False, default=True, instantiate=False, names=None, objects=[‘left’, ‘right’, None, True, False], pickle_default_value=True, precedence=None, readonly=False, watchers={} ) - Whether and where to display the yaxis, supported options are ‘left’, ‘right’ and None.
-
param Integer
xrotation( allow_None=False, bounds=(0, 360), constant=False, default=0, inclusive_bounds=(True, True), instantiate=False, pickle_default_value=True, precedence=None, readonly=False, softbounds=None, time_dependent=False, time_fn=<Time Time00001>, watchers={} ) - Rotation angle of the xticks.
-
param Integer
yrotation( allow_None=False, bounds=(0, 360), constant=False, default=0, inclusive_bounds=(True, True), instantiate=False, pickle_default_value=True, precedence=None, readonly=False, softbounds=None, time_dependent=False, time_fn=<Time Time00001>, watchers={} ) - Rotation angle of the yticks.
-
param Integer
plot_size( allow_None=False, bounds=None, constant=False, default=120, inclusive_bounds=(True, True), instantiate=False, pickle_default_value=True, precedence=None, readonly=False, softbounds=None, time_dependent=False, time_fn=<Time Time00001>, watchers={} ) - Defines the width and height of each plot in the grid
-
cleanup( ) ¶ -
Cleans up references to the plot after the plot has been deleted. Traverses through all plots cleaning up Callbacks and Stream subscribers.
-
compute_ranges( obj , key , ranges ) ¶ -
Given an object, a specific key, and the normalization options, this method will find the specified normalization options on the appropriate OptionTree, group the elements according to the selected normalization option (i.e. either per frame or over the whole animation) and finally compute the dimension ranges in each group. The new set of ranges is returned.
-
current_handles¶ -
Should return a list of plot objects that have changed and should be updated.
-
debug( *args , **kwargs ) ¶ -
Inspect .param.debug method for the full docstring
-
defaults( *args , **kwargs ) ¶ -
Inspect .param.defaults method for the full docstring
-
force_new_dynamic_value= functools.partial(<function Parameters.deprecate.<locals>.inner>, <class 'holoviews.plotting.bokeh.plot.GridPlot'>) 
-
get_data( element , ranges , style ) ¶ -
Returns the data from an element in the appropriate format for initializing or updating a ColumnDataSource and a dictionary which maps the expected keywords arguments of a glyph to the column in the datasource.
-
get_param_values= functools.partial(<function Parameters.deprecate.<locals>.inner>, <class 'holoviews.plotting.bokeh.plot.GridPlot'>) 
-
get_value_generator= functools.partial(<function Parameters.deprecate.<locals>.inner>, <class 'holoviews.plotting.bokeh.plot.GridPlot'>) 
-
init_comm( ) ¶ -
Initializes comm and attaches streams.
-
inspect_value= functools.partial(<function Parameters.deprecate.<locals>.inner>, <class 'holoviews.plotting.bokeh.plot.GridPlot'>) 
-
link_sources¶ -
Returns potential Link or Stream sources.
-
matches( spec ) ¶ -
Matches a specification against the current Plot.
-
message( *args , **kwargs ) ¶ -
Inspect .param.message method for the full docstring
-
params( *args , **kwargs ) ¶ -
Inspect .param.params method for the full docstring
-
pprint( imports=None , prefix=' ' , unknown_value='<?>' , qualify=False , separator='' ) ¶ -
(Experimental) Pretty printed representation that may be evaluated with eval. See pprint() function for more details.
-
print_param_defaults( *args , **kwargs ) ¶ -
Inspect .param.print_param_defaults method for the full docstring
-
print_param_values( *args , **kwargs ) ¶ -
Inspect .param.print_param_values method for the full docstring
-
push( ) ¶ -
Pushes updated plot data via the Comm.
-
refresh( **kwargs ) ¶ -
Refreshes the plot by rerendering it and then pushing the updated data if the plot has an associated Comm.
-
script_repr( imports=[] , prefix=' ' ) ¶ -
Variant of __repr__ designed for generating a runnable script.
-
set_default( *args , **kwargs ) ¶ -
Inspect .param.set_default method for the full docstring
-
set_dynamic_time_fn= functools.partial(<function Parameters.deprecate.<locals>.inner>, <class 'holoviews.plotting.bokeh.plot.GridPlot'>) 
-
set_param= functools.partial(<function Parameters.deprecate.<locals>.inner>, <class 'holoviews.plotting.bokeh.plot.GridPlot'>) 
-
set_root( root ) ¶ -
Sets the root model on all subplots.
-
state¶ -
The plotting state that gets updated via the update method and used by the renderer to generate output.
-
state_pop( ) ¶ -
Restore the most recently saved state.
See state_push() for more details.
-
state_push( ) ¶ -
Save this instance’s state.
For Parameterized instances, this includes the state of dynamically generated values.
Subclasses that maintain short-term state should additionally save and restore that state using state_push() and state_pop().
Generally, this method is used by operations that need to test something without permanently altering the objects’ state.
-
sync_sources( ) ¶ -
Syncs data sources between Elements, which draw data from the same object.
-
traverse( fn=None , specs=None , full_breadth=True ) ¶ -
Traverses any nested DimensionedPlot returning a list of all plots that match the specs. The specs should be supplied as a list of either Plot types or callables, which should return a boolean given the plot class.
-
verbose( *args , **kwargs ) ¶ -
Inspect .param.verbose method for the full docstring
-
warning( *args , **kwargs ) ¶ -
Inspect .param.warning method for the full docstring
-
param Parameter


util
Module
-
holoviews.plotting.bokeh.util.attach_periodic( plot ) [source] ¶ -
Attaches plot refresh to all streams on the object.
-
holoviews.plotting.bokeh.util.categorize_array( array , dim ) [source] ¶ -
Uses a Dimension instance to convert an array of values to categorical (i.e. string) values and applies escaping for colons, which bokeh treats as a categorical suffix.
-
holoviews.plotting.bokeh.util.cds_column_replace( source , data ) [source] ¶ -
Determine if the CDS.data requires a full replacement or simply needs to be updated. A replacement is required if untouched columns are not the same length as the columns being updated.
-
holoviews.plotting.bokeh.util.colormesh( X , Y ) [source] ¶ -
Generates line paths for a quadmesh given 2D arrays of X and Y coordinates.
-
holoviews.plotting.bokeh.util.compute_plot_size( plot ) [source] ¶ -
Computes the size of bokeh models that make up a layout such as figures, rows, columns, widgetboxes and Plot.
-
holoviews.plotting.bokeh.util.convert_timestamp( timestamp ) [source] ¶ -
Converts bokehJS timestamp to datetime64.
-
holoviews.plotting.bokeh.util.date_to_integer( date ) [source] ¶ -
Converts support date types to milliseconds since epoch
Attempts highest precision conversion of different datetime formats to milliseconds since the epoch (1970-01-01 00:00:00). If datetime is a cftime with a non-standard calendar the caveats described in hv.core.util.cftime_to_timestamp apply.
- Args:
- date: Date- or datetime-like object
- Returns:
- Milliseconds since 1970-01-01 00:00:00
-
holoviews.plotting.bokeh.util.decode_bytes( array ) [source] ¶ -
Decodes an array, list or tuple of bytestrings to avoid python 3 bokeh serialization errors
-
holoviews.plotting.bokeh.util.empty_plot( width , height ) [source] ¶ -
Creates an empty and invisible plot of the specified size.
-
holoviews.plotting.bokeh.util.filter_batched_data( data , mapping ) [source] ¶ -
Iterates over the data and mapping for a ColumnDataSource and replaces columns with repeating values with a scalar. This is purely and optimization for scalar types.
-
holoviews.plotting.bokeh.util.filter_toolboxes( plots ) [source] ¶ -
Filters out toolboxes out of a list of plots to be able to compose them into a larger plot.
-
holoviews.plotting.bokeh.util.font_size_to_pixels( size ) [source] ¶ -
Convert a fontsize to a pixel value
-
holoviews.plotting.bokeh.util.get_tab_title( key , frame , overlay ) [source] ¶ -
Computes a title for bokeh tabs from the key in the overlay, the element and the containing (Nd)Overlay.
-
holoviews.plotting.bokeh.util.glyph_order( keys , draw_order=[] ) [source] ¶ -
Orders a set of glyph handles using regular sort and an explicit sort order. The explicit draw order must take the form of a list of glyph names while the keys should be glyph names with a custom suffix. The draw order may only match subset of the keys and any matched items will take precedence over other entries.
-
holoviews.plotting.bokeh.util.hold_policy( document , policy , server=False ) [source] ¶ -
Context manager to temporary override the hold policy.
-
holoviews.plotting.bokeh.util.hsv_to_rgb( hsv ) [source] ¶ -
Vectorized HSV to RGB conversion, adapted from: http://stackoverflow.com/questions/24852345/hsv-to-rgb-color-conversion
-
holoviews.plotting.bokeh.util.layout_padding( plots , renderer ) [source] ¶ -
Pads Nones in a list of lists of plots with empty plots.
-
holoviews.plotting.bokeh.util.match_dim_specs( specs1 , specs2 ) [source] ¶ -
Matches dimension specs used to link axes.
Axis dimension specs consists of a list of tuples corresponding to each dimension, each tuple spec has the form (name, label, unit). The name and label must match exactly while the unit only has to match if both specs define one.
-
holoviews.plotting.bokeh.util.multi_polygons_data( element ) [source] ¶ -
Expands polygon data which contains holes to a bokeh multi_polygons representation. Multi-polygons split by nans are expanded and the correct list of holes is assigned to each sub-polygon.
-
holoviews.plotting.bokeh.util.pad_plots( plots ) [source] ¶ -
Accepts a grid of bokeh plots in form of a list of lists and wraps any DataTable or Tabs in a WidgetBox with appropriate padding. Required to avoid overlap in gridplot.
-
holoviews.plotting.bokeh.util.pad_width( model , table_padding=0.85 , tabs_padding=1.2 ) [source] ¶ -
Computes the width of a model and sets up appropriate padding for Tabs and DataTable types.
-
class
holoviews.plotting.bokeh.util.periodic( document ) [source] ¶ -
Bases:
objectMocks the API of periodic Thread in hv.core.util, allowing a smooth API transition on bokeh server.
-
holoviews.plotting.bokeh.util.py2js_tickformatter( formatter , msg='' ) [source] ¶ -
Uses flexx.pyscript to compile a python tick formatter to JS code
-
holoviews.plotting.bokeh.util.recursive_model_update( model , props ) [source] ¶ -
Recursively updates attributes on a model including other models. If the type of the new model matches the old model properties are simply updated, otherwise the model is replaced.
-
Context manager to ensures data sources shared between multiple plots are cleared and updated appropriately avoiding warnings and allowing empty frames on subplots. Expects a list of shared_sources and a mapping of the columns expected columns for each source in the plots handles.
widgets
Module

-
class
holoviews.plotting.bokeh.widgets.BokehServerWidgets( plot , renderer=None , **params ) [source] ¶ -
Bases:
param.parameterized.ParameterizedBokehServerWidgets create bokeh widgets corresponding to all the key dimensions found on a BokehPlot instance. It currently supports to types of widgets sliders (which may be discrete or continuous) and dropdown widgets letting you select non-numeric values.
-
param Dict
display_options( allow_None=False, constant=False, default={}, instantiate=True, is_instance=True, pickle_default_value=True, precedence=None, readonly=False, watchers={} ) - Additional options controlling display options of the widgets.
-
param Boolean
editable( allow_None=False, bounds=(0, 1), constant=False, default=False, instantiate=False, pickle_default_value=True, precedence=None, readonly=False, watchers={} ) - Whether the slider text fields should be editable. Disabled by default for a more compact widget layout.
param ObjectSelector
position( allow_None=None, check_on_set=True, compute_default_fn=None, constant=False, default=right, instantiate=False, names=None, objects=[‘right’, ‘left’, ‘above’, ‘below’], pickle_default_value=True, precedence=None, readonly=False, watchers={} )param ObjectSelector
sizing_mode( allow_None=None, check_on_set=True, compute_default_fn=None, constant=False, default=fixed, instantiate=False, names=None, objects=[‘fixed’, ‘stretch_both’, ‘scale_width’, ‘scale_height’, ‘scale_both’], pickle_default_value=True, precedence=None, readonly=False, watchers={} )-
param Integer
width( allow_None=False, bounds=None, constant=False, default=250, inclusive_bounds=(True, True), instantiate=False, pickle_default_value=True, precedence=None, readonly=False, softbounds=None, time_dependent=False, time_fn=<Time Time00001>, watchers={} ) - Width of the widget box in pixels
-
param String
basejs( allow_None=True, basestring=<class ‘str’>, constant=False, default=None, instantiate=False, pickle_default_value=True, precedence=-1, readonly=False, regex=None, watchers={} ) - Defines the local CSS file to be loaded for this widget.
-
param String
extensionjs( allow_None=True, basestring=<class ‘str’>, constant=False, default=None, instantiate=False, pickle_default_value=True, precedence=-1, readonly=False, regex=None, watchers={} ) - Optional javascript extension file for a particular backend.
-
param String
css( allow_None=True, basestring=<class ‘str’>, constant=False, default=None, instantiate=False, pickle_default_value=True, precedence=-1, readonly=False, regex=None, watchers={} ) - Defines the local CSS file to be loaded for this widget.
-
classmethod
create_widget( dim , holomap=None , editable=False ) [source] ¶ -
” Given a Dimension creates bokeh widgets to select along that dimension. For numeric data a slider widget is created which may be either discrete, if a holomap is supplied or the Dimension.values are set, or a continuous widget for DynamicMaps. If the slider is discrete the returned mapping defines a mapping between values and labels making it possible sync the two slider and label widgets. For non-numeric data a simple dropdown selection widget is generated.
-
debug( *args , **kwargs ) ¶ -
Inspect .param.debug method for the full docstring
-
defaults( *args , **kwargs ) ¶ -
Inspect .param.defaults method for the full docstring
-
force_new_dynamic_value= functools.partial(<function Parameters.deprecate.<locals>.inner>, <class 'holoviews.plotting.bokeh.widgets.BokehServerWidgets'>) 
-
get_param_values= functools.partial(<function Parameters.deprecate.<locals>.inner>, <class 'holoviews.plotting.bokeh.widgets.BokehServerWidgets'>) 
-
get_value_generator= functools.partial(<function Parameters.deprecate.<locals>.inner>, <class 'holoviews.plotting.bokeh.widgets.BokehServerWidgets'>) 
-
get_widgets( ) [source] ¶ -
Creates a set of widgets representing the dimensions on the plot object used to instantiate the widgets class.
-
inspect_value= functools.partial(<function Parameters.deprecate.<locals>.inner>, <class 'holoviews.plotting.bokeh.widgets.BokehServerWidgets'>) 
-
message( *args , **kwargs ) ¶ -
Inspect .param.message method for the full docstring
-
params( *args , **kwargs ) ¶ -
Inspect .param.params method for the full docstring
-
pprint( imports=None , prefix=' ' , unknown_value='<?>' , qualify=False , separator='' ) ¶ -
(Experimental) Pretty printed representation that may be evaluated with eval. See pprint() function for more details.
-
print_param_defaults( *args , **kwargs ) ¶ -
Inspect .param.print_param_defaults method for the full docstring
-
print_param_values( *args , **kwargs ) ¶ -
Inspect .param.print_param_values method for the full docstring
-
script_repr( imports=[] , prefix=' ' ) ¶ -
Variant of __repr__ designed for generating a runnable script.
-
set_default( *args , **kwargs ) ¶ -
Inspect .param.set_default method for the full docstring
-
set_dynamic_time_fn= functools.partial(<function Parameters.deprecate.<locals>.inner>, <class 'holoviews.plotting.bokeh.widgets.BokehServerWidgets'>) 
-
set_param= functools.partial(<function Parameters.deprecate.<locals>.inner>, <class 'holoviews.plotting.bokeh.widgets.BokehServerWidgets'>) 
-
state_pop( ) ¶ -
Restore the most recently saved state.
See state_push() for more details.
-
state_push( ) ¶ -
Save this instance’s state.
For Parameterized instances, this includes the state of dynamically generated values.
Subclasses that maintain short-term state should additionally save and restore that state using state_push() and state_pop().
Generally, this method is used by operations that need to test something without permanently altering the objects’ state.
-
verbose( *args , **kwargs ) ¶ -
Inspect .param.verbose method for the full docstring
-
warning( *args , **kwargs ) ¶ -
Inspect .param.warning method for the full docstring
-
param Dict